Clostridium difficile is a major cause of hospital-acquired infection (HAI) in the United States.1 The Centers for Disease Control (CDC) classified C. difficile infection (CDI) as an urgent threat in a 2013 report.1 – Reference Polage, Gyorke and Kennedy 3 The CDC estimates that, annually, 29,000 Americans die within 30 days of an initial diagnosis of CDI, 15,000 directly attributable to C. difficile. 1 – Reference Polage, Gyorke and Kennedy 3 The estimated cost of CDI to the healthcare system is $1–4.9 billion each year.Reference Polage, Gyorke and Kennedy 3 – Reference Evans and Safdar 5
With 170 medical centers, the Veterans’ Health Administration (VA) is one of the largest integrated healthcare systems in the United States; it provides care to >9 million veterans. Previous studies have shown that CDI rates within the VA have been increasing.Reference Kralovic, Simbartl and LH 6 Increased incidence of CDI correlates with the increased use of molecular-based testing methods such as polymerase chain reaction (PCR).Reference Polage, Gyorke and Kennedy 3 The number of PCR-based tests for CDI performed in the VA increased from 33% in 2010 to 81% in 2015.Reference Evans, Kralovic, Simbartl, Jain and Roselle 7 Regional variations exist for CDI; the highest rates occur in the New England and Middle Atlantic regions and the lowest rates occur in the West, the East, and South Central regions.Reference Steiner, Barret and Weiss 8
Prior studies have reported rates of hospital-onset healthcare facility-associated (HO-HCFA) CDI within the VA system to be higher than those reported outside the VA.Reference Evans, Simbartl, Kralovic, Jain and Roselle 9 In 2012, the VA instituted mandatory reporting of HO-HCFA. Discrepancies, however, existed in the reporting of “hospital-acquired” C. difficile between the VA and the CDC. The CDC defines HO-HCFA CDI as a positive stool sample collected >3 days after admission, but until recently, the VA definition was a positive test collected >48 hours after admission.Reference Evans, Simbartl, Kralovic, Jain and Roselle 9 , 10 Therefore, an overestimation of HO-HCFA CDI rates may have occurred using the prior VA definition versus the CDC definition.
Antimicrobial use is a well-known factor contributing to CDI. Clindamycin, cephalosporins, and fluoroquinolones are among the most notable antibiotics predisposing patients to CDI.Reference Muto, Pokrywka and Shutt 11 , Reference Gerding 12 Antimicrobial stewardship programs work to control CDI by reducing unnecessary antimicrobial use. The VA infection prevention programs include mandatory reporting of hospital-acquired CDI.
In this study, we characterized CDI in the VA over an 11-year period. We also evaluated the respective impacts of the VA’s mandatory reporting, antimicrobial usage, the advent of molecular testing, mortality, and seasonality of infection. State-specific CDI incidences were also calculated.
Methods
Ethics statement
The project was approved by the Institutional Review Board of the Veterans Affairs Western New York Health Care System prior to approval for nationwide data collection. Informed consent was waived and anonymity was assured for this study.
Study design
This retrospective cohort study was conducted among the VA patients admitted to acute-care facilities within the continental United States from January 1, 2006, to December 31, 2016, who had stool testing for C. difficile.
Population and description of the VA databases
The cohort included adult patients, aged 18 years and over, admitted to an acute-care VA hospital who had had stool testing for C. difficile. Data were extracted from the VA’s Corporate Data Warehouse (CDW) database. The CDW contains medical information from the Veterans Health Information Systems and Technology Architecture and several other VA clinical and administrative systems. In total, 119 acute-care facilities were included. All data collection and analyses were performed at the Veterans’ Affairs Western New York Health Care System in Buffalo, New York.
Identification of C. difficile infection (CDI)
Within the CDW, lab tests are named and coded. Using the key words ‘dif,’ ‘clos,’ ‘gdh,’ ‘nap,’ ‘027,’ and ‘tox,’ we identified a cohort of patients that had any C. difficile test during an admission period. A case of CDI was defined as any stool positive for C. difficile via PCR, toxin assay, glutamate dehydrogenase + (toxin or PCR) assay, or by culture. Laboratory tests with results that were indeterminate, cancelled, or incomprehensible (null result) were excluded.
Identification of antimicrobial usage
A case of antibiotic use was defined as administration of 1 or more antibiotics from a single antibiotic class within 90 days prior to the date of C. difficile test. Duration of antibiotic use was not calculated.Reference Balinskaite, Johnson, Holmes and Aylin 13 , Reference Brown, Fisman, Moineddin and Daneman 14 Within the CDW, all medications are named and coded. Using the key words ‘cef,’ ‘flox,’ and ‘clind,’ we identified antibiotics of interest. Antibiotics were then pooled into groups: fluoroquinolones (FQs), third-generation cephalosporins, and clindamycin. Fluoroquinolones consisted of ciprofloxacin, gatifloxacin, levofloxacin, moxifloxacin, and norfloxacin. Cephalosporins consisted of ceftazidime/avibactam, cefdinir, cefixime, cefotaxime, cefpodoxime, ceftazidime, ceftizoxime, and ceftriaxone. Cefepime was not included in this analysis because we examined classic antibiotics contributing to CDI, the third-generation cephalosporins, FQs, and clindamycin.Reference Gerding 12
Calculation of CDI incidence
We calculated CDI incidence by dividing the total number of positive C. difficile laboratory-identified events by total admission days. Laboratory-identified (LabID) event reporting is based on laboratory testing data without clinical evaluation of the patient, and the time of the test was defined as the time at which the stool sample for C. difficile was collected. Any positive LabID event ≤14 days from a previous positive LabID event was defined as a duplicate case. Any new positive LabID event >14 days but ≤56 days from a previous positive LabID event was defined as a recurrent case. Duplicate and recurrent cases were excluded from the CDI incidence analysis. Cases of HO-HCFA CDI were identified using the prior VA definition (ie, onset >48 hours from admission). Total patient admission days from all acute-care hospitals that had any positive testing for CDI were used to determine the denominator (patient days). Any VA hospital that did not have any positive testing was excluded from the analysis of patient days. Monthly and yearly incidences of total CDI were calculated as cases per 10,000 patient days.
Calculation of time to testing
Time to testing was calculated by deducting the time of admission from the time of first C. difficile test collection regardless of the type of result. Time to positivity was calculated by deducting the time of admission from the time of the first positive C. difficile test collection. The intent of this method of time-to-testing was to assess potential reasons for the reduction in HO-HCFA CDI.
Calculation of 30-day mortality
We calculated 30-day mortality from all patients with a positive C. difficile via LabID event by deducting the time of test collection from time of death. Those with a time of death within 30 days of the positive LabID event were included in the incidence analysis for 30-day mortality.
Heat map
Alaska and New Hampshire were not included on the heat map because they did not have an operational acute-care VA hospital during the study period. States and territories outside the continental United States (Hawaii and Puerto Rico) were excluded. State-specific rates for Iowa, Nebraska, Kansas, and Missouri could not be determined because their healthcare system station numbers (a VA terminology that identifies each facility) overlap between states.
ICD Codes
The discharge diagnosis codes for CDI were obtained: the International Classification of Disease, Ninth Revision (ICD-9) was 8.45 and the ICD-10 code was 4.7-4.72.
Statistics
Time series analysis with a transfer function was performed to determine the respective impacts of the increased use of PCR testing, antimicrobial use, and VA reporting intervention on the incidences of total CDI, HO-HCFA CDI, and 30-day CDI mortality.Reference McFarland, Clarridge, Beneda and Raugi 15 , Reference Alijandai 16 Seasonality was accounted for using a differencing order of 1 to transform the data.Reference Reil, Hensgens and Kuijper 17 Time series was performed using seasonal auto regressive integrated moving average (ARIMAX). The lags for the time series were determined using the Box-Jenkins method.Reference Alijandai 16 We recorded 12 observations per period. All P values were based on 2-tailed tests, and a P value <.05 was considered significant. Heat maps were completed to show the overall incidence of total and HO-HCFA CDI in 2016 as well as the trend in total and HO-HCFA CDI post-VA reporting initiative from 2013 to 2016. Statistics were performed using SAS and JMP version 13 software (SAS Institute, Cary, NC).
Results
In total, 472,346 patients were tested for C. difficile during the study period; 136,603 positive C. difficile LabID events were recorded. Of those, 55,808 were considered duplicates and 11,800 were recurrences. Excluding those results, 68,995 new cases of CDI were included in the incidence analysis.
Trends in overall total CDI incidence per 10,000 patient days
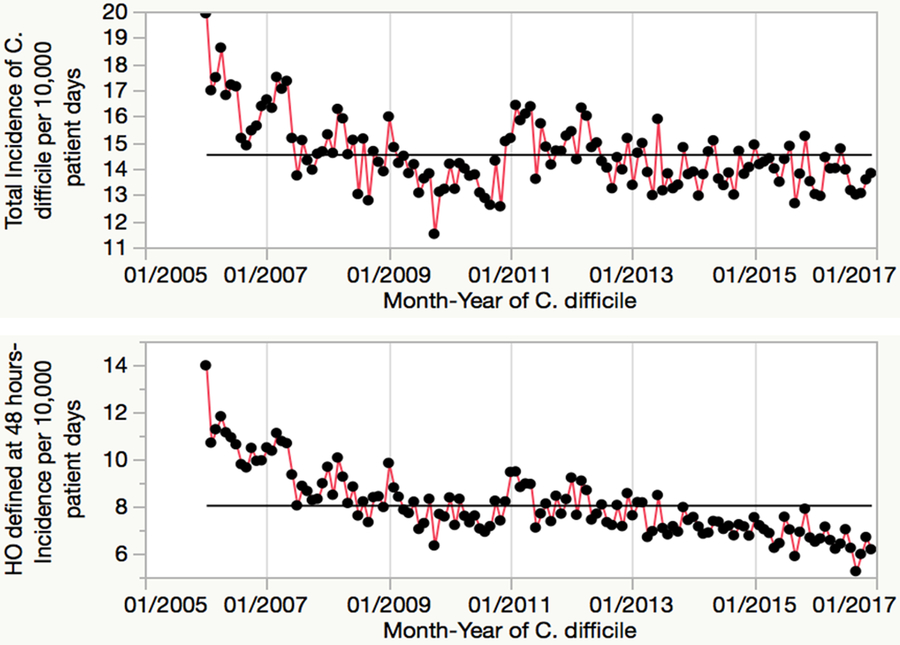
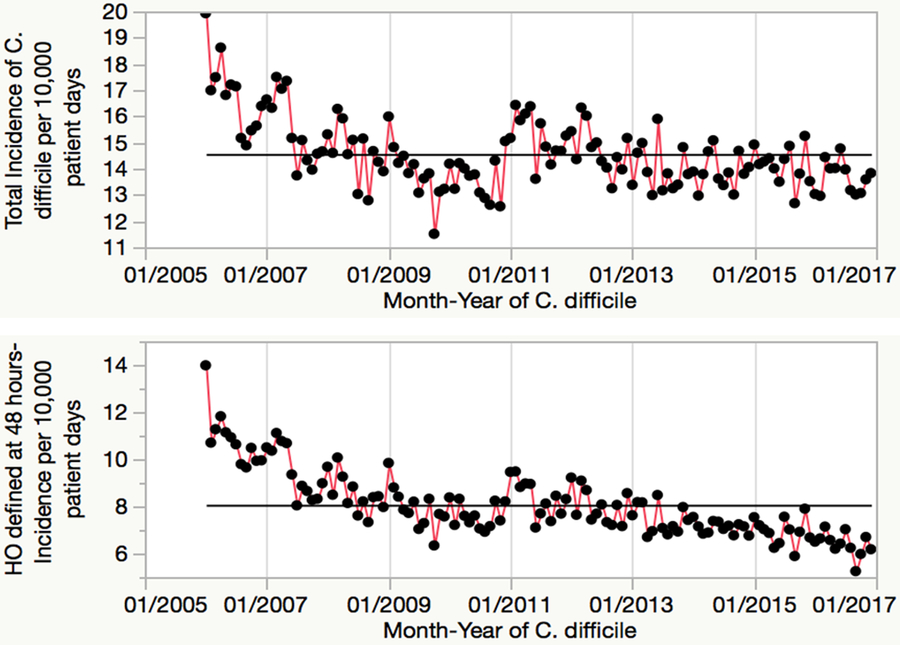
The incidence of total inpatient C. difficile per 10,000 patient days decreased from 16.81 in 2006 to 13.63 in 2010. After a brief increase to 15.23 in 2011, a gradual decrease occurred from 14.77 in 2012 to 13.66 in 2016 (Fig. 1). The data exhibited seasonality, and CDI rates per 10,000 patient days were higher in the winter compared to the summer. For example, the incidence was 19.9 in January of 2006 but decreased to 17.1 by July 2006, and in 2007, the CDI incidence was 16.6 in January compared to 13.7 in July. Likewise, in 2008, the January incidence was 15.3 and the July incidence was 13.0.
Trends in Clostridium difficile infection (CDI) per 10,000 patient days. These graphs show the seasonal variation and overall decline of CDI over the study period. The black line shows the mean of CDI per 10,000 patient days.
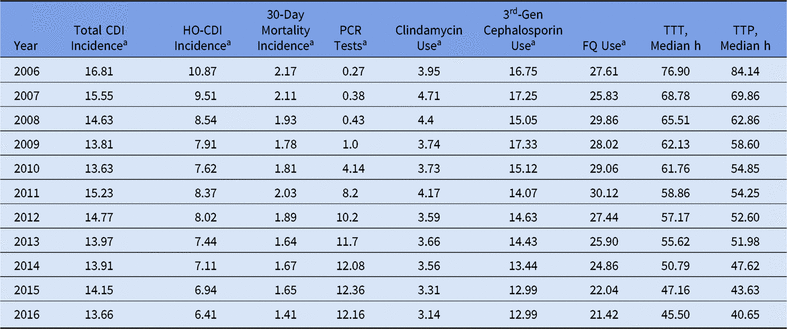
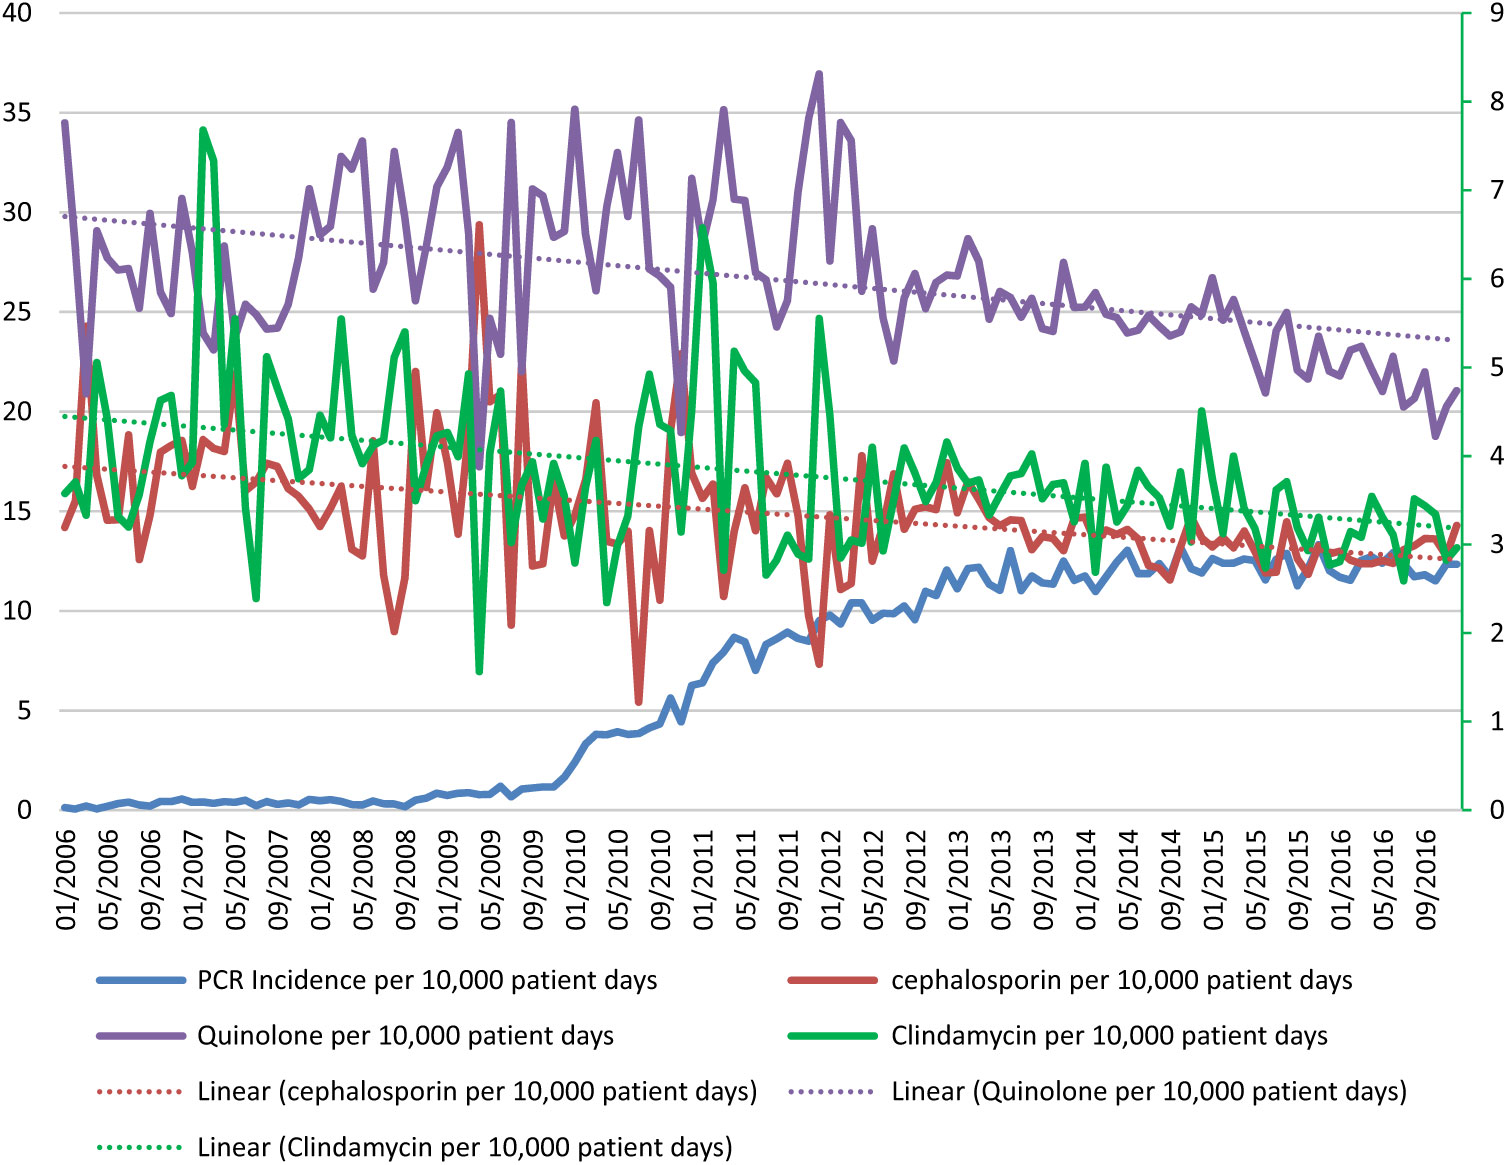
Among this cohort of patients tested for CDI, antibiotic usage decreased with time. Use decreased from 16.75 cases of cephalosporin use per 10,000 patient days in 2006 to 12.99 in 2016. Clindamycin use decreased from 3.95 cases of use in 2006 to 3.14 in 2016. Fluoroquinolone use decreased from a count of 27.61 uses per 10,000 patient days in 2006 to 21.42 in 2016 (Table 1).
Clostridium difficile Infection Incidence and Related Factors

Note: CDI, C. difficile infection; HO-HCFA, hospital-onset healthcare facility-associated; PCR, polymerase chain reaction test; TTT, time to testing; TTP, time to positivity; Gen, generation.
a Per 10,000 patient days.
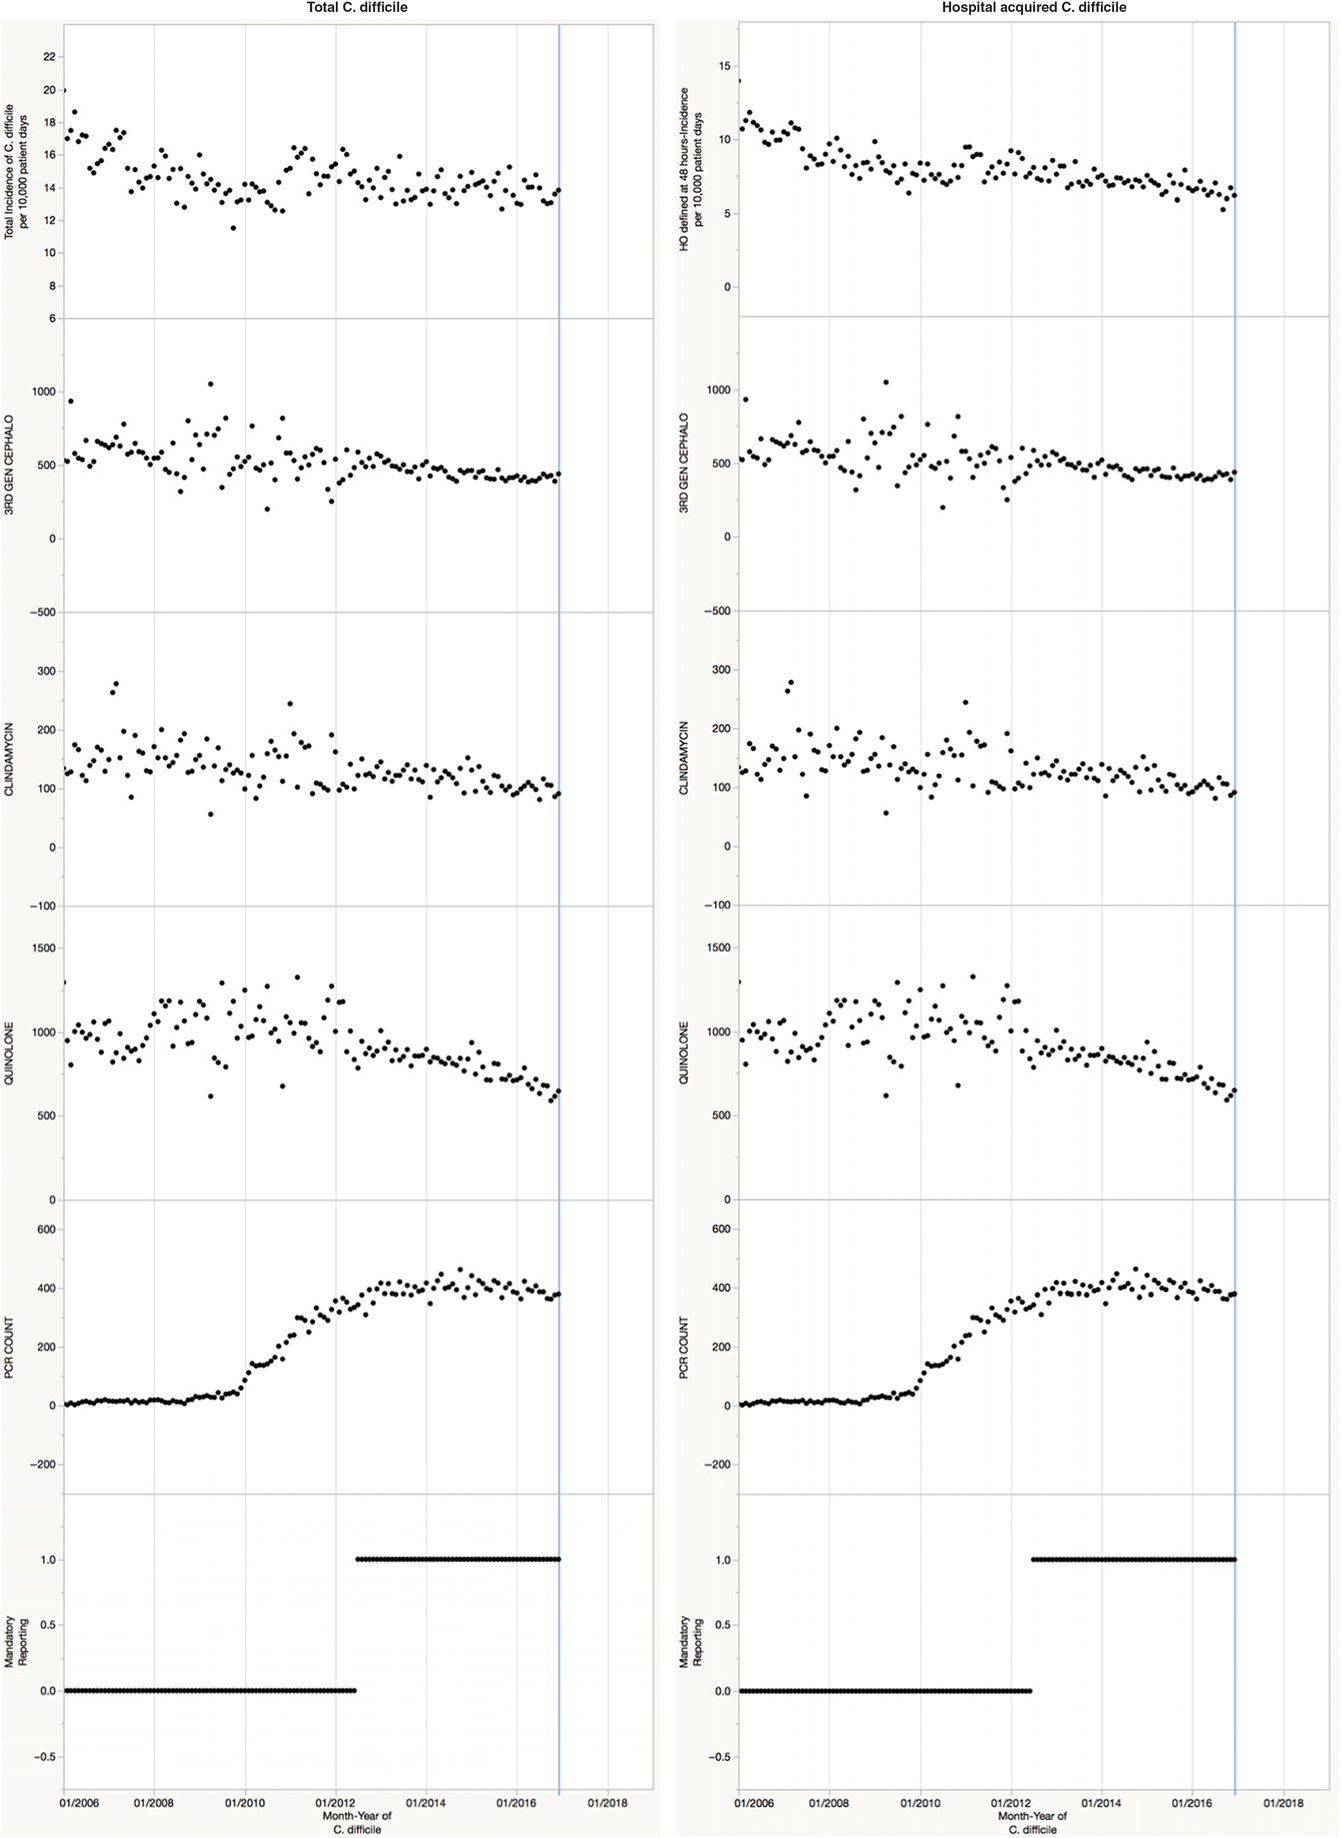
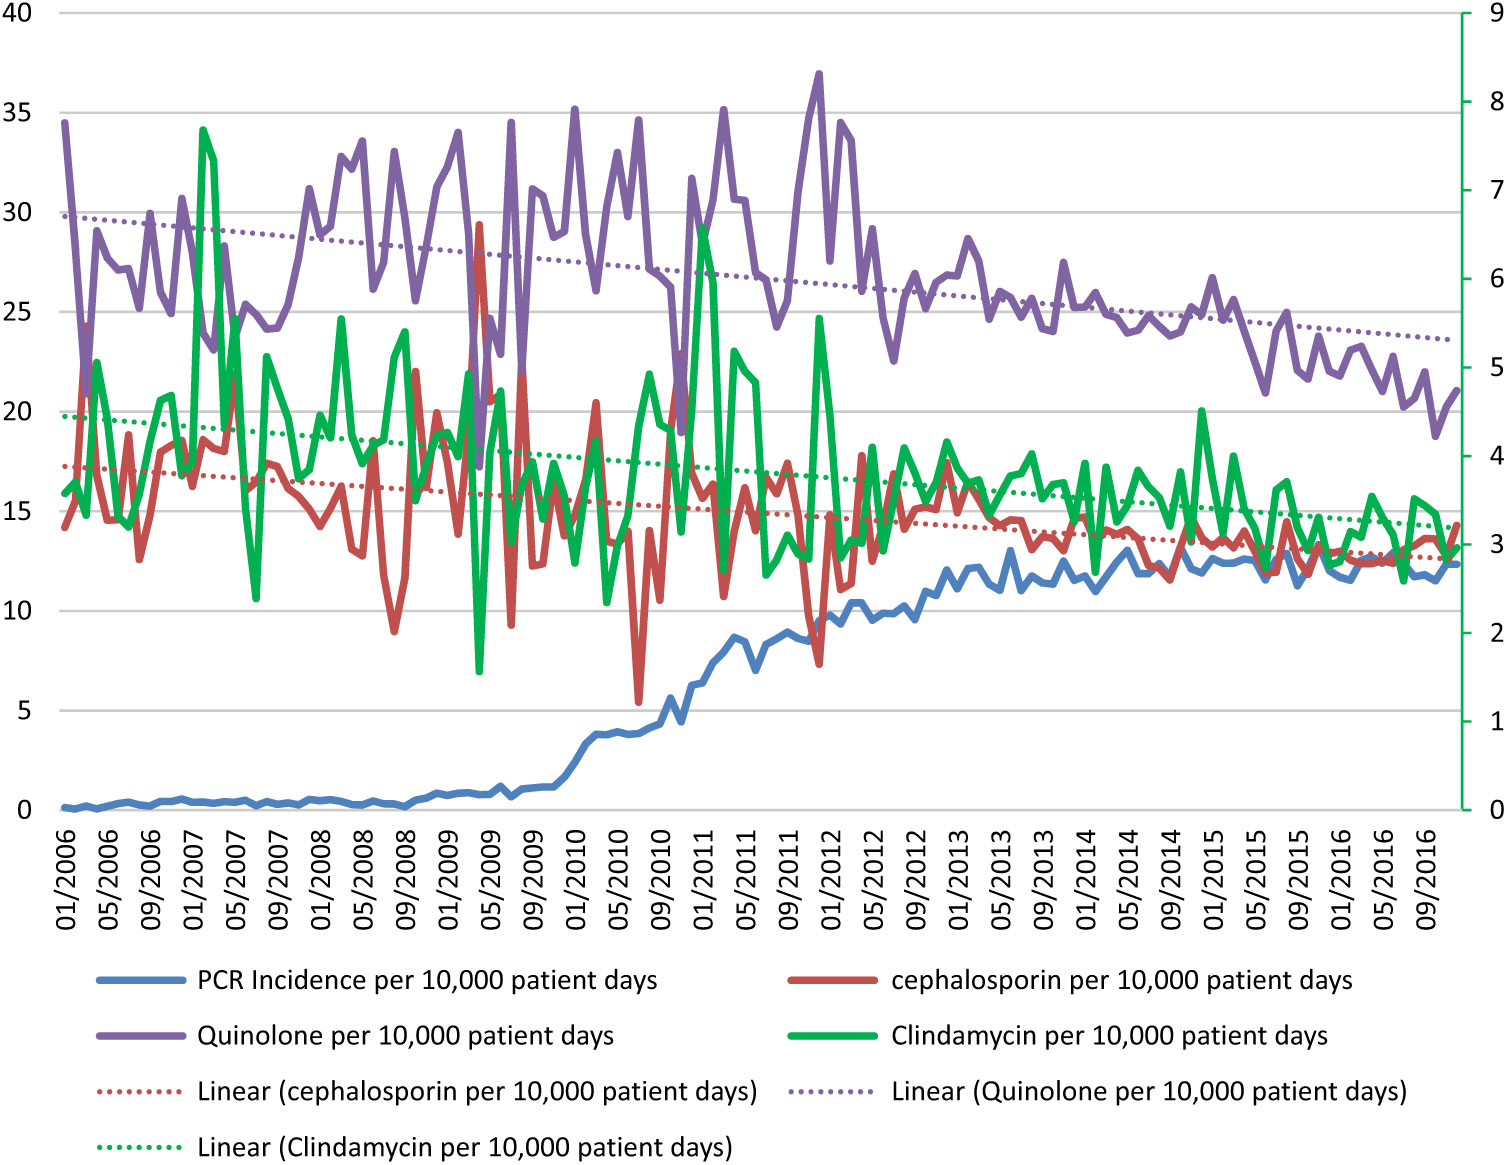
The number of PCR-based tests performed, VA mandatory reporting, cephalosporin, clindamycin and fluoroquinolone use were included in the time series analysis (Figs. 2 and 3). The total increase in CDI incidence in 2010 coincided with the increased use of molecular testing within the VA (P < .0001). The number of PCR-based tests performed increased throughout the study period. In 2006, the incidence of the number of PCR-based tests performed per 10,000 patient days was 0.27, by 2016, the incidence had risen to 12.16. Decreased antibiotic use of fluoroquinolones (P < .0001), clindamycin (P = .0006), and third-generation cephalosporins (P < .0002) was associated with a decrease in the CDI rate. VA mandatory reporting did not influence CDI rates in the VA (P = .24).
Time series analysis of Clostridum difficile infection (CDI) incidence per 10,000 patient days. Time series graphs represents CDI per 10,000 patient days in the VA system, and the decline in antibiotic usage (a case of antibiotic usage) including third-generation cephalosporins, clindamycin and fluoroquinolone use. The graph is also representative of a rise in PCR testing as the primary test used to identify C. difficile.
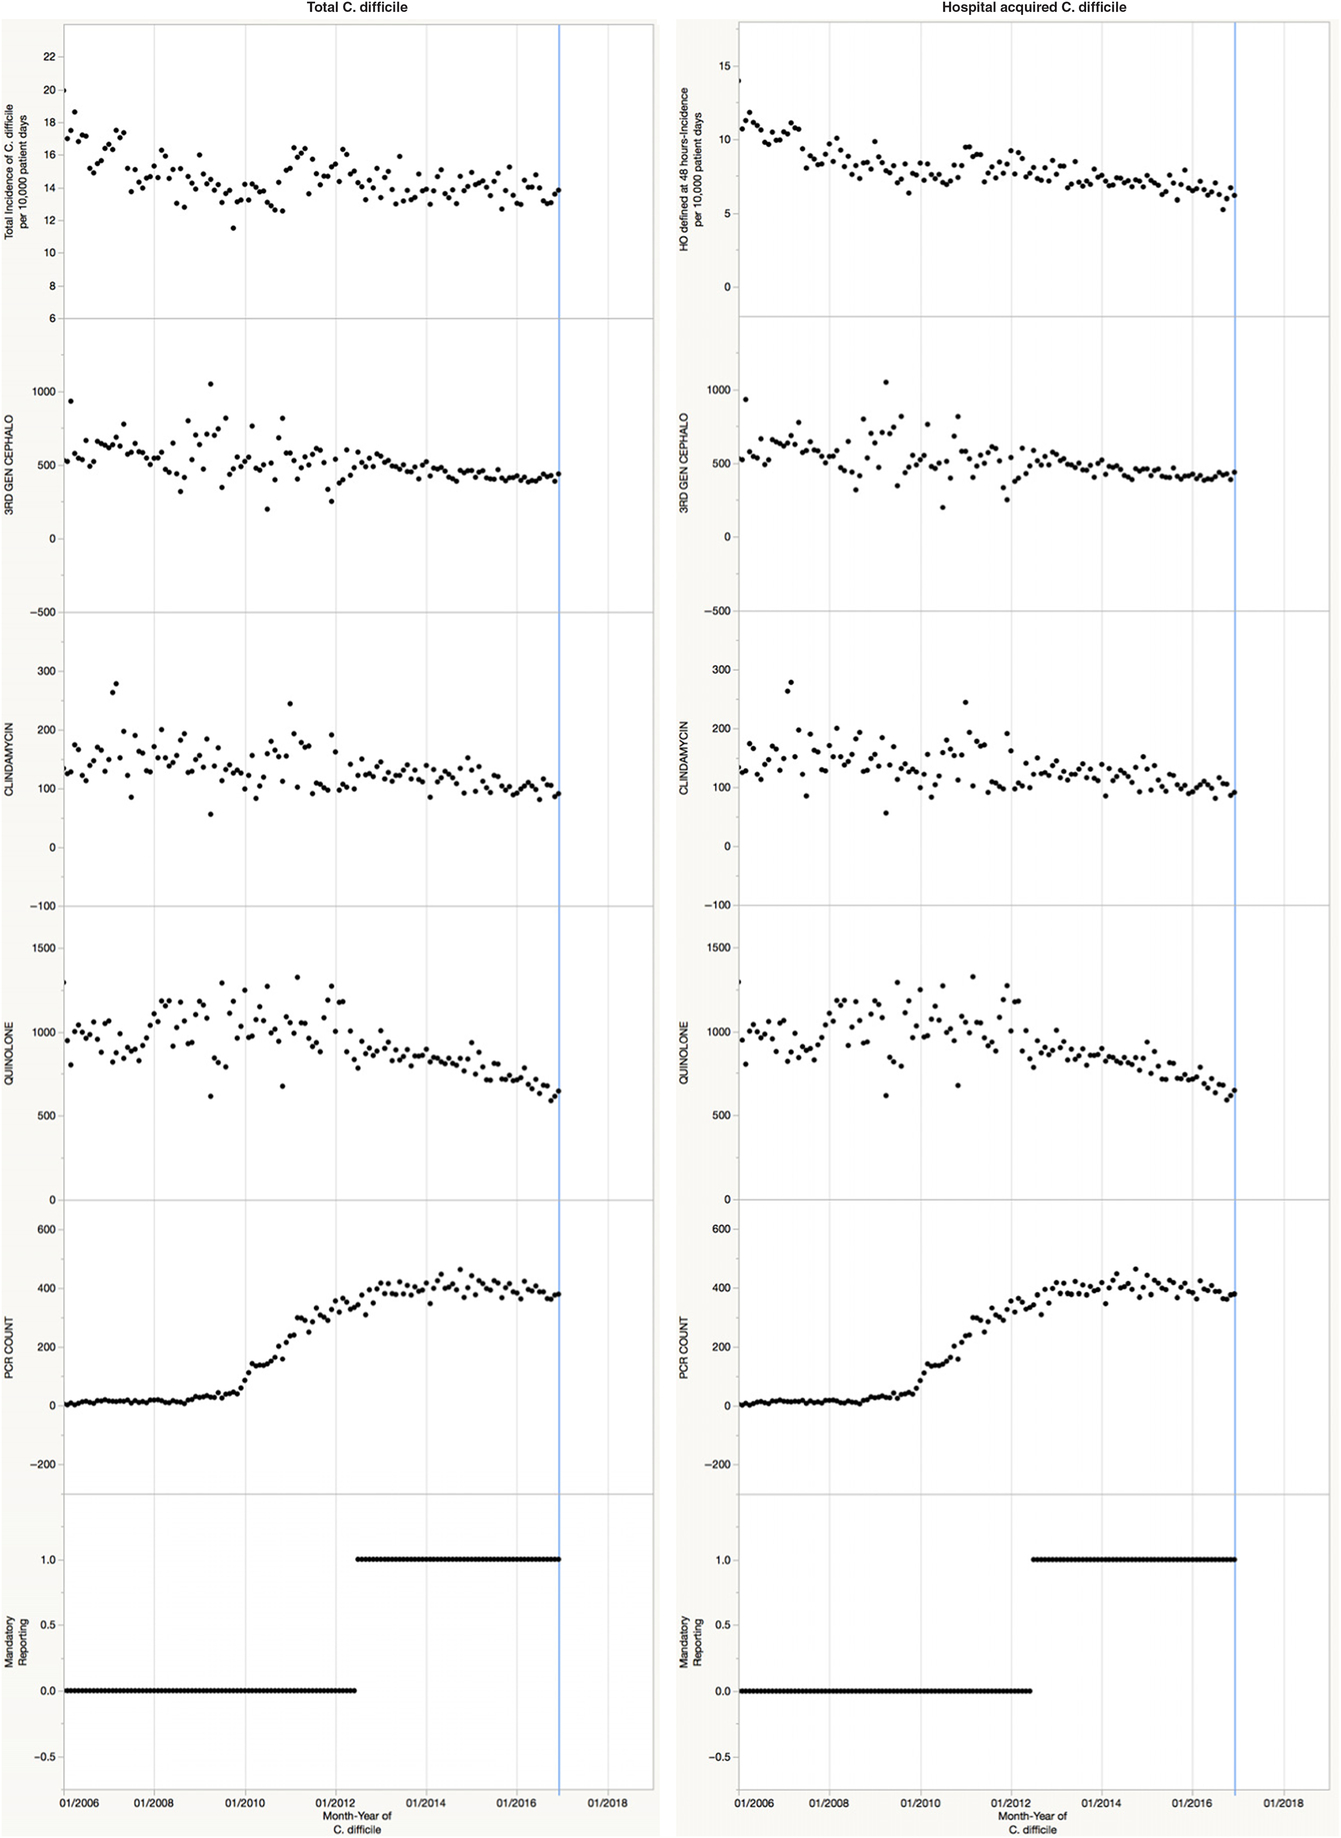
Antibiotic use and PCR testing per 10,000 patient days. The graph shows the downward trend in third-generation cephalosporin, clindamycin, and fluoroquinolone use. Clindamycin corresponds to the y-axis on the right. The number of PCR-based tests performed per 10,000 patient days trended upward throughout the study period.
Trends in HO-HCFA CDI per 10,000 patient days
The incidence of HO-HCFA CDI initially decreased from 10.87 cases per 10,000 patient days in 2006 to 7.62 in 2010. In 2011, a brief increase in incidence (8.37) occurred, followed by a gradual decrease from 2012 (8.02) to 2016 (6.41). In July 2012, the VA implemented mandatory reporting of HO-HCFA CDI defined as positive C. difficile tested >48 hours after admission. The Time series for HO-HCFA CDI incidence per 10,000 patient days demonstrated a statistically significant correlation between the increase in rates of HO-HCFA CDI with the use of PCR (P < .0001). Rates of decline of HO-HCFA were also associated with reductions in the use of third-generation cephalosporins, clindamycin, and fluoroquinolones. The mandatory reporting initiative had no statistical impact on the rate of CDI (P = .72) (Fig. 2). The median time from admission to testing in 2006 was 76.9 hours, which decreased to 45.5 hours by 2016.
Trends in 30-day CDI mortality
The overall crude 30-day mortality from the time of testing in patients with CDI decreased from 2006 (2.17) to 2016 (1.41 deaths per 10,000 patient days). The time series analysis model included PCR, third-generation cephalosporins, fluoroquinolones, clindamycin, and mandatory reporting. The overall decrease in CDI mortality correlated with PCR testing (P = .0003). Decreased clindamycin (P = .75), cephalosporin (P = .94), and fluoroquinolone use (P = .99) had no impact on mortality, nor did mandatory reporting (P = .94).
Trends in nationwide incidence of CDI after the VA initiative
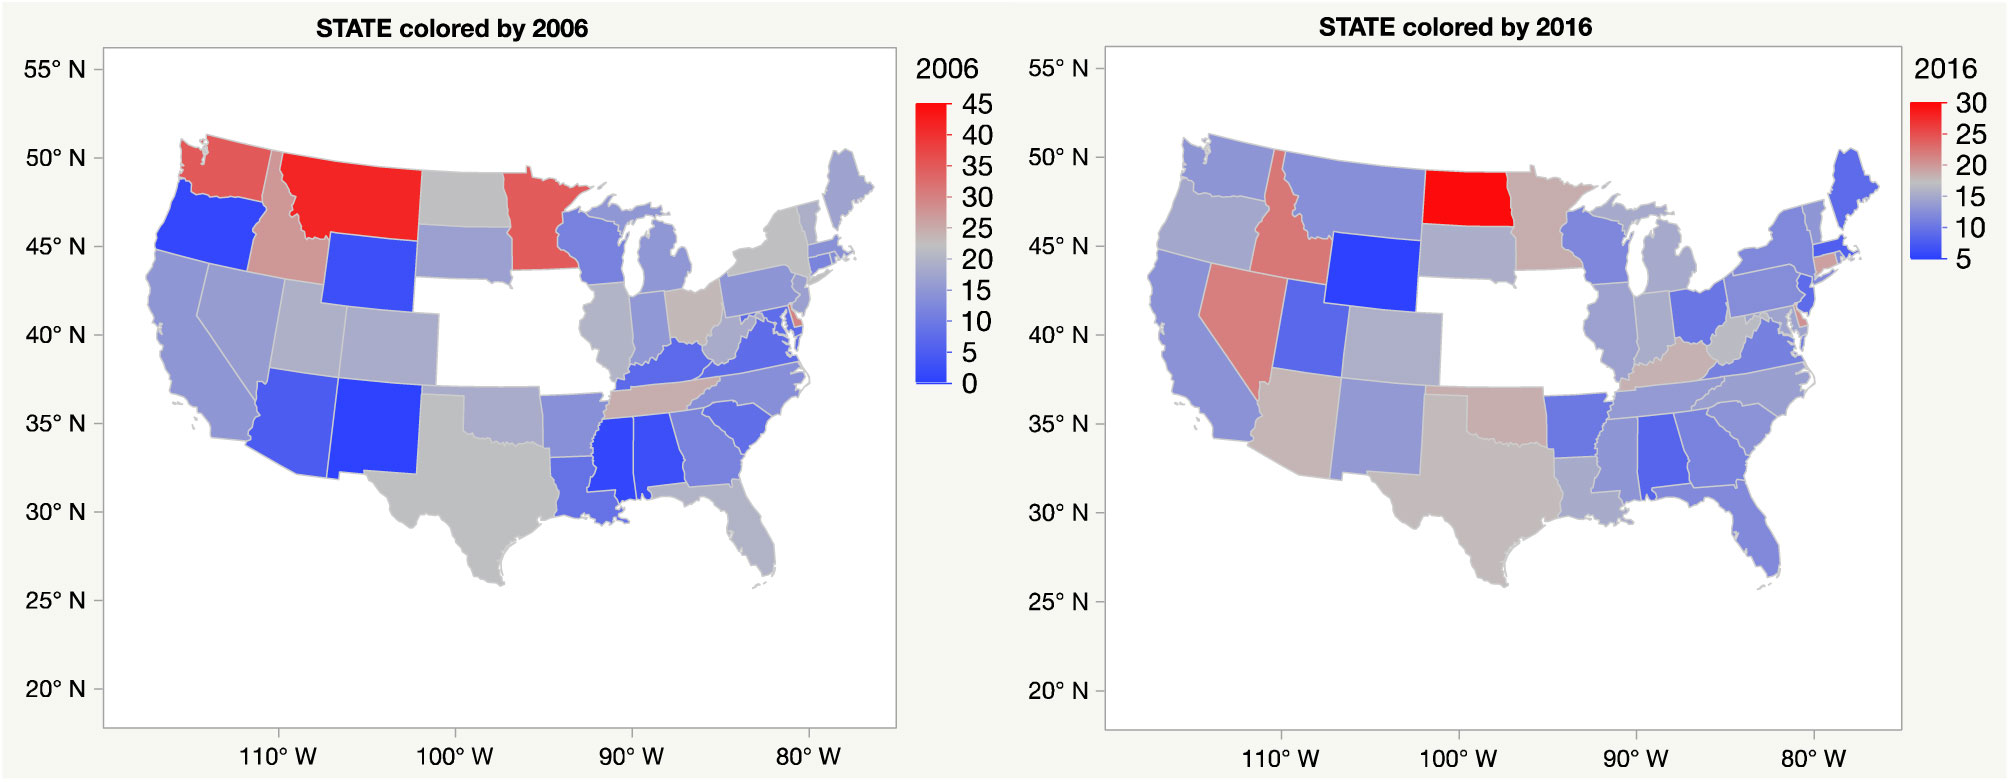
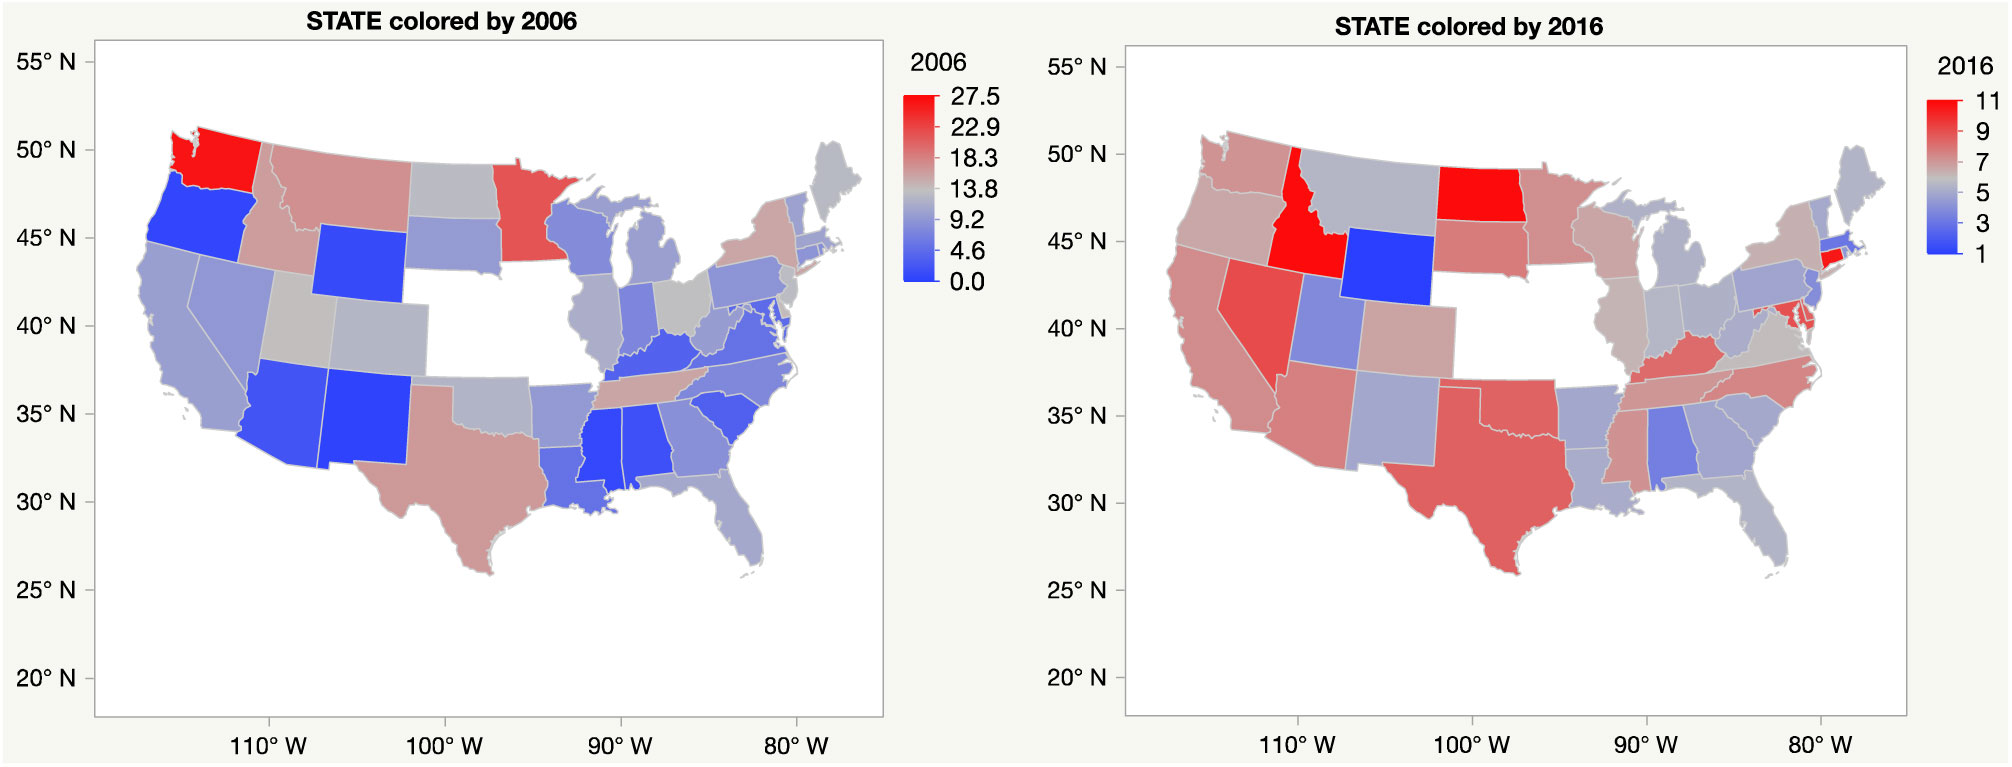
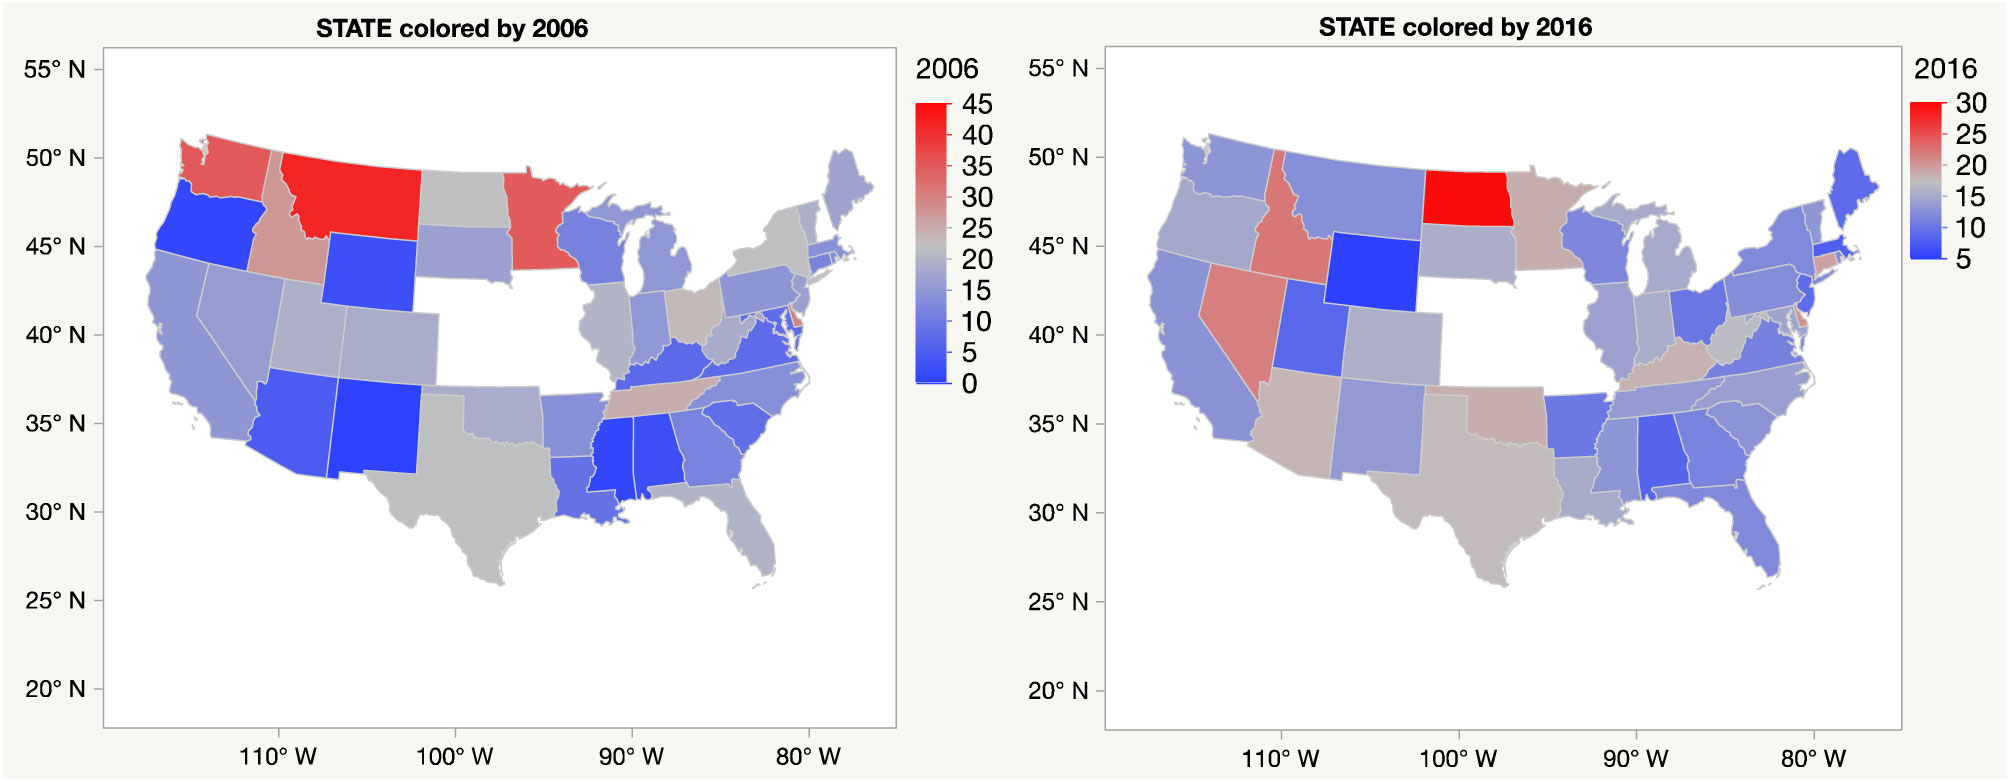
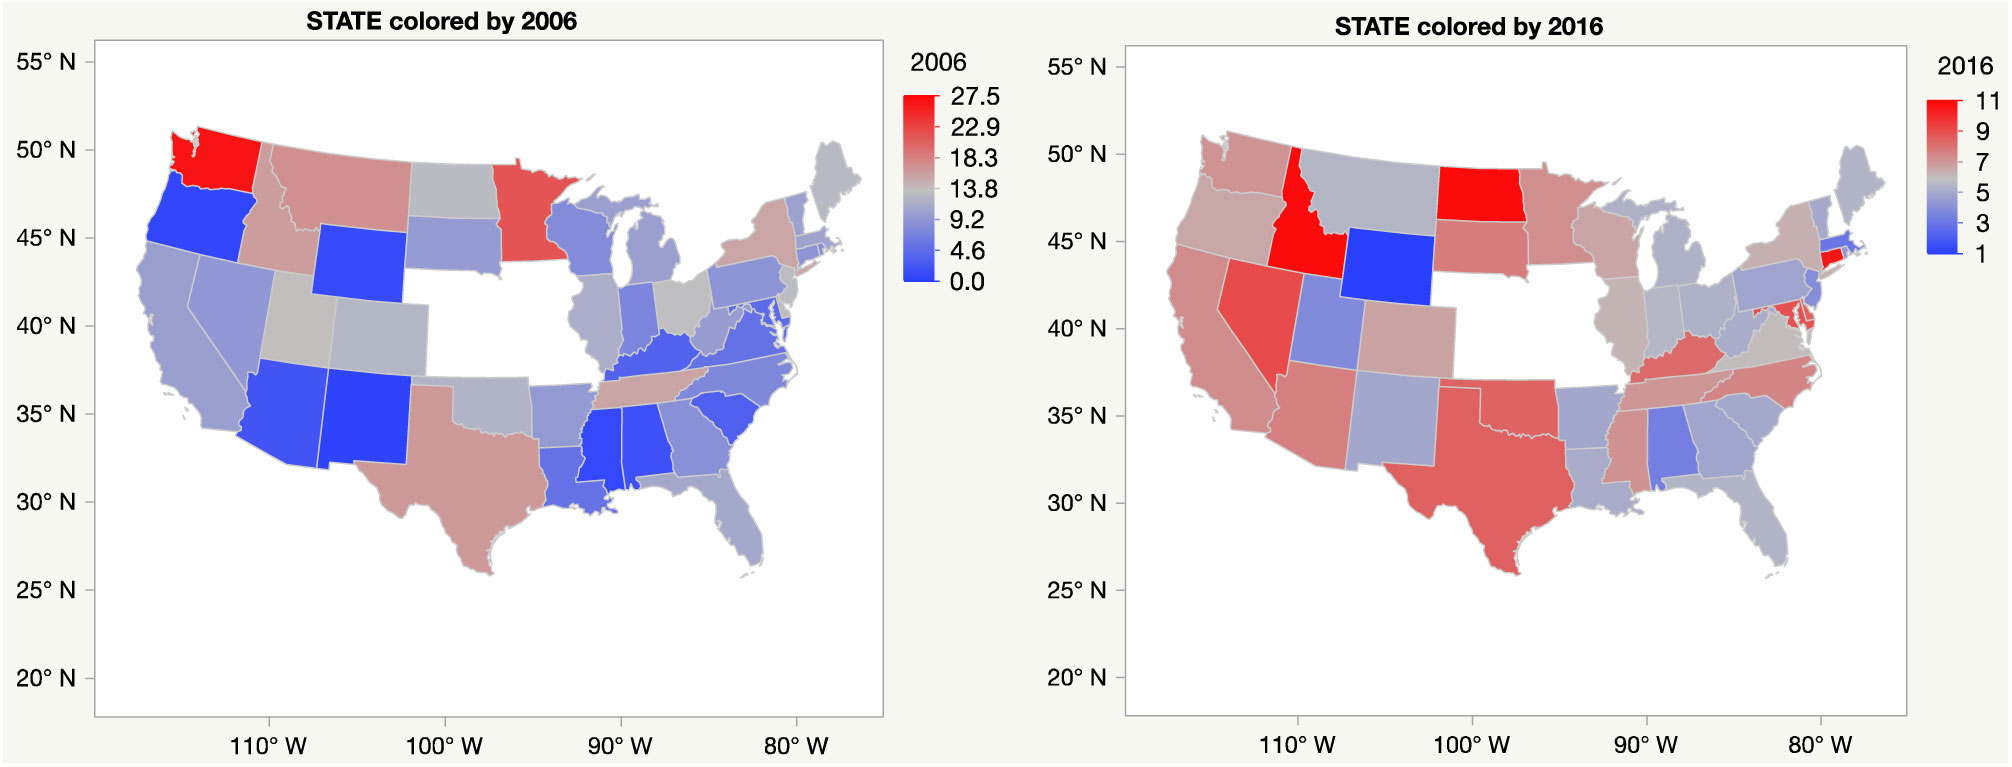
Most states experienced a downward trend in total and HO-HCFA CDI after the VA implemented mandatory reporting. However, several states had upward trends in incidence of total and HO-HCFA CDI (Figs. 4 and 5).
Heat map of total incidence of C. difficile infection (CDI) in 2006 and 2016. Incidence is shown in CDI per 10,000 patient days. Iowa (IA), Nebraska (NE), Kansas (KS), and Missouri (MO) could not be determined because as their healthcare systems station numbers overlap between states.
Heat map of hospital-onset healthcare facility-associated (HO-HCFA) incidence of C. difficile infection (CDI) in 2006 and 2016. Incidence is shown in HO-HCFA CDI per 10,000 patient days. Iowa (IA), Nebraska (NE), Kansas (KS), and Missouri (MO) could not be determined because their healthcare systems station numbers overlap between states. Please note the difference in color scales.
Frequency of ICD-9 and ICD-10 discharge diagnosis codes
Within those patients with a positive LabID event for CDI, the ICD-9 and ICD-10 codes for CDI were examined within discharge diagnoses. The discharge diagnosis code for CDI was used in only 73.3% of cases. The overall trend in the use of these ICD-9 and ICD-10 codes shows an increase since 2006 (Table 1).
Discussion
In the span of a decade, the overall incidence of CDI has decreased within acute-care VA hospitals. Temporal increases in CDI incidence were associated with the implementation of molecular methods of testing such as PCR. This effect has also been described in other reports attributing the increase to more sensitive testing modalities.Reference Reveles, Lawson and Mortensen 18 Evans et alReference Evans, Kralovic, Simbartl, Jain and Roselle 7 , Reference Evans, Simbartl, Kralovic, Jain and Roselle 9 showed similar findings of rise in molecular testing during a shorter timeframe from October 2010 to June 2012 within the VA system. By broadening the study period to 11 years and using time series analysis adjusted for seasonality, we showed that this increase in total CDI incidence was related to the rise in the number of PCR-based tests performed (P < .0001). The seasonality of CDI has been described in previous studies.Reference McFarland, Clarridge, Beneda and Raugi 15 , Reference Reil, Hensgens and Kuijper 17 , Reference Polgreen, Yang, Bohnett and Cavanaugh 19 CDI was elevated in the winter months of our study. Another study found more cases of CDI in January–March than in other months in Germany over a 10-year period.Reference Reil, Hensgens and Kuijper 17
Antibiotic use is associated with CDI occurrence. Although all antimicrobials can cause CDI, clindamycin, cephalosporins, and fluoroquinolones are among the largest contributors to CDI.Reference Muto, Pokrywka and Shutt 11 , Reference Gerding 12 The VA began an antimicrobial stewardship (ASP) initiative in mid-2010 and coordinated efforts via the National Antimicrobial Stewardship Task Force in May 2011.Reference Kelly, Jones and Echevarria 20 In 2011, each acute-care facility reported at least 1 stewardship activity, and >70% generated antibiograms. By 2015, 89% had a defined stewardship team and 92% had a written stewardship policy. The efforts by the VA resulted in a 12% decrease in antimicrobial use.Reference Kelly, Jones and Echevarria 20 CDI can occur after even a single dose of an antibiotic. A study by Brown et alReference Brown, Fisman, Moineddin and Daneman 14 details the incidence rate of CDI after antibiotic exposure to be 1.6 after 1–3 days of antibiotic use and 2.3 after 4–6 days of use. The rate decreased to 2.1 with 7–11 days of antibiotic use. We chose to use a case of antibiotic use given that duration of antibiotic use does not always correlate with risk of CDI.
In July 2012, the VA implemented reporting of HO-HCFA CDI. When the decrease in antimicrobial use is factored into the model, mandatory reporting was no longer statistically significant. Previous published reports describe the effectiveness of C. difficile infection prevention initiatives within the VA hospital.Reference Evans, Kralovic, Simbartl, Jain and Roselle 7 , Reference Singh, Evans, Simbartl, Kralovic and Roselle 21 Although we found that reporting alone did not decrease CDI rates, ASP and infection control are likely important to formulating a comprehensive plan for controlling CDI.
Clostridium difficile infection continues to be associated with mortality. One study of patients with CDI found a 50% increased risk of death when adjusted for age, sex, Charlson comorbidity index, diagnosis of a malignancy, and presence of a nasogastric tube.Reference Reacher, Verlander and Roddick 22 In a review of 27 studies, Karas et alReference Karas, Enoch and Aliyu 23 found that the risk of death in patients with CDI over age 80 was 13.5% at 3 months. The 30-day mortality associated with C. difficile positivity decreased in patients with CDI by 0.76 cases per 10,000 patient days during the 11-year study period. In our study, the number of PCR-based tests performed corresponded with a decrease in mortality. Another study found that increased awareness led to decreased time to testing.Reference Frenz and McIntyre 24 In a prospective study, time to testing associated with alternative methods of testing, such as PCR testing, was associated with a reduction of hospitalization days.Reference Barbut, Surgers and Eckert 25 PCR testing and potentially faster diagnostics may improve mortality rates. However, an alternative explanation is that PCR may increase the detection of CDI in patents with asymptomatic colonization, which may have been a healthier population than those detected using tests more specific for active CDI, rather than true disease.
The decrease in HO-HCFA incidence may be secondary to a shift to community-acquired CDI given early testing rather than a true decrease in overall CDI; however overall incidence of CDI in the acute-care setting is also declining. This shift to community-onset CDI within VA has been reported by prior studies.Reference Reveles, Pugh and Lawson 26 A concurrent analysis of community-onset healthcare facility-associated as well as community-acquired CDI is needed to confirm this hypothesis.
Moreover, ICD-9/10 codes are not representative of all cases of CDI; however, our study shows that the trend of correctly coding for CDI has improved over the past decade. Similar to our study, prior studies have found the sensitivity and specificity of ICD-9/10 codes to be 71.0%–78.0% within the United States.Reference Dubberke, Reske, McDonald and Fraser 27 – Reference Dubberke, Butler and Yokoe 29
Recently, the VA has altered its definition of HO-HCFA CDI to match that of the National Healthcare Safety Network (NHSN). Based on the current decreased incidence of CDI from 2012 onward, the total CDI as well as HO-HCFA CDI rates within VA acute-care hospitals will likely continue to improve. Although most states rates are decreasing, select states have experienced increased incidence of CDI.
This study has several limitations. This study was retrospective in design. Our analysis was limited to records within the VA hospitals. Community-acquired and community-onset healthcare facility-associated CDI data were excluded. VA hospitals without an inpatient facility associated with them during the study period were excluded, as were VA hospitals outside the continental United States (Hawaii, Phillipines, and Puerto Rico). To control for this, admission data from these hospitals were also excluded. Additionally, the heat map cannot account for transfers of patients between states. This study did not consider total duration of antibiotics. Additionally, antibiotic usage only encompassed the patients who had CDI testing and did not include the total amount of antimicrobial use for all VA admissions. Finally, any admission or discharge diagnosis of CDI without a concurrent stool testing was not included in our study. Indeterminant results and clinical diagnosis of CDI without stool testing were also excluded. The VA population is older and weighted heavily toward males.Reference Reveles, Lawson and Mortensen 18 , Reference Buchner and Sonnenberg 30 , Reference Young-Xu, Kuntz and Gerding 31 As such, these trends may not be generalizable in a larger, more diverse population, which may limit external validity.
In conclusion, CDI continues to be a challenging HAI, especially in the elderly VA population. The use of molecular methods of detection was associated with increased incidence of total and HO-HCFA CDI. Controlling CDI is likely multifactorial. Although the VA initiative to report cases of hospital-acquired CDI was not significant in our model, the advent of stewardship programs throughout the VA and the reduction in use of third-generation cephalosporins, fluoroquinolones, and clindamycin were associated with reduced rates of CDI. The median time to testing trended downward from 2006 to 2016, as did the incidence of HO-HCFA CDI. The use of PCR diagnostics was associated with a decline in 30-day mortality.
Acknowledgments
The contents of this manuscript are not intended to represent the views of the Department of Veterans Affairs or the United States government.
Financial support
This study and the results presented here are the result of work supported with resources and the use of facilities at the VA Western New York Healthcare System.
Conflicts of interest
The authors have no conflicts of interest related to this manuscript