1. Introduction
Since fishbone was observed in the Poloidal Divertor Experiments (PDX) (McGuire et al. Reference McGuire, Goldston, Bell, Bitter, Bol, Brau, Buchenauer, Crowley, Davis and Dylla1983), it has been widely studied on account of large energetic particle (EP) losses in the presence of such mode (White et al. Reference White, Goldston, McGuire, Boozer, Monticello and Park1983). The fishbone excitation has been explained by the internal kink mode destabilised by trapped EPs as the mode frequency is close to the trapped particle precession frequency (Chen, White & Rosenbluth Reference Chen, White and Rosenbluth1984). A well-known zero-dimensional model, named the predator–prey model (White et al. Reference White, Goldston, McGuire, Boozer, Monticello and Park1983; Chen et al. Reference Chen, White and Rosenbluth1984), was proposed to describe the nonlinear instability cycle observed in the experiments (McGuire et al. Reference McGuire, Goldston, Bell, Bitter, Bol, Brau, Buchenauer, Crowley, Davis and Dylla1983). This model could be derived from the first principle via the nonlinear gyrokinetic equation (Zonca et al. Reference Zonca, Buratti, Cardinali, Chen, Dong, Long, Milovanov, Romanelli, Smeulders and Wang2007), and was recently applied to the estimation of the fishbone cycle frequency quantitatively in tokamak experiments (Xu et al. Reference Xu, Zhang, Chen, Hu, Li, Lin, Shi, Duan and Zhu2015; Zhu et al. Reference Zhu, Zeng, Qiu, Hao, Shen, Gu, Wu, Tang, Qian and Liu2020).
The internal transport barrier (ITB) has been explored in tokamak plasmas in order to improve the core confinement, and to achieve the advanced scenario with high bootstrap current fraction for steady-state operations (Wolf Reference Wolf2003; Connor et al. Reference Connor, Fukuda, Garbet, Gormezano, Mukhovatov and Wakatani2004). The physical mechanisms for the formation and dynamics of the ITB in tokamak and helical plasmas were reviewed in (Ida & Fujita Reference Ida and Fujita2018). It is strongly suggested that the key to ITB formation includes radial electric field shear, magnetic shear and rational surface (Ida & Fujita Reference Ida and Fujita2018). A theoretical model based on the transport bifurcation has been proposed to predict a power threshold for the transition from low- to high-confinement state locally inside the ITB foot (Diamond et al. Reference Diamond, Lebedev, Newman, Carreras, Hahm, Tang, Rewoldt and Avinash1997), and uncover its spatiotemporal dynamics (Newman et al. Reference Newman, Carreras, Lopez-Bruna, Diamond and Lebedev1998).
Fishbone was first observed to be correlated to ITB formation in ASDEX-Upgrade and the instability was proposed to be responsible for clamping the safety factor $q$ value to the vicinity of unity and avoiding sawteeth (Wolf et al. Reference Wolf, Gruber, Maraschek, Dux, Fuchs, Gunter, Herrmann, Kallenbach, Lackner and McCarthy1999; Gruber et al. Reference Gruber, Wolf, Bosch, Dux, Gunther, McCarthy, Lackner, Maraschek, Meister and Pereverzev2000). During the whistling down period of the fishbone oscillation the transport is reduced around the corresponding rational surface, leading to an increased pressure gradient (Gunter et al. Reference Gunter, Gude, Hobirk, Maraschek, Saarelma, Schade and Wolf2001). This behaviour could be explained by the redistribution of the resonant EPs resulting in a sheared plasma rotation, which is equivalent to a radial electric field (Pinches et al. Reference Pinches, Günter and Peeters2001). Meanwhile, in JET experiments with negative central magnetic shear, the analysis of ITB triggering reveals a correlation between the formation of the ITB and $q_{{\rm min}}$
 reaching an integer value (Joffrin et al. Reference Joffrin, Gorini, Challis, Hawkes, Hender, Howell, Maget, Mantica, Mazon and Sharapov2002); however, no direct causal relationship to fishbone was reported. In MAST ITB, its onset tends to coincide with the occurrence of the bursts of toroidal Alfvén eigenmodes (TAEs), which are eventually replaced by fishbone instabilities as the $q$
 profile decreases, at this time the plasma rotation exhibits a positive gradient just outside $q_{{\rm min}}$
 surface (Field et al. Reference Field, Michael, Akers, Candy, Colyer, Guttenfelder, Ghim, Roach and Saarelma2011; Clive, Crocker & Hillesheim Reference Clive, Crocker and Hillesheim2019). In HL-2A tokamak, the flow shear in the stationary ion ITB state reaches the level required for suppressing the ion temperature gradient mode instability, which indicates the important role of flow shear in sustaining the ion ITB (Yu et al. Reference Yu, Wei, Liu, Dong, Ida, Itoh, Sun, Cao, Shi and Wang2016). Experimental evidence and simulation analysis suggest that the fishbone activities can induce a poloidal flow, which is beneficial for the suppression of turbulence in the plasma core region (Deng et al. Reference Deng, Liu, Ge, Jiang, Shi, Li, Ji, Dong, Wang and Cao2022). In addition, it has been revealed that fishbone instability is often excited after the ITB formation, and it plays no role in triggering ITB; however, ITBs with fishbone are stronger than without fishbone (He et al. Reference He, Yan, Yu, Chen, Yu, Ma, Liu, Wei, He and Zhang2022). In EAST tokamak, ITB formation is stepwise and always appears after the fishbone instability (Yang et al. Reference Yang, Gao, Liu, Li, Zhang, Zeng, Liu, Wu, Kong and Ming2017; Liu et al. Reference Liu, Ge, Wang, Liu, Yang, Wu, Wang, Zhang, Li and Xie2020). It is identified that ITB formation in the ion thermal channel strongly correlates to the excitation of the fishbone (Chu et al. Reference Chu, Liu, Zhang, Jie, Lian, Wu, Zhu, Wu, Xu and Wang2021; Zhang et al. Reference Zhang, Gong, Qian, Zeng, Xu, Duan, Zhang, Hu, Jia and Li2022). With neutral beam injection (NBI) power increasing step by step, the magnitude of each burst of fishbone becomes larger and the burst frequency becomes higher and, accordingly, the ITB becomes stronger (Zhu et al. Reference Zhu, Zeng, Qiu, Hao, Shen, Gu, Wu, Tang, Qian and Liu2020; Chu et al. Reference Chu, Liu, Zhang, Xu, Li, Jie, Lian, Zhou, Feng and Zhang2022). Experimental analysis demonstrates that the increasing $E\times B$
 shear flow is important for the formation of ITB (Zhang et al. Reference Zhang, Wu, Li, Li, Tang, Yang, Zhong, Long, Wu and Zhang2023). By using the hybrid kinetic–magnetohydrodynamic (MHD) code M3D-K, single-n simulations showed that when the central gradient of the total pressure profile is above a threshold, the fishbone instability can transport the thermal pressure radially inward and promote the ITB formation (Ren et al. Reference Ren, Shen, Li, Wu, Yang and Wang2022). In multiple-n simulations, it is found that a zonal electric field can be induced in the nonlinear fishbone stage, leading to a relatively large $E\times B$
 zonal flow that is sufficient for suppressing the dominant micro-instability before ITB formation (Ge et al. Reference Ge, Wang, Wang, Liu and Xu2023). A similar process was recently reported in DIII-D plasmas by gyrokinetic and kinetic–MHD simulations; however, it was found that self-generated zonal flows, but not wave–particle interaction, can dominate the fishbone saturation (Brochard et al. Reference Brochard, Liu, Wei, Heidbrink, Lin, Gorelenkov, Chrystal, Du, Bao and Polevoi2023).
In this paper, a simple model incorporating the fishbone dynamics and ion pressure gradient evolution is proposed in order to investigate the key physics parameters assisting the triggering of ITB. The time evolution of fishbone is described by the well-known predator–prey model (White et al. Reference White, Goldston, McGuire, Boozer, Monticello and Park1983; Chen et al. Reference Chen, White and Rosenbluth1984; Zhu et al. Reference Zhu, Zeng, Qiu, Hao, Shen, Gu, Wu, Tang, Qian and Liu2020). For each burst cycle, the EPs resonantly interact with fishbone and are expelled radially leading to a radial current, and hence a compensating bulk plasma return current. For fishbones that repeat on a timescale faster than the poloidal damping timescale, a sufficient sheared flow driven by plasma current can be induced (Gunter et al. Reference Gunter, Gude, Hobirk, Maraschek, Saarelma, Schade and Wolf2001; Pinches et al. Reference Pinches, Günter and Peeters2001). It should be emphasised that zonal flow generation by fluid nonlinearity is different from the flow driven by plasma current: the former comes from the mode–mode coupling, i.e. Reynolds stress or Maxwell stress, whereas the latter is driven by the $\boldsymbol{J}\times \boldsymbol{B}$ torque due to plasma current in the momentum equation. The radial current induced by EP losses during the injection of NBI or alpha particle production has been discussed (Rosenbluth & Hinton Reference Rosenbluth and Hinton1996; McClements & Thyagaraja Reference McClements and Thyagaraja2006; Thyagaraja, Schwander & McClements Reference Thyagaraja, Schwander and McClements2007), which will drive a significant amount of plasma rotation. The temporal evolution of fluctuation level and ion pressure gradient can be described by a simple zero-dimensional model (Diamond et al. Reference Diamond, Lebedev, Newman, Carreras, Hahm, Tang, Rewoldt and Avinash1997). When the shear of the flow exceeds a critical value, the turbulent fluctuations are suppressed, and the ion pressure gradient accesses the high-confinement state (Burrell Reference Burrell1997).
The remainder of the paper is organised as follows. The theoretical model is presented in § 2 including a description of fishbone amplitude evolution equation, poloidal rotation driven by radial current and ion transport equation. The corresponding analytical steady-state solutions are derived and verified numerically. Numerical solutions are presented in § 3. Section 4 gives discussions on the simplified model used and the implications of our results for the suppression of turbulence by fishbone. Section 5 gives a summary and conclusions. In Appendix A, the equation for poloidal rotation driven by radial current including neoclassical effects is derived.
2. Theoretical model
2.1. Fishbone amplitude evolution equation
The evolution of EP beta and fishbone amplitude can be described by the well-known predator–prey model (White et al. Reference White, Goldston, McGuire, Boozer, Monticello and Park1983; Chen et al. Reference Chen, White and Rosenbluth1984; Zhu et al. Reference Zhu, Zeng, Qiu, Hao, Shen, Gu, Wu, Tang, Qian and Liu2020),


where $\beta _{\rm {ep}}$ is the average trapped EP beta within the $q=1$
 surface, $A$
 is fishbone amplitude ($\equiv \delta B_{r}/B_{0}$
 , the normalised radial perturbed magnetic field), $D$
 is the deposition rate of trapped EP within the $q=1$
 surface, $Z$
 is a measure of the EP loss rate, $\beta _{\rm {max}} = \beta _{\rm {crit}}/(1-f_t/2)$
 , $\beta _{\rm {min}} = (1-f_t)\beta _{\rm {max}}=2\beta _{\mathrm {crit}}-\beta _{\mathrm {max}}$
 , $f_t$
 is the fraction of trapped EPs that can be ejected, $\beta _{\rm {crit}}$
 is the excitation threshold of fishbone, $\varGamma$
 is the resonant drive of trapped EPs and $H$
 is Heaviside function. The evolution of $\beta _{\rm {ep}}$
 is periodic with minimum $\beta _{\rm {min}}$
 and maximum $\beta _{\rm {max}}$
 . The Hamiltonian of the system (Heidbrink et al. Reference Heidbrink, Duong, Manson, Wilfrid, Oberman and Strait1993), which is conserved and equals the energy $C$
 , is given by

where $x\equiv \ln A$ and $p_x\equiv \beta _{\mathrm {ep}} - \beta _{\mathrm {crit}}$
 is the generalised coordinate and momentum, respectively. Equations (2.1) and (2.2) can be derived from (2.3) directly as $\dot {p}_x=-\partial \mathcal {H}/\partial x=D-e^xZ\beta _{\mathrm {max}}, \dot {x}=\partial \mathcal {H}/\partial p_x=\varGamma p_x$
 , where for the steady solution $\beta _{\rm {min}}\leq \beta _{\rm {ep}}\leq \beta _{\rm {max}}$
 and $H(\beta _{\rm {ep}}-\beta _{\rm {min}})=1$
 . From (2.1), one can see that $\beta _{\rm {ep}} = \beta _{\rm {min}}$
 at $A=D/Z\beta _{\rm {max}}$
 , substituting into (2.3) leads to

On the other hand, from (2.2), $A$ is periodic with minimum $A_{\rm {min}}$
 and maximum $A_{\rm {max}}$
 at $\beta _{\rm {ep}} = \beta _{\rm {crit}}$
 ,

The extrema of $A$ , $A_{\rm {min}}$
 and $A_{\rm {max}}$
 can be determined by (2.4) and (2.5). For this reason, there are only five free parameters in the predator–prey model, $D,Z,\beta _{\rm {crit}},\beta _{\rm {max}},\varGamma$
 .
For Hamilton's equations, the period of fishbone $t_p$ is related to the action $J= \oint p_x\, {{\rm d} x}$
 and energy $C$
 (Heidbrink et al. Reference Heidbrink, Duong, Manson, Wilfrid, Oberman and Strait1993) by

The single burst solution can be obtained by expanding around $\beta _{\mathrm {ep}} =\beta _{\mathrm {crit}}$ and $A=A_{\mathrm {max}}$
 , $\beta _{\mathrm {ep}}\approx \beta _{\mathrm {crit}}+c(t-t_0), \ln A\approx \ln A_{\mathrm {max}}+d(t-t_0)^2/2$
 , substituting into (2.1) and (2.2), we obtain $c=D-A_{\mathrm {max}}Z\beta _{\mathrm {max}}, d=\varGamma c$
 and

where $t_0$ is the time at $A=A_{\rm {max}}$
 . As a result, the solution of successive bursts is constituted as

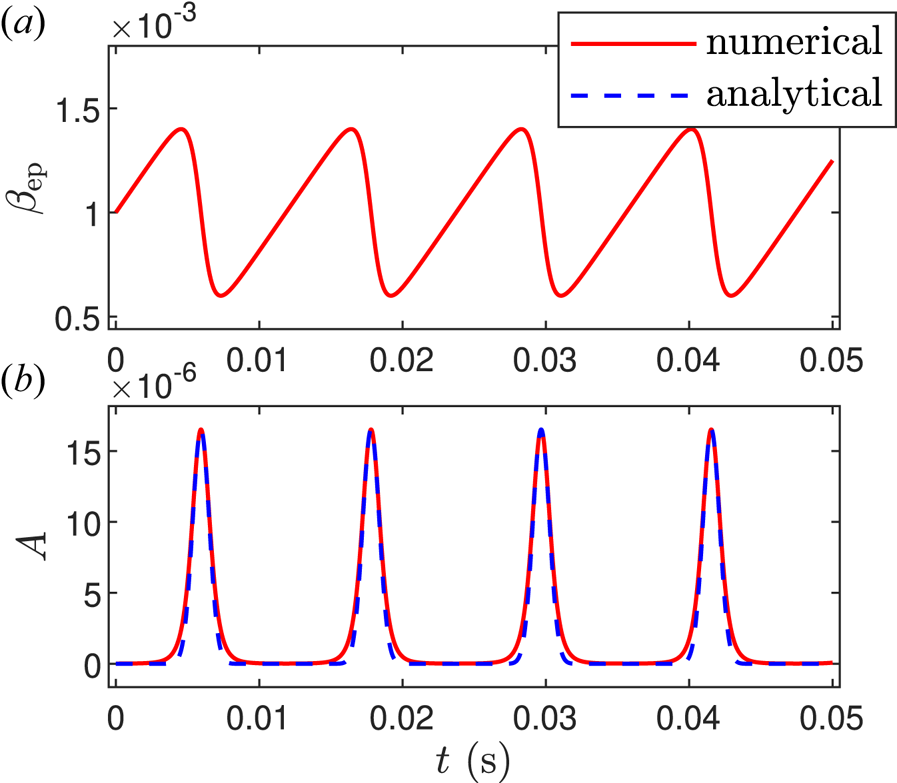
This analytical solution has been verified numerically as shown in figure 1, where the red line is the numerical solution of (2.1) and (2.2) and the blue dashed line is the analytical solution of (2.8). The five free parameters are selected as $\beta _{\rm {crit}}=0.001$ , $\beta _{\rm {max}}=0.0014$
 , $\varGamma =5.0\times 10^6\,\mathrm {s}^{-1}$
 , $D=0.1\,\mathrm {s}^{-1}$
 and $Z=3.0\times 10^7\,\mathrm {s}^{-1}$
 , which come from the fitting of EAST experimental data (Xu et al. Reference Xu, Zhang, Chen, Hu, Li, Lin, Shi, Duan and Zhu2015; Zhu et al. Reference Zhu, Zeng, Qiu, Hao, Shen, Gu, Wu, Tang, Qian and Liu2020). The initial conditions are $\beta _{\rm {ep}}=\beta _{\rm {crit}}$
 and $A=A_{\rm {min}}$
 . The maximum $A_{\rm {max}}$
 in the numerical solution is exactly the same as the value calculated from (2.4) and (2.5). Meanwhile, the burst period $t_p$
 and the burst width $\Delta t$
 both coincide with the numerical solution.


2.2. Poloidal rotation driven by EP radial current
It can be shown that (2.1) is essentially the EP transport equation. The flux surface averaged EP charge conservation law is

where $\rho _{\rm {ep}}\equiv q_{\rm {ep}}n_{\rm {ep}}$ , $q_{\rm {ep}}$
 and $n_{\rm {ep}}$
 are the EP charge and density, respectively, $J_r$
 is the radial current, $r$
 is radial coordinate (the simple toroidal coordinate system is adopted and $r$
 represents the flux surface) and $S_{\rm {ep}}$
 is the source of EPs. Assuming the radial current comes from interaction of EPs and fishbone, its radial structure can be represented by a Gaussian shape as computed by HAGIS simulations (Pinches et al. Reference Pinches, Günter and Peeters2001),

where $r_0$ is the position of the Gaussian peak which mostly depends on the location in phase space of the dominant precessional resonant response (Fu et al. Reference Fu, Park, Strauss, Breslau, Chen, Jardin and Sugiyama2006). In practice, $r_0\sim r_s$
 is the position of $q=1$
 surface and $\Delta r\sim r_s$
 is the radial width of fishbone. The Gaussian shape used here is just to simplify the model calculation: one can substitute a realistic profile of $J_r$
 into simulations or experiments to obtain more precise results. Multiplying by $4\mu _0T_{\rm {ep}}r/B^2_0q_{\rm {ep}}r^2_s$
 and integrating from $0$
 to $r_s$
 in (2.9), we get

where $\beta _{\rm {ep}}\equiv 2\mu _0\bar {n}_{\rm {ep}}T_{\rm {ep}}/B^2_0$ is the averaged EP beta, $\bar {n}_{\rm {ep}}\equiv \int _0^{r_s}2rn_{\rm {ep}}\,{\rm d}r/r^2_s$
 is the averaged EP density, $T_{\rm {ep}}$
 is the EP temperature and is assumed to be a constant, $\mu _0$
 is the permeability of vacuum and $D\equiv (4\mu _0T_{\rm {ep}}/B^2_0 q_{\rm {ep}}r^2_s)\int _0^{r_s}S_{\rm {ep}}r\,{\rm d}r$
 . Comparing with (2.1), one can identify that the radial current is proportional to the fishbone amplitude,

There is also a theoretical derivation from the nonlinear gyrokinetic equation (Zonca et al. Reference Zonca, Buratti, Cardinali, Chen, Dong, Long, Milovanov, Romanelli, Smeulders and Wang2007), confirming the linear relation between fishbone amplitude and EP transport flux.
The equation for poloidal rotation driven by radial current (Peeters Reference Peeters1998) is derived in Appendix A as

where $a=(\epsilon ^2/q^2)(1+2q^2+1.63q^2/\sqrt {\epsilon })$ , $1.63q^2/\sqrt {\epsilon }$
 comes from the neoclassical effect (Shaing, Ida & Sabbagh Reference Shaing, Ida and Sabbagh2015), the poloidal flow damping rate $\nu =1.1\nu _{ii}\sqrt {\epsilon }$
 is proportional to the ion–ion collisional frequency $\nu _{ii}$
 , $f=(\epsilon ^2/q^2)(B_0/n_im_i)$
 , $n_i$
 and $m_i$
 are the ion density and mass, respectively, $\epsilon \equiv r/R_0$
 and $R_0$
 is major radius of the tokamak. As the radial current $J(t)\propto A(t)$
 , which is composed of successive bursts, a steady poloidal flow can be built up on condition that the burst frequency is greater than the poloidal flow damping rate. The steady flow for a given radial position can be estimated as follows: here we choose the position of $r=r_s$
 for illustration, for other positions near $r=r_s$
 , the conclusion is qualitatively the same. For $r=r_s$
 , vanishing of the left-hand side of (2.13) gives the steady solution

where $\left \langle \cdots \right \rangle _t$ denotes the long-time average, and is equivalent to the time average over one period, $\left \langle A(t)\right \rangle _t=\int _0^{t_p}\,{\rm d}tA_s(t)/t_p$
 . For $\Delta t\leq t_p$
 , the integral $\int _0^{t_p}\,{\rm d}tA_s(t)$
 is close to Gaussian integral and $\approx \sqrt {{\rm \pi} }\Delta t A_{\rm {max}}$
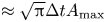 . As a result, the steady flow can be approximated as

It can be shown that the steady flow is proportional to $\Delta t/t_p$ , which means the larger burst frequency or the longer burst duration would lead to larger steady flow shear and assist in the building of ITB. In order to calculate the radial shear of the poloidal rotation, (2.13) and its radial derivative are written respectively as


where the prime represents derivative in the radial direction. The flow shear $V^{\prime }_{\theta }$ can be obtained by solving (2.16) and (2.17) simultaneously. Here we only consider the radial variation of $\epsilon$
 in the coefficients $a$
 , $\nu$
 and $f$
 ; the equilibrium related parameters such as $q$
 , $\nu _{ii}$
 and $n_i$
 are assumed to be constant. Since the leading-order term for $\epsilon \ll 1$
 in $a$
 is $1.63q^2/\sqrt {\epsilon }$
 , we have $a^{\prime }/a \approx 3/2r$
 , $\nu ^{\prime }/\nu =1/2r$
 and $f^{\prime }/f=2/r$
 . The steady flow shear can be estimated by the same method given previously, for $r=r_s$
 , vanishing of the left-hand side of (2.17) gives

Selecting a set of typical tokamak parameters such as $R_0=2\,{\rm m}$ , $r_s/R_0=0.1$
 , $\nu =5\,{\rm s}^{-1}$
 and $fJ_f=2.0\times 10^9\,{\rm m}\,{\rm s}^{-2}$
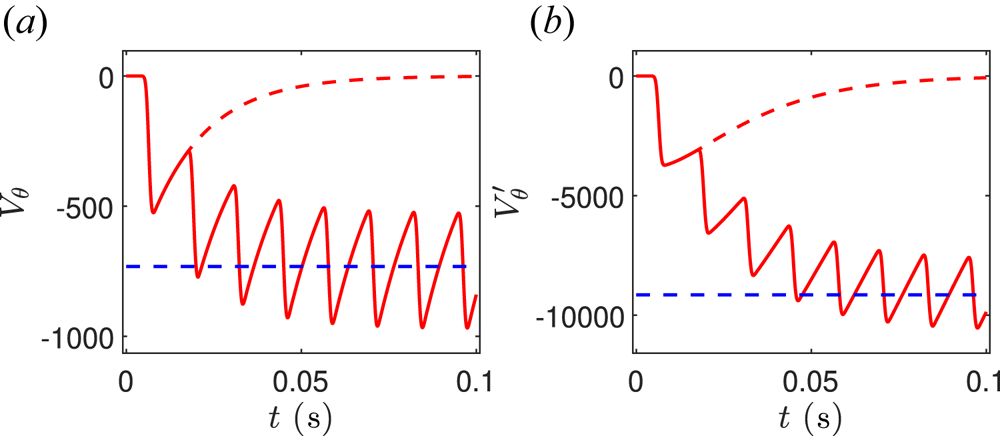
 , the numerical solution of (2.16) and (2.17) is displayed in the red line in figure 2(a,b) and the dashed blue line is the analytical steady solution of (2.15) and (2.18), respectively. The poloidal rotation driven by a single burst of (2.7a) is also displayed as a dashed red line, and is eventually damped without a steady flow. Note that similar results have been obtained in figure 4 of Pinches et al. (Reference Pinches, Günter and Peeters2001).
(a) Numerical solution (solid red line) of (2.16), where the dashed blue line is the analytical solution of (2.15). (b) Numerical solution (solid red line) of (2.17), where the dashed blue line is the analytical solution of (2.18) and the dashed red line is the poloidal rotation driven by a single burst of (2.7a).

Substituting (2.12) into (2.18) gives an analytical expression to estimate the absolute value of the steady flow shear induced by fishbone bursts,

where $v_A\equiv B_0/\sqrt {\mu _0n_im_i}$ is the Alfvén velocity, $v_{\rm {ep}}\equiv \sqrt {T_{\rm {ep}}/m_{\rm {ep}}}$
 is the EP thermal velocity, $\varOmega _{\rm {ep}}\equiv q_{\rm {ep}}B_0/m_{\rm {ep}}$
 is the EP gyrofrequency. This quantitative formula can be further simplified when $D$
 is small enough, $D\ll A_{\rm {max}}Z\beta _{\rm {max}}$
 . By using the relations given by (2.5)–(2.7a,b), the burst width can be approximated as $\Delta t\approx \sqrt {2/(\varGamma A_{\rm {max}}Z\beta _{\rm {max}})}$
 , because most of the time $A\ll A_{\rm {max}}$
 , the $AZ\beta _{\rm {max}}$
 term in the integrand of (2.6) can be neglected; hence, the integral is solved analytically, $t_p\approx 2\sqrt {2A_{\rm {max}}Z\beta _{\rm {max}}/\varGamma }/D$
 . As a result, we obtain $\Delta t/t_p\approx D/(2A_{\rm {max}}Z\beta _{\rm {max}})$
 and

which means that the steady flow shear grows linearly with $D$ increasing, and it is independent of other parameters of $Z,\beta _{\rm {crit}},\beta _{\rm {max}},\varGamma$
 . This analytical expression is broken as $D\rightarrow A_{\rm {max}}Z\beta _{\rm {max}}$
 , since $\Delta t\rightarrow \infty$
 as shown in (2.7b). In fact, when $\Delta t>t_p$
 , the solution of $A$
 behaves like oscillation rather than burst; thus, the form of exponential in (2.7a) is incorrect. However, the numerical solution in § 3 still shows the same trend that the steady flow shear only depends on $D$
 linearly.
2.3. Ion transport model
The temporal evolution of ion temperature gradient mode (ITG) fluctuation level and ion pressure gradient can be described by a simple zero-dimensional model (Diamond et al. Reference Diamond, Lebedev, Newman, Carreras, Hahm, Tang, Rewoldt and Avinash1997; Newman et al. Reference Newman, Carreras, Lopez-Bruna, Diamond and Lebedev1998),


where $E\equiv \left \langle (\tilde {n}/n)^2 \right \rangle ^{1/2}$ is the normalised turbulent fluctuation level and $N\equiv (a_0/P_i)(-{\rm d}P_i/{\rm d}r)$
 is the ion pressure gradient normalised with the minor radius $a_0$
 . The parameter $\alpha _1$
 is determined by the saturation level of the instability in the low-confinement regime and can be estimated by the empirical mix-length model (Diamond et al. Reference Diamond, Lebedev, Newman and Carreras1995), $\gamma _0/\alpha _1\sim \Delta _r/a_0$
 . The other parameter $\alpha _2$
 is determined from the $E\times B$
 shear flow suppression criterion (Biglari, Diamond & Terry Reference Biglari, Diamond and Terry1990; Zhang & Mahajan Reference Zhang and Mahajan1992), $\alpha _2=(\Delta _r/\Delta _{\theta })^2/\gamma _0$
 . Here, $\Delta _r$
 and $\Delta _{\theta }$
 are the turbulent radial and poloidal correlation length, respectively, and assumed to be the same order, $\Delta _r\approx \Delta _{\theta }$
 . Here $S$
 is the source of thermal ions, and $D_n$
 and $D_a$
 are the neoclassical and turbulent transport coefficients, respectively. The $E \times B$
 flow $V_E$
 is determined by the radial ion force balance equation,

In this paper, we focus on the poloidal rotation induced by fishbone. Neglecting the toroidal rotation $V_{\varphi }$ and ion pressure gradient term in (2.23) leads to $V^{\prime }_E\approx V^{\prime }_{\theta }$
 . As a result, the predator–prey model and the ion transport model are coupled through the sheared poloidal flow term in (2.21).
There are two steady solutions for (2.21) and (2.22): (a) low-confinement solution $(E,N)=(E_L,N_L)$ , when the flow shear $V^{\prime }_{\theta }\approx 0$
 , the saturation level of the turbulent fluctuation is $E_L=\gamma _0 N_L/\alpha _1$
 , and the steady transport satisfies $S=(D_n+D_aE_L)N_L$
 ; and (b) high-confinement solution $(E,N)=(E_H,N_H)$
 , when the flow shear is larger than a critical value, the turbulent fluctuation is suppressed, $E_H\approx 0$
 , the transport is neoclassical, $N_H=S/D_n$
 . The critical value of flow shear is

3. Numerical results
The simple model incorporating the fishbone dynamics and ion pressure gradient evolution is proposed as (2.1) and (2.2), (2.16) and (2.17), (2.21) and (2.22), and is numerically solved by the Runge–Kutta method provided by the MATLAB ODE45 library. The fishbone- and rotation-related parameters are the same as in §§ 2.1 and 2.2, respectively. The ion-transport-related parameters are selected as $\gamma _0=10^4\,{\rm s}^{-1}$ , $\alpha _1=10^5\,{\rm s}^{-1}$
 , $\alpha _2=10^{-4}\,{\rm s}^2$
 , $S=10^4\,{\rm s}^{-1}$
 , $D_n=5.0\times 10^3\,{\rm s}^{-1}$
 and $D_a=2.0\times 10^5\,{\rm s}^{-1}$
 . The initial turbulent fluctuation level and ion pressure gradient are set as low-confinement solution, $E_L=0.06$
 and $N_L=0.6$
 . The corresponding high-confinement solution is $N_H=2$
 . In this paper, we focus on the effect of fishbone dynamics on the ITB formation. In other words, five free parameters in the predator–prey model are scanned to investigate which is the key parameter that determines whether the ion pressure gradient can achieve a high-confinement solution, while other parameters are kept fixed.
The temporal evolutions of $\beta _{\rm {ep}}$ , $A$
 , $V^{\prime }_{\theta }$
 , $E$
 and $N$
 for $D=0.10$
 , $D=0.12$
 and $D=0.14$
 are displayed in figure 3(a). With $D$
 increasing, the burst frequency $\sim\!\!1/t_p$
 , burst width $\Delta t$
 and the maximum of fishbone amplitude $A_{\rm {max}}$
 all increase. As a result, the steady flow shear $V^{\prime }_{\theta }$
 grows gradually, the turbulent fluctuation $E$
 is suppressed and the ion pressure gradient $N$
 achieves a high-confinement solution when $D$
 exceeds a threshold. The average values of $|V^{\prime }_{\theta }|$
 , $E$
 and $N$
 over $t=0.1\unicode{x2013}0.2\,{\rm s}$
 are displayed in figure 3(b). One can see that the transition is stepwise: as $D$
 increases from 0.04 to 0.12, the steady flow shear rises gradually to the critical value shown by the dashed grey line, which is given by (2.24). The turbulent fluctuation level reduces to $E_H=0$
 and the ion pressure gradient attains $N_H=2$
 at $D=0.12$
 and remain at these levels even as $D$
 grows further. It should be emphasised that there is a linear relationship between $\left \langle |V^{\prime }_{\theta }|\right \rangle _t$
 and $D$
 , and the slope is about $1.2\times 10^5$
 , which is a little larger than the analytical solution of the green line given by (2.19).
(a) Temporal evolutions of $\beta _{\rm {ep}}$ , $A$
 , $V^{\prime }_{\theta }$
 , $E$
 and $N$
 for $D=0.10\,\mathrm {s}^{-1}$
 , $D=0.12\,\mathrm {s}^{-1}$
 and $D=0.14\,\mathrm {s}^{-1}$
 . (b) Average values of $|V^{\prime }_{\theta }|$
 , $E$
 and $N$
 over $t=0.1\unicode{x2013}0.2\,{\rm s}$
 with $D$
 increasing. Other parameters are set as $\beta _{\rm {crit}}=0.001$
 , $\beta _{\rm {max}}=0.0014$
 , $\varGamma =5.0\times 10^6\,\mathrm {s}^{-1}$
 and $Z=3.0\times 10^7\,\mathrm {s}^{-1}$
 .

The temporal evolutions of $\beta _{\rm {ep}}$ , $A$
 , $V^{\prime }_{\theta }$
 , $E$
 and $N$
 for $Z=10^7$
 , $Z=3\times 10^7$
 and $Z=5\times 10^7$
 are displayed in figure 4(a). With $Z$
 increasing, the burst frequency $\sim\!\!1/t_p$
 and width $\Delta t$
 of $A$
 both remain the same; however, only the maximums of $A$
 decrease. It can be deduced that $AZ$
 is constant from (2.3) and (2.4), hence $V^{\prime }_{\theta }$
 , $E$
 and $N$
 are unchanged for different $Z$
 which is shown in figure 4(a). The average values of $|V^{\prime }_{\theta }|$
 , $E$
 and $N$
 over $t=0.1\unicode{x2013}0.2\,{\rm s}$
 are displayed in figure 4(b) and are independent of $Z$
 .
(a) Temporal evolutions of $\beta _{\rm {ep}}$ , $A$
 , $V^{\prime }_{\theta }$
 , $E$
 and $N$
 for $Z=10^7\,\mathrm {s}^{-1}$
 , $Z=3\times 10^7\,\mathrm {s}^{-1}$
 and $Z=5\times 10^7\,\mathrm {s}^{-1}$
 . (b) Average values of $|V^{\prime }_{\theta }|$
 , $E$
 and $N$
 over $t=0.1\unicode{x2013}0.2\,{\rm s}$
 with $Z$
 increasing. Other parameters are set as $\beta _{\rm {crit}}=0.001$
 , $\beta _{\rm {max}}=0.0014$
 , $\varGamma =5.0\times 10^6\,\mathrm {s}^{-1}$
 and $D=1.0\,\mathrm {s}^{-1}$
 .

The temporal evolutions of $\beta _{\rm {ep}}$ , $A$
 , $V^{\prime }_{\theta }$
 , $E$
 and $N$
 for $\varGamma =10^6$
 , $\varGamma =5\times 10^6$
 and $\varGamma =9\times 10^6$
 are displayed in figure 5(a). With $\varGamma$
 increasing, the burst frequency $\sim\!\!1/t_p$
 of $A$
 increases, and its burst width $\Delta t$
 decreases. As a result, the steady flow shear $\propto (\Delta t/t_p)Z\beta _{\rm {max}}A_{\rm {max}}$
 remains almost the same, which can be seen in figure 5(b). The average values of $E$
 and $N$
 over $t=0.1\unicode{x2013}0.2\,{\rm s}$
 show little change.
(a) Temporal evolutions of $\beta _{\rm {ep}}$ , $A$
 , $V^{\prime }_{\theta }$
 , $E$
 and $N$
 for $\varGamma =10^6\,\mathrm {s}^{-1}$
 , $\varGamma =5\times 10^6\,\mathrm {s}^{-1}$
 and $\varGamma =9\times 10^6\,\mathrm {s}^{-1}$
 . (b) Average values of $|V^{\prime }_{\theta }|$
 , $E$
 and $N$
 over $t=0.1\unicode{x2013}0.2\,{\rm s}$
 with $\varGamma$
 increasing. Other parameters are set as $\beta _{\rm {crit}}=0.001$
 , $\beta _{\rm {max}}=0.0014$
 , $D=0.1\,\mathrm {s}^{-1}$
 and $Z=3.0\times 10^7\,\mathrm {s}^{-1}$
 .

The temporal evolutions of $\beta _{\rm {ep}}$ , $A$
 , $V^{\prime }_{\theta }$
 , $E$
 and $N$
 for $\beta _{\rm {max}}=0.0011$
 , $\beta _{\rm {max}}=0.0014$
 and $\beta _{\rm {max}}=0.0017$
 are displayed in figure 6(a). With $\beta _{\rm {max}}$
 increasing, the burst frequency $\sim\!\!1/t_p$
 and width $\Delta t$
 of $A$
 both decrease; however, $A_{\rm {max}}$
 increases. As a result, the steady flow shear $\propto (\Delta t/t_p)Z\beta _{\rm {max}}A_{\rm {max}}$
 remains almost the same, which can be seen in figure 6(b). The average values of $E$
 and $N$
 over $t=0.1\unicode{x2013}0.2\,{\rm s}$
 also remain almost constant. Similar results for $\beta _{\rm {crit}}$
 are displayed in figure 7. There is a rapid ramp in the analytical solution of the green line when $\beta _{\rm {max}}$
 approaches $\beta _{\rm {crit}}$
 in figures 6(b) and 7(b). The reason is that as $\beta _{\rm {max}}\rightarrow \beta _{\rm {crit}}$
 , $A_{\rm {max}}Z\beta _{\rm {max}}\rightarrow D$
 and $\Delta t\rightarrow \infty$
 in (2.7b), the analytical solution is not valid in this parameter region.
(a) Temporal evolutions of $\beta _{\rm {ep}}$ , $A$
 , $V^{\prime }_{\theta }$
 , $E$
 and $N$
 for $\beta _{\rm {max}}=0.0011$
 , $\beta _{\rm {max}}=0.0014$
 and $\beta _{\rm {max}}=0.0017$
 . (b) Average values of $|V^{\prime }_{\theta }|$
 , $E$
 and $N$
 over $t=0.1\unicode{x2013}0.2\,{\rm s}$
 with $\beta _{\rm {max}}$
 increasing. Other parameters are set as $\beta _{\rm {crit}}=0.001$
 , $\varGamma =5.0\times 10^6\,\mathrm {s}^{-1}$
 , $D=0.1\,\mathrm {s}^{-1}$
 and $Z=3.0\times 10^7\,\mathrm {s}^{-1}$
 .

(a) Temporal evolutions of $\beta _{\rm {ep}}$ , $A$
 , $V^{\prime }_{\theta }$
 , $E$
 and $N$
 for $\beta _{\rm {crit}}=0.0008$
 , $\beta _{\rm {crit}}=0.001$
 and $\beta _{\rm {crit}}=0.0012$
 . (b) Average values of $|V^{\prime }_{\theta }|$
 , $E$
 and $N$
 over $t=0.1\unicode{x2013}0.2\,{\rm s}$
 with $\beta _{\rm {crit}}$
 increasing. Other parameters are set as $\beta _{\rm {max}}=0.0014$
 , $\varGamma =5.0\times 10^6\,\mathrm {s}^{-1}$
 , $D=0.1\,\mathrm {s}^{-1}$
 and $Z=3.0\times 10^7\,\mathrm {s}^{-1}$
 .

In conclusion, the key parameter that determines the ITB formation is $D$ in fishbone dynamics, whereas other parameters such as $Z$
 , $\beta _{\rm {crit}}$
 , $\beta _{\rm {max}}$
 and $\varGamma$
 are not significant. The reason is that the long-time average value of the flow shear, even though it oscillates with different amplitudes, grows linearly with increasing $D$
 ; however, it remains almost constant when varying other parameters. Upon the steady flow shear exceeding the critical value of low- to high-confinement transition, the turbulent fluctuation level reduces to zero and the ion pressure gradient attains high-confinement solution leading to the ITB formation around the $q=1$
 surface.
4. Discussion
Before presenting our summary and conclusions, we discuss the simplified models adopted in this paper and the implications of our results on the suppression of micro-turbulence by fishbone.
Regarding the predator–prey model, in order to derive the zero-dimensional predator–prey model from one-dimensional equations, the dynamics due to time-dependent frequency shifts is neglected. It is assumed that $\beta _{\mathrm {ep}}$ can be described by a characteristic spatial scale $\Delta \lesssim r_s$
 and $\partial _r \sim\!\!1/\Delta$
 , $\partial _r^2 \sim -1/\Delta ^2$
 (Zonca et al. Reference Zonca, Buratti, Cardinali, Chen, Dong, Long, Milovanov, Romanelli, Smeulders and Wang2007). Furthermore, in the EP transport equation (2.1), the diffusive transport is neglected by the assumption that it is much smaller than the convective transport originated from fishbone. The physics of EPs slowing down is also neglected in this model. If we keep this term, (2.1) could be written as

where $\tau _s$ represents the EP slowing-down time. Note that there is an equilibrium solution $\bar {\beta }_{\mathrm {ep}}=D\tau _s$
 at $A=0$
 , fishbone is unstable for $\bar {\beta }_{\mathrm {ep}}>\beta _{\mathrm {crit}}$
 , which indicates that $\tau _s$
 cannot be too small. Selecting a set of typical tokamak parameters such as $n_i\approx 2.5\times 10^{19}\,\mathrm {m}^{-3}$
 , $T_i\approx 1\,\mathrm {keV}$
 , the ion–ion collision time $\tau _i\approx 0.002\,\mathrm {s}$
 and $\tau _s \approx (\tau _i/2\sqrt {2})\sqrt {m_i/m_e}\approx 0.03\,\mathrm {s}$
 (here $m_{\mathrm {ep}}\approx m_i$
 is used), which is larger than fishbone burst period $t_p\approx 0.0119\,\mathrm {s}$
 in figure 1. In order to investigate the effect of $\tau _s$
 , the numerical solution of the predator–prey model and poloidal flow shear with different $\tau _s$
 is displayed in figure 8, other parameters are the same as in figures 1 and 2. One can see that for $\tau _s< t_p$
 , $\beta _{\mathrm {ep}}$
 remains its initial value and there is no fishbone instability. As for $\tau _s>t_p$
 , $\beta _{\mathrm {ep}}$
 behaves like a dying oscillation, in each successive period, $\beta _{\mathrm {max}}$
 and $A_{\mathrm {max}}$
 decreases continuously. According to formula (2.20), $\Delta t$
 increases and $t_p$
 decreases, which coincides with the results in figure 8. Comparing with the results without $\tau _s$
 term, the numerical solution remains qualitatively unchanged when $\tau _s \gg t_p$
 .


For the ion transport model, it is a semi-empirical model in which the coefficients $\gamma _0$ , $\alpha _1$
 , $\alpha _2$
 , $D_n$
 and $D_a$
 should be functions of radius and related to a lot of factors, nevertheless, they are all simply taken as constants. It only provides a qualitative description of the transport dynamics (Diamond et al. Reference Diamond, Lebedev, Newman, Carreras, Hahm, Tang, Rewoldt and Avinash1997), and more complete transport model is necessary to explore the transport transition and threshold effects (Newman et al. Reference Newman, Carreras, Lopez-Bruna, Diamond and Lebedev1998). Furthermore, in this work, we focus on the poloidal rotation induced by fishbone, and we assume that the toroidal rotation term and the ion pressure gradient term can be neglected before ITB forms. According to the radial ion force balance (2.23), the conditions for $V^{\prime }_E\approx V^{\prime }_{\theta }$
 are $|V^{\prime }_{\theta }|>|(V_{\varphi }B_{\theta }/B)^{\prime }|$
 and $|V^{\prime }_{\theta }|>|V^{\prime }_{* i}|$
 , where $V_{* i}\equiv (1/eBn_i)({\rm d}P_i/{\rm d}r)$
 is the ion diamagnetic velocity.
Finally, we discuss the implication of our results for suppression of micro-turbulence by fishbone. A figure of merit for fishbone stabilisation of turbulence can be derived as follows. The condition for suppression of ITG turbulence is $|V^{\prime }_{\theta }|>\gamma _{\mathrm {ITG}}$ , where the ITG growth rate $\gamma _{\mathrm {ITG}} \propto V_i/L_{P_i}$
 , $V_i\equiv \sqrt {T_i/m_i}$
 is the ion thermal velocity, $L_{P_i}\equiv -P_i/({\rm d}P_i/{\rm d}r)$
 is the scale length of thermal ion pressure profile. Substituting into (2.20) gives

where $\bar {n}_{\mathrm {ep}}$ is equilibrium EP density, $\bar {\beta }_{\mathrm {ep}}=D\tau _s$
 has been used and $\nu _{ii}\tau _s$
 is a constant. Therefore, we can define a figure of merit $Q_{\mathrm {fishbone}}$
 for suppression of ITG turbulence as follows:

This result indicates that suppression of ITG turbulence and formation of ITB is more likely for larger values of $Q_{\mathrm {fishbone}}$ .
5. Summary and conclusions
In this paper, fishbone dynamics is described by the well-known predator–prey model (White et al. Reference White, Goldston, McGuire, Boozer, Monticello and Park1983; Chen et al. Reference Chen, White and Rosenbluth1984; Zhu et al. Reference Zhu, Zeng, Qiu, Hao, Shen, Gu, Wu, Tang, Qian and Liu2020), (2.1) and (2.2). It is shown that there are only five free parameters in this model, $D$ , $Z$
 , $\beta _{\rm {crit}}$
 , $\beta _{\rm {max}}$
 and $\varGamma$
 . The evolution of EP beta $\beta _{\rm {ep}}$
 is bounded between $\beta _{\rm {min}}$
 and $\beta _{\rm {max}}$
 , and the minimum and maximum of fishbone amplitude $A$
 can be determined by (2.4) and (2.5). The fishbone induces redistribution of resonant EPs, and the EPs' convective transport leads to a radial current, which is proportional to the fishbone amplitude (Zonca et al. Reference Zonca, Buratti, Cardinali, Chen, Dong, Long, Milovanov, Romanelli, Smeulders and Wang2007). In order to satisfy the quasi-neutral condition, there must be a compensating plasma current with the same value and opposite direction. This radial current can drive plasma poloidal rotation through the $\boldsymbol{J}\times \boldsymbol{B}$
 torque (Rosenbluth & Hinton Reference Rosenbluth and Hinton1996; Peeters Reference Peeters1998; McClements & Thyagaraja Reference McClements and Thyagaraja2006; Thyagaraja et al. Reference Thyagaraja, Schwander and McClements2007), which is given in (2.13) and deduced in Appendix A, including the neoclassical effects (Shaing et al. Reference Shaing, Ida and Sabbagh2015). Because the fishbone amplitude constitutes successive bursts, steady poloidal flow can only be built up on condition that the burst frequency is greater than the poloidal flow damping rate (Pinches et al. Reference Pinches, Günter and Peeters2001). The absolute value of the steady flow shear can be analytically estimated by (2.19), and further simplified by (2.20) for small $D$
 (the deposition rate of trapped EPs within the $q=1$
 surface). The result indicates that the steady flow shear grows linearly with $D$
 increasing, and remains almost unchanged when varying other parameters of $Z$
 , $\beta _{\rm {crit}}$
 , $\beta _{\rm {max}}$
 and $\varGamma$
 , which has been numerically verified in § 3. Upon the flow shear exceeding the critical value given by (2.22), the turbulent fluctuation level reduces to zero and the ion pressure gradient attains the high-confinement state, assisting ITB formation. The transition process shown in figure 3 is stepwise, which coincides with the EAST experiments (Yang et al. Reference Yang, Gao, Liu, Li, Zhang, Zeng, Liu, Wu, Kong and Ming2017; Chu et al. Reference Chu, Liu, Zhang, Xu, Li, Jie, Lian, Zhou, Feng and Zhang2022). Note that in Chu et al. (Reference Chu, Liu, Zhang, Xu, Li, Jie, Lian, Zhou, Feng and Zhang2022), the experimental results showed that the higher NBI heating power leads to the stronger ITB. A figure of merit, $Q_{\mathrm {fishbone}}$
 given in above equation, has been derived based on (2.20). The suppression of ITG turbulence and formation of ITB by fishbone is more likely for larger values of $Q_{\mathrm {fishbone}}$
 .
This conclusion is qualitative, since it is derived from the simple zero-dimensional model. Extension to a one-dimensional model to obtain more quantitative results and uncover the spatiotemporal dynamics of the transition is left as future work. The radial distribution of the radial current should also be calculated more self-consistently by numerical simulations, for example, via M3D-K code (Fu et al. Reference Fu, Park, Strauss, Breslau, Chen, Jardin and Sugiyama2006). The $E\times B$ shear considered in this paper comes from the poloidal rotation driven by the radial current induced by fishbone: the effect of toroidal rotation and ion pressure gradient is beyond the scope of this paper. Considering the effect of the ion pressure gradient's contribution to the $E\times B$
 shear would lead to a more interesting transport bifurcation process (Diamond et al. Reference Diamond, Lebedev, Newman, Carreras, Hahm, Tang, Rewoldt and Avinash1997).
Acknowledgements
We thank Dr F. Zonca for useful discussions related to the fishbone dynamic model.
Editor P. Helander thanks the referees for their advice in evaluating this article.
Funding
This work is supported by the National MCF Energy R&D Program of China (Grant No. 2019YFE03050001).
Declaration of interests
The authors report no conflict of interest.
Appendix A. Equation for poloidal rotation driven by radial current including neoclassical effect
The plasma flow evolution equation can be obtained by summing the electron and ion momentum equations as (Rosenbluth & Hinton Reference Rosenbluth and Hinton1996; Peeters Reference Peeters1998)

where $\boldsymbol {V}$ is plasma flow, $\boldsymbol {J}_P$
 is plasma current and $P$
 and $\boldsymbol {\pi }$
 are the pressure scalar and tensor, respectively. The projection of (A1) on the direction of magnetic field and torus respectively are


After averaging over magnetic surface, one obtains


where we have defined $\boldsymbol {B}=B_t\boldsymbol {e}_t+B_p\boldsymbol {e}_p$ , the subscripts $t$
 and $p$
 representing toroidal and poloidal, respectively, and the coordinate is right-hand, $\boldsymbol {e}_r\equiv \boldsymbol {e}_t\times \boldsymbol {e}_p$
 . The magnetic surface average is defined as $\left \langle G\right \rangle \equiv \oint \,{\rm d}sG/B/\oint \,{\rm d}s/B$
 and $\left \langle \boldsymbol {B}\boldsymbol {\cdot } \boldsymbol {\nabla } P\right \rangle =0$
 , $R\boldsymbol {e}_t\boldsymbol {\cdot } \boldsymbol {\nabla } P + R\boldsymbol {e}_t\boldsymbol {\cdot } \boldsymbol {\nabla } \boldsymbol {\cdot } \boldsymbol {\pi }=0$
 because of toroidal symmetry.
The plasma flow perpendicular to the magnetic field in lowest order is (Peeters Reference Peeters1998)

where $E^{*r}\equiv \boldsymbol {E}^{*}\boldsymbol {\cdot } \boldsymbol {\nabla } r$ and $\boldsymbol {E}^{*}=-\boldsymbol {\nabla } \phi -\boldsymbol {\nabla } P_i/n_ie$
 is the effective electric field. As the plasma flow is less than the sound velocity, it is incompressible and can be expressed as $\boldsymbol {V}=K(\psi _p)\boldsymbol {B}+ G(\psi _p)R\boldsymbol {e}_t$
 , where $K(\psi _p)$
 and $G(\psi _p)$
 are flux functions,

Substituting (A7) into (A4) and (A5), one obtains


The plasma current is determined as follows (Rosenbluth & Hinton Reference Rosenbluth and Hinton1996): when there is radial current due to the interaction of EPs and fishbone, the plasma must carry a compensating current to satisfy the quasi-neutral condition, $\left \langle RB_pJ^r_P\right \rangle =-\left \langle J^{\psi _p}\right \rangle$ . Including the neoclassical effect (Shaing et al. Reference Shaing, Ida and Sabbagh2015),

By eliminating $\left \langle E^{*r}\right \rangle$ in (A8) and (A9), and using the lowest-order equilibrium $R=R_0(1+\epsilon \cos \theta )$
 , the magnetic surface average is $\left \langle G\right \rangle =\oint \,{\rm d}\theta (1+\epsilon \cos \theta )G$
 , and the equation for poloidal rotation $V_{\theta }\equiv \left \langle V_p\right \rangle$
 is

In (A11), $\left \langle J^{\psi _p}\right \rangle =|\boldsymbol {\nabla } \psi _p|J_r$ is the contravariant component of current induced by fishbone. A similar equation for poloidal rotation has been derived in Peeters (Reference Peeters1998) and Shaing et al. (Reference Shaing, Ida and Sabbagh2015); here, use is made of the lowest-order equilibrium to express the coefficients as function of $\epsilon$
 .