INTRODUCTION
Despite persistent low maize and grain legume yields, most smallholder farmers in Southern Africa are highly dependent on locally grown crops to meet their food requirements as opportunities to purchase food from external markets are limited. Maize in the region accounts for up to 50% of calories consumed on smallholder farms (SADC FANR, 2007). While maize is allocated to most of the arable land (often >80%) as a staple crop, rotations and intercrops with grain legumes such as soyabean (Glycine max. L), groundnut (Arachis hypogaea L.) and cowpea (Vigna unguiculata (L.) Walp) are commonly practiced (Shumba, Reference Shumba1983). The rotations and intercrops help to control diseases and pests, diversify household diets and reduce risk of crop failure (Giller and Cadisch, Reference Giller and Cadisch1995; Rusinamhodzi et al., Reference Rusinamhodzi, Corbeels, Nyamangara and Giller2012). Besides providing a cheap source of protein, grain legumes also significantly contribute to calorie needs of African smallholder farmers as they are usually processed into various edible products on-farm (Ashaye et al., Reference Ashaye, Adegbulugbe and Sanni2005; Mpepereki et al., Reference Mpepereki, Javaheri, Davis and Giller2000). However, both maize and grain legume yields rarely exceed 1 t ha−1, largely due to poor and declining soil fertility (Mapfumo and Giller, Reference Mapfumo and Giller2001). External nutrients are sub-optimally applied because of their inaccessibility and high costs (Mapfumo and Giller, Reference Mapfumo and Giller2001; Vanlauwe and Giller, Reference Vanlauwe and Giller2006). With diminishing opportunities for agricultural expansion into new areas, there is a need to focus on intensifying production on existing croplands. This also inevitably calls for restoration of land currently abandoned by farmers due to loss of soil productivity.
In response to problems of nutrient scarcity as well as addressing environmental concerns on smallholder farms, the last two decades have seen soil fertility studies focusing on combining organic and inorganic nutrient sources (Buresh et al., Reference Buresh, Sanchez and Calhoun1997; Vanlauwe et al., Reference Vanlauwe, Aihou, Aman, Iwuafor, Tossah, Diels, Sanginga, Lyasse, Merckx and Deckers2001). Drawing from decades of research on soil biological processes (Swift et al., Reference Swift, Bohren, Carter, Izac, Woomer, Woomer and Swift1994), several of such studies formed the basis to the concept of integrated soil fertility management (ISFM). ISFM is premised on combined use of organic resources and mineral fertilizers with improved germplasm and systematic rotations of cereals with N2-fixing legumes according to farmer production circumstances (Mapfumo et al., Reference Mapfumo2009; Vanlauwe et al., Reference Vanlauwe, Bationo, Chianu, Giller, Merckx, Mokwunye, Ohiokpehai, Pypers, Tabo, Shepherd, Smaling, Woomer and Sanginga2010). Despite studies providing empirical evidence that ISFM technologies can increase crop yields (e.g. Gentile et al., Reference Gentile, Vanlauwe, van Kessel and Six2009; Vanlauwe et al., Reference Vanlauwe, Aihou, Aman, Iwuafor, Tossah, Diels, Sanginga, Lyasse, Merckx and Deckers2001), there has been little uptake by farmers. In Zimbabwe, for instance, smallholder farmers have used between 20–100 kg of mineral N fertilizer and 0–10 t of cattle manure per farm per year (Mtambanengwe and Mapfumo, Reference Mtambanengwe and Mapfumo2008; Zingore, Reference Zingore2006). The disparities in quantity and quality of the nutrient resources are generally a function of farmer resource endowment (Mapfumo and Mtambanengwe, Reference Mtambanengwe and Mapfumo2005), suggesting the need to package ISFM options in response to these farmer categories. Increasingly, there are clear demands for intensification of legume–cereal systems, but still lacking are the technical options for addressing fundamental challenges of poor and diminishing soil fertility. Under current smallholder cropping in Southern Africa, nutrients are often applied to maize, with legumes only benefiting from residual fertility in a rotation (Waddington and Karigwindi, Reference Waddington and Karigwindi2001). However, there is evidence of better crop yields when P-containing basal fertilizers are applied to the legume crop (Chikowo et al., Reference Chikowo, Tagwira and Piha1999; Kanonge et al., Reference Kanonge, Nezomba, Chikowo, Mtambanengwe and Mapfumo2009). These findings show a need for medium to long-term studies to assess how different combinations of ISFM technology components can be sequenced across temporal scales to build soil productivity and increase efficiency of resource use.
Smallholder farmers have been shown to cumulatively build islands of fertility through preferential allocation and loading of nutrients to specific fields or sections within fields (Mtambanengwe and Mapfumo, Reference Mtambanengwe and Mapfumo2005; Zingore, Reference Zingore2006), and this is often exemplified by fields close to homesteads. However, such fields are usually too small to significantly contribute to aggregate farm-level crop yields (Mtambanengwe and Mapfumo, Reference Mtambanengwe and Mapfumo2005; Zingore et al., Reference Zingore, Tittonell, Corbeels, van Wijk and Giller2011). Failure to allocate nutrient inputs to the remaining fields has often resulted in farmers abandoning such lands or aggravating degradation processes through mining of soil nutrients. Efforts to address this challenge through alternative technical approaches such as conservation agriculture (CA) have in turn been undermined by poor soil fertility. The short-to-medium yield benefits of CA have often been too poor to attract farmers’ interest and commitment (Tittonell et al., Reference Tittonell, Scopel, Andrieu, Posthumus, Mapfumo, Corbeels, van Halsema, Lahmar, Lugandu, Rakotoarisoa, Mtambanengwe, Pound, Chikowo, Naudin, Triomphe and Mkomwa2012). In order to increase farm-level crop yields and meet demands for household food and income, it is imperative to explore options for building soil fertility over relatively shorter periods compared with current farmer strategies. We hypothesized that systematic sequences of ISFM options cumulatively enhance efficient use of the limited nutrient resources available to farmers, significantly increasing maize and grain legume yields and contributing to self-sufficiency in calorie and protein production by different categories of households. The study therefore sought to evaluate the influence of sequences of different ISFM options on crop productivity and calorie and protein production, and resource use efficiencies on smallholder farms in eastern Zimbabwe. Specific objectives were to: (i) determine the effectiveness of different ISFM options as entry points for enhancing crop yields, and the subsequent calorie and protein production; (ii) quantify changes in available P under different ISFM sequences and (iii) assess profitability of different sequences of ISFM options.
MATERIALS AND METHODS
Study sites
The study was conducted between 2005 and 2011 in Hwedza (18o 41´S; 31o42´E) and Makoni (18o 13´S; 32o 22´E) smallholder farming areas in Zimbabwe over 4 years as part of adaptive ISFM research initiatives by the Soil Fertility Consortium for Southern Africa (SOFECSA) (www.sofecsa.org). Makoni lies in Zimbabwe's Natural Region (NR) III, while Hwedza covers NR IIb and III. The NRs are based on average annual rainfall, with NR II and III receiving over 750 and 650–750 mm per annum, respectively, between November and March (Vincent and Thomas, Reference Vincent and Thomas1961). Makoni is a medium to high potential area with poor market access and a poor road network. Detailed description of Makoni is given by Mtambanengwe and Mapfumo (Reference Mtambanengwe and Mapfumo2005). Hwedza is an old communal area with a long history of smallholder farming (>75 years) and average landholding of <3 ha per household. Maize and grain legumes that include groundnut, cowpea, Bambara nuts and soyabean are the dominant crops grown in the area. In both areas, soils are predominantly Lixisols (covering >50% of the area) derived from granitic parent material (World Reference Base, 1998). Cattle are a major source of manure but ownership is variable, ranging from 0 to >6 cattle per household. There is strong interaction between livestock and cropping in both areas.
Prioritizing ISFM options with communities
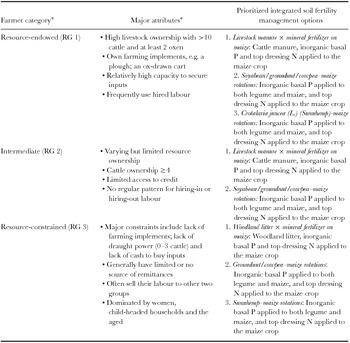
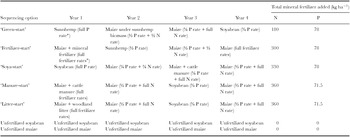
This study built on SOFECSA's operational framework designed to promote ISFM technology options that enhance intensity and efficiency of use of mineral and organic fertilizer combinations by different categories of smallholder farming households across agro-ecological zones of Southern Africa (Mapfumo, Reference Mapfumo2009). In 2005, farmer participatory research activities were conducted to (i) identify soil fertility management practices employed by farmers in maize and legume production, (ii) establish levels of organic and inorganic nutrient inputs applied and (iii) commonly practiced cropping sequences. A major outcome of the participatory work was the identification of three major soil fertility management regimes by farmers of different resource groups (Table 1). While there was little diversity in the prioritized ISFM options, the farmers highlighted that the intensity of use of both organic and inorganic fertilizers was dictated by farmer resource endowment. Different farmer resource groups were therefore envisaged to prefer specific sequencing options. Building on findings from participatory enquiry and related studies on soil fertility gradients and nutrient resource allocation on smallholder farms (Mtambanengwe, Reference Mtambanengwe2006; Zingore, Reference Zingore2006), five major ISFM options were identified for sequencing. These involved manure/woodland litter-, NPK fertilizer- and legume-based rotations (Table 2).
Integrated soil fertility management regimes prioritized by farmers differing in resource endowment on smallholder farms in Zimbabwe.

*Adapted from Mtambanengwe and Mapfumo (Reference Mtambanengwe and Mapfumo2005).
Sequencing framework of integrated soil fertility management (ISFM) options on smallholder farms in Zimbabwe.

Full P rate for legumes = 26 kg P ha−1; Full mineral fertilizer rates for maize = 26 kg P ha-1 and 120 kg N ha−1.
Rationale for sequencing of ISFM options
This paper advances the sequencing concept to enhance the value of ISFM in sustainable crop intensification on smallholder farms, drawing on intimate knowledge of farming systems in Southern Africa. Underpinning this concept is the requirement to build soil P through seasonal/yearly P additions, coupled to external organic resource inputs to progressively enhance the functioning of microbial processes that drive efficiency of nutrient cycling, including improvement of N2 fixation by legumes. Different sequences of ISFM options, primarily defined by combined use of organic and inorganic nutrient sources, are premised to have dissimilar effects in ‘kick-starting’ soil biological processes that determine P accumulation and agronomic use efficiency of added nutrient (especially N), and subsequently on crop yields, in the short- to medium-term period.
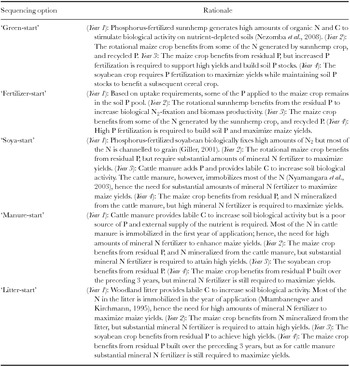
In advancing the sequencing concept in this study, N and P fertilization strategies were considered the major drivers for increasing crop productivity on nutrient-depleted granitic sandy soils on smallholder farms in Zimbabwe. Sandy soils in Zimbabwe are known to be inherently deficient in N and P (Grant, Reference Grant1981; Mashiringwani, Reference Mashiringwani1983) and characterized by low soil organic matter (SOM) (Mapfumo et al., Reference Mapfumo, Mtambanengwe and Vanlauwe2007). Although research has also revealed deficiencies in Ca, Mg and micronutrients such as Zn (Manzeke et al., Reference Manzeke, Mapfumo, Mtambanengwe, Chikowo, Tendayi and Cakmak2012; Mapfumo and Mtambanengwe, Reference Mapfumo, Mtambanengwe and Bationo2004; Tagwira, Reference Tagwira1991), significant crop yield responses have mostly been realized following addition of N and P fertilizers (Manzeke, Reference Manzeke, Mapfumo, Mtambanengwe, Chikowo, Tendayi and Cakmak2013; Piha, Reference Piha1993). With adequate N and P fertilization, the sandy soils have been found to easily support grain yields of up to 4 t ha−1 for maize and 2 t ha−1 for soyabean (Kasasa et al., Reference Kasasa, Mpepereki, Musiyiwa, Makonese and Giller1999; Piha, Reference Piha1993). In this study, amounts of total N and P required to attain the target yields were theoretically derived based on crop uptake requirements (Janssen et al., Reference Janssen, Guiking, van der Eijk, Smaling, Wolf and van Reuler1990; Nijhof, Reference Nijhof1987; Piha, Reference Piha1993). It was estimated that 1 t of maize grain and 1 t of stover remove 27 kg N and 5 kg P from the soil, while 1 t of soyabean grain removes 3 kg P. Soyabean stover was assumed to remove negligible soil P given that most of it decomposes in-situ, as most of the leaves are shed before harvesting is done. The underpinning principle in the sequences was to build soil P to enhance use efficiency of N supplied through organic resources and mineral fertilizers. The basis for applying different rates of mineral N and P fertilizer under the sequences was informed by conceptual N and P budgets. These were based on: (i) estimated biomass productivity and quantities of N2 fixed by soyabean and Crotalaria juncea (L.) (sunnhemp) on sandy soils (Kasasa et al., Reference Kasasa, Mpepereki, Musiyiwa, Makonese and Giller1999; Nezomba et al., Reference Nezomba, Tauro, Mtambanengwe and Mapfumo2008); (ii) potential N and P supply from cattle manure and woodland litter (Palm et al., Reference Palm, Gachengo, Delve, Cadisch and Giller2001); (iii) native soil N and P supply capacity (Chikowo et al., Reference Chikowo, Corbeels, Mapfumo, Tittonell, Vanlauwe and Giller2010; Jansen et al., Reference Janssen, Guiking, van der Eijk, Smaling, Wolf and van Reuler1990); (iv) estimated erosion and leaching losses from field measurements in Zimbabwe (Chikowo et al., Reference Chikowo, Mapfumo, Nyamugafata and Giller2004; Elwell and Stocking, Reference Elwell and Stocking1988) and (v) N and P removal in grain and stover (Janssen et al., Reference Janssen, Guiking, van der Eijk, Smaling, Wolf and van Reuler1990; Nijhof, Reference Nijhof1987; Palm et al., Reference Palm, Gachengo, Delve, Cadisch and Giller2001). A summary of the rationale for different rates of mineral N and P fertilizers under the sequences is presented in Table 3.
A summary of the conceptual rationale used for applying different rates of mineral N and P fertilizer under the ISFM sequences.

Selection of case study farms
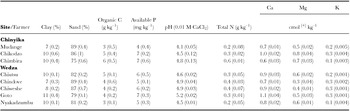
Field experimentation sites were selected through farmer participatory research approaches, including community transect walks and key informant interviews. Given that previous studies in similar areas showed consistence between local and laboratory of indicators of soil productivity (Mtambanengwe and Mapfumo, Reference Mtambanengwe and Mapfumo2005), the selection criteria also drew from farmers’ local knowledge of indicators of nutrient-depleted soils. In Makoni, experiments were established on three field sites during the 2005–2006 cropping season, while five sites were established in Hwedza in the 2007–2008 cropping season. The sites had similar soil texture, catenary position, slope and history of management, and fell into what farmers classified as ‘poor’ fields. All the sites had been under continuous-fertilized maize crop prior to establishment of the experiments. The sites also served as knowledge-sharing platforms under the SOFECSA Learning Centre approach (Mapfumo, Reference Mapfumo2009; Mapfumo et al., Reference Rurinda, Mapfumo, van Wijk, Mtambanengwe, Rufino, Chikowo and Giller2013). Before establishment of experiments, soils (0–20 cm depth) were sampled from each site and analysed for total organic C (Walkley-Black), total N (micro-Kjeldahl), plant available soil P (Olsen), pH (0.01 M CaCl2) and texture (hydrometer method) (Anderson and Ingram, Reference Anderson and Ingram1993). The fields were then mouldboard-ploughed soon after the first effective rains. The soils had a mean clay content of 9% across the sites (Table 4). Plant available soil P averaged ~6 mg kg−1, with soils from Makoni showing relatively more organic C (0.5%) than in Hwedza (~0.4%). However, soil pH was relatively high in Hwedza (4.8) compared with Makoni (4.5) (Table 4).
Physical and chemical characteristics of soils (0–20 cm) at establishment of experiments in Makoni and Hwedza smallholder farming areas in Zimbabwe.

Figures in parentheses denote standard error of mean (SEM).
Establishment of experiments
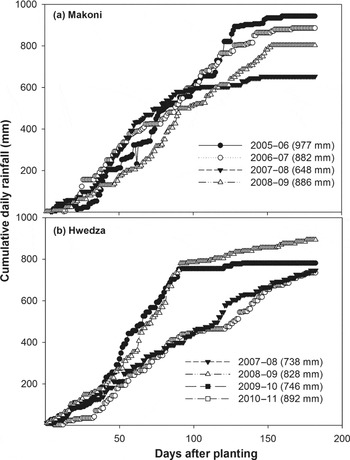
In the first year of experimentation, all field sites had seven major treatments (Table 2): (i) Maize receiving mineral fertilizer only, (ii) Maize with mineral fertilizer + cattle manure, (iii) Maize with mineral fertilizer + composted woodland litter, (iv) Soyabean with basal P, (v) Sunnhemp with basal P, (vi) Continuous unfertilized maize and (vii) Continuous unfertilized soyabean. Both maize and legumes received basal P fertilizer at 26 kg P ha−1 in a new formulation marketed as PKS blend (0% N:32% P2O5:16% K2O:5% S). The maize was top-dressed at 120 kg N ha−1 using ammonium nitrate (34.5% N) applied in three splits: 30% at 2 weeks after emergency (WAE); 40% at 6 WAE and the remaining 30% at 9 WAE. In the succeeding seasons, the ISFM treatments were assigned as shown in Table 2. Cattle manure and woodland litter were applied at 7 t ha−1 and incorporated into soil. The two organic resources were sub-sampled for chemical quality characterization just before application during each cropping season. Overall, both cattle manure and woodland litter had total N contents of 0.6–1.0% and total P ranged from 0.14 to 0.22%. Extractable Mg and K in cattle manure were 0.12 and 0.61%, respectively, while woodland litter contained 0.15% Mg and 0.18% K. Total annual rainfall received during the study period ranged from 648 (2007–2008 season) to 977 mm (2005–2006 season) for Makoni and 738 (2007–2008 season) to 892 mm (2010–2011 season) for Hwedza (Figure 1). The 2007–2008 and 2010–2011 seasons were characterized by poor rainfall distribution.
Cumulative daily rainfall received in (a) Makoni and (b) Hwedza during the study period.

Experimental treatments were replicated across farms, with gross plot sizes of at least 100 m2. Maize (SC 513) was planted at a population density 37 000 plants ha−1. Legumes were planted at a spacing of 0.45 m inter-row and 0.15 m within rows. The experimental plots were kept weed-free through manual weeding. In addition to the experimental field sites, the most (rich) and least (poor) productive maize fields belonging to host farmers and other households of similar resource endowment were monitored in Hwedza during the 2007–2008, 2008–2009 and 2009–2010 cropping seasons. As opposed to Makoni where smallholder farming only began after 1982 (Mtambanengwe and Mapfumo, Reference Mtambanengwe and Mapfumo2005), Hwedza has >75 years of smallholder farming and therefore presented a good basis for comparing the performance of the sequences against long-term farmer soil fertility management practices. Data on quantity and quality of nutrients (mineral fertilizers, manure and woodland litter) applied during each cropping season were collected through farm diaries, semi-structured interviews and direct measurements. Where sub-samples of the organic resource inputs could not be collected for chemical quality determination, estimates were made from available organic resources databases (e.g. Palm et al., Reference Palm, Gachengo, Delve, Cadisch and Giller2001). The quantities of organic nutrients applied per field were given in local units, and these were converted to kg ha−1 using known estimates (Mapfumo and Giller, Reference Mapfumo and Giller2001).
Determining crop productivity and nutritional value
Maize productivity was determined at physiological maturity from net plots measuring 3.6 m × 5 m. Three within-plot replicates were harvested per treatment and grain yield determined at 12.5% moisture content. The total dry matter yield was quantified after oven-drying of whole plant biomass to constant mass at 60 °C. Sub-samples of grain and stover were ground and analysed for total N and P using methods described by Anderson and Ingram (Reference Anderson and Ingram1993). Sunnhemp and soyabean biomass yields were quantified at peak (50%) flowering using random grid sampling. Biomass present within three randomly located quadrats of 1 m−2 were cut at soil level in each plot. The fresh biomass was initially air-dried under shade before oven-drying to constant weight at 60 °C for dry matter determination. Soyabean grain and stover yields were quantified at physiological maturity from three replicate net plots measuring 1.8 m × 5 m each.
Energy derived from maize and soyabean grain were estimated by converting grain yields into kilocalories (kcal) using the ratios: 1 kg of maize grain = 3840 kcal (USDA, 1984) and 1 kg of soyabean grain = 4460 kcal (FAOSTAT, Reference FAOSTAT2010). The calories data were used to infer household food self-sufficiency using a threshold of 3.9 × 10⁶ kcal year−1 for a family of six people (FAO, 2009). The yields were also converted to protein equivalents using protein content estimates of 8 and 40% for maize and soyabean grain, respectively (Blackman et al., Reference Blackman, Obendorf and Leopold1992; USDA, 1984).
Soil sampling and analyses
After crop harvesting in June, soils (0–20 cm depth) were sampled from 10 randomly selected points in each plot. Replicate samples from each plot were thoroughly mixed before sub-sampling for analysis. The samples were air-dried and passed through a 2-mm sieve, after which they were analysed for total organic C, total N, plant available soil P and pH (Anderson and Ingram, Reference Anderson and Ingram1993).
Estimating N and P agronomic efficiencies
In order to assess the medium-term cumulative effect of the different fertilization options on nutrient use efficiency under maize, agronomic N and P efficiencies were quantified in the fourth year based on nutrients applied during that year. Preliminary analysis in the first 3 years showed not significant patterns (data not shown). The agronomic N and P efficiencies were calculated by subtracting maize grain yield in unfertilized plots (controls) from yields in respective treatment plots, divided by the total amount of nutrients applied, thus
 \begin{equation*}
X - {\rm AE}\,({\rm kg}\,{\rm grain}\,{\rm kg}\,{\rm X}^{ - 1} ) = \frac{{{\rm Grain}\,{\rm yield}\,{\rm (treatment)} - {\rm Grain}\,{\rm yield}\,{\rm (control)}}}{{{\rm X}\,{\rm applied}}}
\end{equation*}
where X is either N or P.
Total N and P applied were calculated as the sum of (i) externally added inorganic fertilizers and organic materials, (ii) in-situ dry season above ground biomass and (iii) root biomass of preceding crops. Nitrogen and P inputs from externally added organic materials were quantified by multiplying the nutrient concentration by the quantity applied. Because the experimental fields were grazed by livestock during the dry seasons, the reduced levels of above ground biomass (mainly from remnants of crop residues) at the start of the cropping season were calculated on the basis of estimates by Mtambanengwe and Mapfumo (Reference Mtambanengwe and Mapfumo2005). Root biomass of preceding maize and soyabean were estimated using root to shoot ratios of 0.2 (Balesdent and Balabane, Reference Balesdent and Balabane1992) and 0.1 (Sanders and Brown, Reference Sanders and Brown1976), respectively. The estimated N and P content in the root biomass were derived from organic resources databases (e.g. Palm et al., Reference Palm, Gachengo, Delve, Cadisch and Giller2001).
Quantifying profitability of the sequences
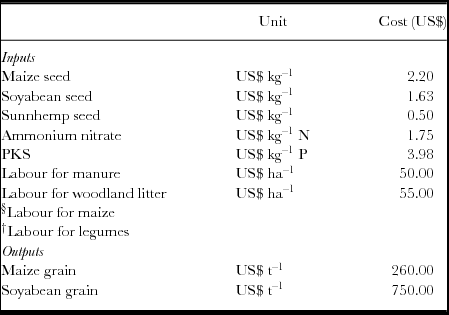
Economic profitability under ISFM sequences as well as on farmers’ fields was quantified using gross margin analysis (Gittinger, Reference Gittinger1984). Economic benefit per year was calculated as the difference between the field value of the output (grain yield) and the field value of inputs (seed, fertilizers and labour). The value of seed and fertilizers were obtained from the nearby district town at time of planting. Estimates of labour costs for land preparation, planting, fertilizer application, weeding and harvesting were collected through farm diaries and semi-structured interviews. The values of maize and soyabean grain were taken as the farm gate price at harvest. Input and output prices were taken as the averages of 2008–2009, 2009–2010 and 2010–2011 cropping seasons. The value of cattle manure and woodland litter were estimated as the cost of labour for collecting the manure from kraals or litter from the woodlands and applying them to fields. Prices for early years of the study were difficult to estimate due to hyperinflation in Zimbabwe. The unit prices of the inputs and the outputs used in the gross margin analysis are presented on Table 5. For each sequence, a net present value (NPV) of yearly gross margins was computed by summing discounted annual margins (Gittinger, Reference Gittinger1984). The NPV is a financial performance indicator, which give an absolute measure of the present worth of an income stream accruing to farmers (Gittinger, Reference Gittinger1984).
Input and output prices used in gross margin analyses under different ISFM sequences in Makoni and Hwedza smallholder farming areas in Zimbabwe. Prices are averages of 2008/2009, 2009/2010 and 2010/2011 cropping seasons.

§Labour for maize:
Land preparation = 4 man-days ha−1.
Planting = 10 man-days ha−1.
Inorganic fertilizer application = 4 man-days ha−1.
Weeding = 38 man-days ha−1.
Harvesting = 24 man-days ha−1.
†Labour for legumes:
Land preparation = 4 man-days ha−1.
Planting = 14 man-days ha−1.
Inorganic fertilizer application = 1 man-day ha−1.
Weeding = 30 man-days ha−1.
Harvesting = 18 man-days ha−1.
Local daily casual worker rate = US$3.00 per day.
Data analyses
Statistical analysis was done using GENSTAT 13th Edition. Analysis of variance (ANOVA) was used to separate effects of different sequencing treatments on crop yields, and subsequent calorie and protein contribution. ANOVA was also used to determine treatment differences with respect to N and P agronomic use efficiencies, plant available soil P and gross margins. In years, when soyabean was planted in two sequences only, Student t-test was used to separate treatment effects. Mean separation was done using least significant difference (LSD) at p < 0.05. Relationships between pre-season available P and maize productivity were tested using linear regressions.
RESULTS
Crop yields and calorie production under different ISFM sequences
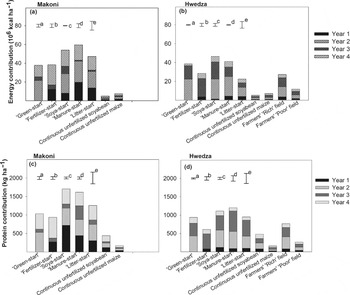
In the first year, maize grain yields in Makoni were highest under ‘Manure-start’, which gave 5.5 t ha−1 compared with 0.5 t ha−1 under continuous unfertilized maize. ‘Litter-start’ gave 3.8 t ha−1, while ‘Fertilizer-start’ yielded 3.4 t ha−1. These yields translated into significant (p < 0.05) differences in calorie production among the sequences (Figure 2a). ‘Manure-start’ produced 20 × 106 kcal; about 1.6 and 11 times more calories than ‘Fertilizer-start’ and continuous unfertilized maize, respectively. In the second year, maize grain yields under the sequences ranged from 5.5 t ha−1 under ‘Litter-start’ to 6.6 t ha−1 under ‘Green-start’, resulting in an average calorie production of 20 × 106 kcal. Due to poor rainfall distribution in the third year, all sequences gave <8 × 10⁶ kcal. In the fourth year, all the sequences gave >4 t ha−1 of maize grain, with the highest yield attained under ‘Fertilizer-start’ (5.5 t ha−1). The high maize yield under ‘Fertilizer-start’ translated to a calorie production of 22 × 106 kcal; significantly (p < 0.05) out-performing continuous unfertilized maize by more than 10-fold. Cumulatively over 4 years, ‘Manure start’ gave 60 × 106 kcal compared with <8 × 10⁶ kcal under continuous unfertilized treatments. There were no significant differences in cumulative calorie yields among ‘Litter-start, ‘Green-start’ and ‘Fertilizer-start’ (Figure 2a).
Energy (kcal ha−1) (a and b) and protein (kg ha−1) (c and d) derived from maize and soyabean grain produced under different ISFM sequences in Makoni and Hwedza smallholder farming area, Zimbabwe (‘rich’ and ‘poor’ fields refer to farmers’ designated most and least productive fields, respectively). Error bars represent standard error of the difference of means (SEDs) for a = Year 1, b = Year 2, c = Year 3, d = Year 4 and e = Overall.

In Hwedza, all the sequences produced maize and soyabean grain yields of <1 t ha−1 in the first year, resulting in calorie yields of no more than 5 × 10⁶ kcal per treatment (Figure 2b). The low yields were mainly attributed to poor rainfall distribution. In the second year, sequences produced maize grain yields of between 4.1 t ha−1 (‘Litter-start’) and 5.9 t ha−1 (‘Soya-start’). Consequently, most sequences produced >20 × 106 kcal, significantly (p < 0.05) out-yielding farmers’ poor fields by 400%. Similar to the second year, sequences produced maize grain yields of >4 t ha−1 in the third year. This translated to most of the sequences producing more calories than under farmers’ fields. Due to poor rainfall distribution in the fourth year, sequences and farmers’ rich fields gave <1.5 t ha−1 of maize grain, but significantly produced more calories than under unfertilized treatments and farmers’ designated poor fields. ‘Soya-start’ gave the highest cumulative calorie production of 46 × 106 kcal, while continuous-unfertilized treatments cumulatively yielded <12 × 106 kcal (Figure 2b).
Protein production under different ISFM sequences
In Makoni, ‘Soya-start’ gave the highest protein production of 720 kg in the first year compared with <300 kg under ‘Fertilizer-start’, ‘Litter-start’ and unfertilized treatments (Figure 2c). In the second year, ‘Green-start’ gave the most protein (528 kg ha−1), but was not significantly different from ‘Soya-start’, ‘Manure-start’ and ‘Litter-start’. Although crop yields were low in the third year due to poor rainfall distribution, ‘Manure-start’ gave significantly higher protein production than the other sequences. In the fourth year, protein production ranged from 48 kg under continuous unfertilized maize to 560 kg under ‘Fertilizer-start’. Over the 4-year period, ‘Soya-start’ and ‘Manure-start’ gave the best cumulative proteins of >1600 kg ha−1. Unfertilized maize and soyabean gave the lowest cumulative protein yields. In Hwedza (first year), protein yields were <120 kg across the sequences as a result of low crop yields (Figure 2d). In the second year, ‘Green-start’, ‘Soya-start’ and ‘Litter-start’ gave an average protein production of 457 kg and were not significantly different from farmers’ rich fields. In the third year, ‘Manure-start’ (560 kg) gave the highest protein yield, significantly out-performing farmers’ rich and poor fields by 304 and 480 kg, respectively. Consistent with Makoni, ‘Soya-start’ and ‘Manure-start’ cumulatively gave the highest protein production over the 4-year period (Figure 2d).
Changes in plant available soil P and influence on maize productivity
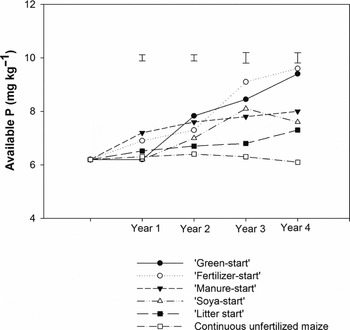
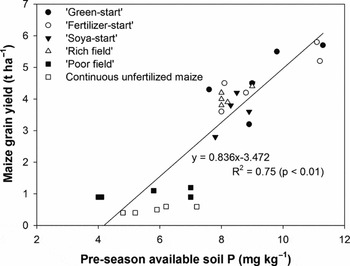
Overall, there were cumulative gains in plant availability soil P with sequencing of ISFM options (Figure 3). The highest increases were attained under ‘Green-start’ and ‘Fertilizer-start’, with the former increasing plant available soil P from 6 mg kg−1 to approximately 10 mg kg−1 over the 4-year period. The high plant available soil P under ‘Fertilizer-start’ and ‘Green-start’ could have been due to recycling and reduced off-take of P as sunnhemp biomass was incorporated in-situ, although further investigations are warranted to explain why the two treatments differ. Under ‘Manure-start’, and ’Soya-start’, plant available soil P increased from 6.5 to 10 mg kg−1. Continuous-unfertilized maize consistently gave the least available P. There was a significant positive relationship (R 2 = 0.75, p < 0.01) between pre-season available P and maize grain yields attained in sequencing in Chinyika (Figure 4). At least 3 t ha−1 of maize grain was obtained on soils with pre-season available P of >8 mg kg−1.
Changes in plant available soil P (0–20 cm) under different ISFM sequences on smallholder farms in Makoni, Zimbabwe. Error bars represent standard error of the difference of means (SEDs).

Relationship between maize yields in the third year and pre-season plant available soil P (0–20 cm) under different ISFM sequences in Hwedza smallholder farming area, Zimbabwe (‘rich’ and ‘poor’ fields refer to farmers’ designated most and least productive fields, respectively).

Agronomic N and P efficiencies
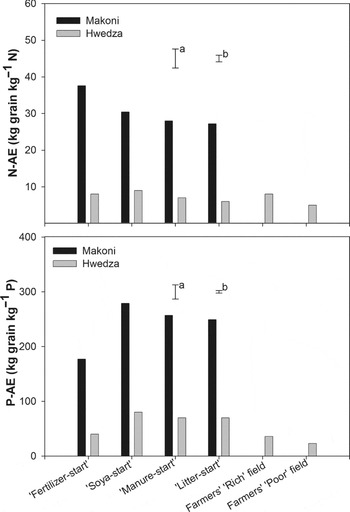
In Makoni, ‘Fertilizer-start’ gave the highest agronomic N efficiency (N-AE) of 38 kg grain kg−1 N; out-performing ‘Litter-start’ by 41% (Figure 5a). Due to poor maize grain yields in Hwedza, N-AEs did not significantly (p > 0.05) differ among treatments, with all treatments yielding <10 kg grain kg−1 N. Apparent agronomic P efficiencies (P-AEs) showed a different trend to N-AEs (Figure 5b). In Makoni, ‘Soya-start’ gave the highest P-AE of 279 kg grain kg−1 P, which was not significantly different from ‘Manure-start’ and ‘Litter-start’. Although P-AEs in Hwedza were <80 kg grain kg−1 P due to overall poor maize yields, most of the sequences gave better efficiencies than farmers’ designated rich and poor fields.
Agronomic N (a) and P (b) efficiencies in the fourth year of sequencing in Makoni and Hwedza smallholder farming areas, Zimbabwe. Error bars represent standard error of the difference of means (SEDs) for a = Makoni and b = Hwedza.

Economic profitability of ISFM sequences
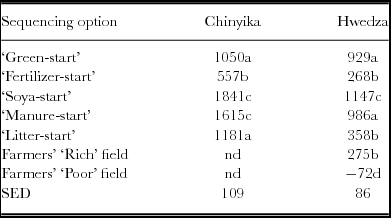
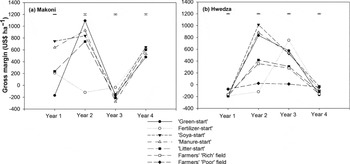
In the first year in Makoni, ‘Soya-start’ and ‘Manure-start’ gave the highest gross margins of over US$600; more than double returns under ‘Fertilizer-start and ‘Litter-start’ (Figure 6a). In the second year, ‘Green-start’ (US$1093) gave the best financial returns. Gross margins were negative across treatments in the third year due to poor grain yields. With better grain yields in the fourth year, gross margins were positive ranging from US$479 under ‘Green-start’ to US$648 under ‘Soya-start’. Overall, ‘Soya-start’ and ‘Fertilizer-start’ gave the highest and least NPVs, respectively (Table 6). In Hwedza, financial returns were negative in the first year as grain yields were low due to drought (Figure 6b). In the second year, ‘Soya-start’ (US$1015) gave the highest gross margin; 3 and 44 times financial returns under farmers’ rich and poor fields, respectively. In the third year, gross margins under sequences ranged from US$308 (‘Litter-start’) to US$753 (‘Fertilizer-start’). The farmers’ poor fields gave US$11. All the treatments recorded negative gross margins in the fourth year as a result of low grain yields. As was the case in Makoni, ‘Soya-start’ (US$1147) gave the highest NPV while farmers’ rich fields accrued <US$300. Farmers’ designated poor fields gave a negative NPV (Table 6).
Net present values (US$ ha−1) of ISFM sequences over four seasons in Makoni and Hwedza smallholder farming areas in Zimbabwe (‘rich’ and ‘poor’ fields refer to farmers’ designated most and least productive fields, respectively).

Means in the same column followed by the same letter are not significantly different; n/d = not determined; SED– Standard error of the difference of means. Net present values were calculated at a real interest rate of 6%.
Gross margins (US$ ha−1) of ISFM sequences over four seasons in (a) Makoni and (b) Hwedza smallholder farming area in Zimbabwe.

DISCUSSION
ISFM sequences as entry points for enhancing crop productivity on sandy soils
Most of the sequences gave higher calorie and protein production than the designated farmers’ rich and poor fields. These results suggest that such ISFM-based sequences can enhance crop productivity on sandy soils to significantly contribute to energy and protein needs of smallholder farmers. The high crop productivity under the sequences could be explained by repeated inorganic P fertilization. Cumulatively over the 4-year period, the sequences received between 71.5 and 78 kg P ha−1. On the contrary, addition of inorganic P fertilizers under smallholder cropping is often minimal, particularly in maize production (Zingore, Reference Zingore2006). Most smallholder farmers apply organic materials solely as basal and use mineral N fertilizer as top-dressing; yet most organic materials are known to be poor sources of P (Buresh et al., Reference Buresh, Sanchez and Calhoun1997). On granitic sandy soils predominating the smallholder farming systems in Southern Africa, N and P are the most limiting nutrients (Hartemink and Huting, Reference Hartemink and Huting2008; Nyamapfene, 1989). The inclusion of soyabean under the sequences also contributed to better calorie and protein production than the farmers’ designated rich and poor fields, which were predominantly under maize monocropping. Soyabean grain contains more calories and protein than maize grain per unit mass (Blackman et al., Reference Blackman, Obendorf and Leopold1992; USDA, 1984). While smallholder farmers often grow grain legumes on degraded and small field sections with limited nutrient inputs (Giller and Cadisch, Reference Giller and Cadisch1995; Mapfumo et al., Reference Mapfumo, Chikowo, Giller, Mugendi, Kimetu, Palm and Mutuo2001), their inclusion in fertilized cropping sequences, as shown in this study, could increase yields and significantly contribute to protein needs. This could be particularly important for improving diets of the majority of resource-constrained smallholder famers who normally face constraints in accessing other sources of protein such as meat. The high calories and proteins produced under ‘Soya-start’ and ‘Manure-start’ sequences were partly because these sequences did not include sunnhemp, a non-food legume, over the 4-year period. While ‘Litter start’ had a similar cropping pattern, it gave less calories and proteins than manure-based sequences. This result further confirm the importance of cattle manure in enhancing productivity of sandy soils through mechanisms such as alleviation of deficiencies in soil bases and moisture conservation (Mugwira et al., Reference Mugwira, Nyamangara and Hikwa2002; Rusinamhodzi et al., Reference Rusinamhodzi, Corbeels, Zingore, Nyamangara and Giller2013). According to FAO (2009), a family of six people require 3.9 × 10⁶ kcal year−1 to meet household food self-sufficiency. The sequences produced an average of 8 × 10⁶ kcal year−1 indicating that they could enable farmers to produce enough calories to meet household food self-sufficiency and potentially generate surplus. The surplus grain could be used as fall back in poor rainfall seasons given the high incidences of droughts and increased rainfall variability under smallholder farming areas in Zimbabwe (Rurinda et al., Reference Rurinda, Mapfumo, van Wijk, Mtambanengwe, Rufino, Chikowo and Giller2013).
Phosphorus fertilization and crop productivity on sandy soils
Plant available soil P under the sequences increased by up to 4 mg kg−1 over the 4-year period. In a study on similar soils in Zimbabwe, 25 t ha−1 of cattle manure repeatedly applied for 9 years were required to increase plant available soil P by 7 mg kg−1 (Rusinamhodzi et al., Reference Rusinamhodzi, Corbeels, Zingore, Nyamangara and Giller2013). While our study was conducted over a shorter period, our results suggest that seasonal inorganic P fertilization remains the major options for building P on sandy soils. The high loading of cattle manure presents a major challenge, as most smallholder farmers cannot generate sufficient quantities due to low livestock numbers (Mapfumo and Giller, Reference Mapfumo and Giller2001). Cumulatively over the 4-year period, total inorganic P added across the sequences ranged between 71.5 and 78 kg ha−1 against 120 kg (30 kg P ha−1 per season) recommended for similar soils in Zimbabwe (Agronomy Research Institute, 2002). Given that most smallholder farmers often face challenges in accessing inorganic fertilizers to meet the recommended rates, applying the P fertilizer at alternating rates in systematic cropping sequences, as shown in this study, will not only increase crop yields but also build soil P.
The positive relationship between pre-season plant available soil P and maize yields suggests that high maize productivity under sequences was largely supported by increased P supply. For example, ‘Fertilizer-start’, which had the highest amounts of pre-season available P, yielded more maize grain than the other sequences in the fourth year. Positive relationships between available P and maize yields have also been reported in other studies (Janssen, Reference Janssen2011; Tittonell et al., Reference Tittonell, Vanlauwe, Leffelaar, Shepherd and Giller2005). Soyabean grain yields were also higher under sequences compared with unfertilized controls. Phosphorus is known to limit legume productivity under natural and managed systems (Giller and Cadisch, Reference Giller and Cadisch1995; Mapfumo, Reference Mapfumo, Bationo, Waswa, Okeyo, Maina and Mokwunye2011). The high agronomic N and P efficiencies under sequences can as well be attributed to residual effects of P due to repeated seasonal additions (Janssen, Reference Janssen2011). Split application of inorganic N fertilizer could also have increased agronomic efficiencies through improved N uptake by maize (Piha, Reference Piha1993; Vanlauwe et al., Reference Vanlauwe, Kihara, Chivenge, Pypers, Coe and Six2011).
ISFM sequences as a potential pathway for intensification by farmers of different resource endowments
Smallholder farmers often repeatedly apply high quantities of organic nutrient resources to rich fields (Mtambanengwe and Mapfumo, Reference Mtambanengwe and Mapfumo2005; Zingore, Reference Zingore2006). Manure application rates of up to 40 t ha−1 have been reported (Mtambanengwe, Reference Mtambanengwe2006). Crop yields on the rich fields were, however, lower than under sequences where organic nutrient resources were applied once over the 4-year period. These results suggest that there is little crop yield benefit in repeated application of high quantities of organic materials on the same fields without co-addition of adequate inorganic fertilizers, particularly P, to complement the usually low and organically bound nutrients supplied through organic materials. Working on coarse sandy soils, Mapfumo et al. (Reference Mapfumo, Mtambanengwe and Vanlauwe2007) showed that there are no added nutrient benefits in applying organic materials above 10 t ha−1. Besides yielding better calories and proteins than the farmers’ fields, overall NPVs over the 4 years showed that ISFM sequences are more profitable than maize monocropping as commonly practiced by farmers on their rich and poor fields. Working on smallholder farms in Mozambique, Rusinamhodzi et al. (Reference Rusinamhodzi, Corbeels, Nyamangara and Giller2012) also recorded better financial returns under cereal–legume intercrops compared with maize monocropping. Given the high calorie and protein yields, and financial returns under most of the sequences, farmers could realize better returns to seed, fertilizer and labour through systematic allocation of nutrients to fields.
‘Green-start’ and ‘Fertilizer-start’ are potential sequencing options for resource-endowed farmers. With their good resource base, resource-endowed farmers have high capacity to secure inputs on time (Mtambanengwe and Mapfumo, Reference Mtambanengwe and Mapfumo2005). They are therefore better able to absorb any yield penalty from the inclusion of sunnhemp in the cropping sequences. By employing sunnhemp sequences, farmers do not only increase calorie production in the medium–long term but also save on mineral N fertilizer. For example, over the 4-year period, cumulative mineral N fertilizer added in the ‘Green-start’ sequence was 50% lower than under ‘Manure-start’. ‘Soya-start’ and Manure-start’ could best-fit resource-endowed and intermediate farmers since they require relatively high quantities of manure. Through ‘Soya-start’ and Manure-start’, farmers realize both high calorie and protein production and good financial returns. The high NPVs attained under ‘Soya-start’ despite differences in season quality between study sites indicate that such sequences can potentially generate income for smallholder farmers even under variable rainfall conditions. In a related study in Zimbabwe, combined application of cattle manure and mineral fertilizers increased profitability of soyabean–maize rotations (Zingore, Reference Zingore2006). Due to challenges of accessing manure as the majority are non-cattle owners, resource-constrained farmers can practice the ‘Litter-start’ sequence. ‘Litter-start’ gave comparable cumulative calories and proteins to ‘Green-start’ and ‘Fertilizer-start’ in Makoni, indicating that such sequences can significantly contribute to household food needs of resource-constrained farmers. Considering that resource-constrained farmers often fallow some their fields due to lack of resources to hire labour, they could also practice the ‘Green-start’ sequence because of its low mineral N input. However, supporting policies will be required to enhance accessibility of such technologies by the farmer groups. Affordable inorganic fertilizers, ready access to legume seed and farmer training will be key to enable farmers to practice these sequences.
CONCLUSIONS
The different ISFM sequences and crops evaluated in the study can substantially contribute to protein and energy requirements of smallholder farmers, while maintaining use efficiency of the often limited nutrient and labour resources. Systematic fertilization of both the legumes and maize was not only key to achieving better crop yields under sequences compared with farmers’ currently designated rich and poor fields but also resulted in cumulative gains in soil P stocks. Cattle manure-based sequences, (‘Manure-start’ and ‘Soya-start’) produced the highest cumulative calorie and protein yields, while sunnhemp-based (‘Green-start’ and ‘Fertilizer-start’) sequences attained the highest increase in plant available soil P levels. Based on costs of seed, fertilizers and labour, the ISFM sequences used in this study gave better financial returns than the farmers’ designated rich and poor fields that are predominantly monocropped to maize. Sequencing of ISFM options is therefore a potential entry point for intensification of smallholder farms through systematic allocation of the often limited nutrient and labour resources to different fields.
Acknowledgements
The authors thank the Rockefeller Foundation, and the EU-funded ABACO Project for supporting this work through the Soil Fertility Consortium for Southern Africa (SOFECSA). The cooperation received from farmers in Makoni and Hwedza and officers from the Department of Agricultural Extension (AGRITEX) of the Ministry of Agriculture, Mechanization and Irrigation Development, Zimbabwe is also greatly appreciated.