Introduction
Many large carnivore species are facing dramatic decreases in their population because of habitat loss, prey reduction, persecution and other factors (Ripple et al. Reference Ripple, Estes, Beschta, Wilmers, Ritchie, Hebblewhite and Berger2014). These decreases and the consequent trophic cascades are of great concern given their predicted effects at the local, regional and ecosystem levels (Estes et al. Reference Estes, Terborgh, Brashares, Power, Berger, Bond and Carpenter2011). Since human activities are directly or indirectly related to the declines around the world (Ripple et al. Reference Ripple, Estes, Beschta, Wilmers, Ritchie, Hebblewhite and Berger2014), how people process information regarding wildlife plays an essential role in the maintenance of carnivores, and biodiversity conservation in general. From choosing a political candidate to personally killing an animal (i.e., at all level of interactions), humans have an effect on carnivores around the globe. In the field of human dimensions of wildlife, tolerance, defined as the passive acceptance of wildlife that can be expressed in attitudes and behaviours, has become a frequently studied construct (Bruskotter & Wilson Reference Bruskotter and Wilson2014). Although in Brazil jaguars (Panthera onca) have been the focus of attention of most studies on human-wildlife conflict, pumas (Puma concolor) are also involved in these conflicts due to predation on livestock (Marchini & Crawshaw Reference Marchini and Crawshaw2015). However, even in the absence of economic costs associated with their presence, large cats are the carnivores with the highest perceived costs due to fear (Dechner Reference Dechner2020). Thus, given the pumas’ role as top predators in places where jaguars have been extirpated (as in the study area of this research), it is important to determine the factors that affect humans’ tolerance of this large predator, to propose actions that guarantee the human coexistence with this species.
How humans process information about wildlife can be divided into two interconnected systems: the experiential system, which is based on affect and emotion, and the analytic system, which is reason-oriented (Slagle et al. Reference Slagle, Bruskotter and Wilson2012). To date, most of the work on the human dimensions of wildlife has been based on an analytic-oriented cognitive hierarchy (e.g., attitudes, beliefs and norms; Jacobs et al. Reference Jacobs, Fehres and Campbell2012a). For example, a review of tolerance towards large carnivores proposes a hazard-acceptance model, in which two cognitive factors, the perceived costs and benefits, are the major drivers of tolerance towards these species (Bruskotter & Wilson Reference Bruskotter and Wilson2014). This was the case for tigers (Panthera tigris) in Nepal (Carter et al. Reference Carter, Riley and Liu2012) and black bears (Ursus americanus) in the USA (Zajac et al. Reference Zajac, Bruskotter, Wilson and Prange2012). Factors such as control over the hazard, affect (defined as an emotive response to a species), and trust in authorities are considered secondary drivers (Bruskotter & Wilson Reference Bruskotter and Wilson2014). However, there has been increasing focus on the role of human emotions in wildlife conservation and management (Jacobs Reference Jacobs2012, Jacobs et al. Reference Jacobs, Vaske, Dubois and Fehres2014). It has been shown for example, that emotions play a primary role in the support to management of wolves (Canis lupus) (Slagle et al. Reference Slagle, Bruskotter and Wilson2012) and house sparrows (Passer domesticus) (Larson et al. Reference Larson, Cooper and Hauber2016) in the USA, Apennine brown bears (Ursus arctos) and wolves in Italy (Glikman et al. Reference Glikman, Vaske, Bath, Ciucci and Boitani2011), as well as in the risk perception of wolves in the USA (Landon et al. Reference Landon, Jacobs, Miller, Vaske and Williams2019). Furthermore, negative and positive emotions derived from the coexistence with wildlife (reported in some studies as intangible outcomes) are the main drivers of tolerance towards baboons (Papio hamadryas) in South Africa (Kansky et al. Reference Kansky, Kidd and Knight2016) and elephants (Elephas maximus) in Bangladesh (Saif et al. Reference Saif, Kansky, Palash, Kidd and Knight2019). However, not only emotions towards species have an effect on their conservation and management, positive emotions towards ecosystems (e.g., forests), and nature in general, have a significant association with positive attitudes towards large carnivores in Norway (Bjerke & Kaltenborn Reference Bjerke and Kaltenborn1999).
Emotions developed early in human evolutionary history as a response to significant stimuli in order to survive (LeDoux Reference LeDoux2012), however they are not always innate and can be influenced by previous experiences, knowledge, cultural and situational factors (Jacobs Reference Jacobs2009). Although there is no unified definition of emotions, in general terms they are considered to relate to a range of physiological, expressive, behavioural and experiential components (Jacobs et al. Reference Jacobs, Vaske, Dubois and Fehres2014). Affect is another construct of the experiential system (Slagle et al. Reference Slagle, Bruskotter and Wilson2012). Although the distinction between emotion and affect is not completely settled, emotions are usually presented as discrete states (e.g., fear, joy), while affect is usually presented as a negative or positive response to a stimulus (Wieczorek Hudenko Reference Wieczorek Hudenko2012). For practical purposes, in the field of human dimensions of wildlife management and conservation, emotion and affect are terms used mostly interchangeably to refer to experiential components (Wieczorek Hudenko Reference Wieczorek Hudenko2012, Bruskotter & Wilson Reference Bruskotter and Wilson2014, Larson et al. Reference Larson, Cooper and Hauber2016), although the term ‘emotion’ seems to be predominant in the literature.
The analytic (cognitive) and the experiential (emotional) systems are deeply interrelated, as emotions affect virtually all aspects of cognition, for example from beliefs and perceptions to memory formation (Jacobs Reference Jacobs2012). However, determining the respective contribution of these systems to how humans process information about wildlife species is essential to identifying successful management and conservation strategies. Thus, the objectives of this study were: (1) to compare the effect of affective factors (liking forests and pumas) and cognitive factors (perceived costs and benefits) on the tolerance for pumas; (2) to determine the additive effect of the affective and the cognitive factors under an integrative model; and (3) to assess the association between attitudinal tolerance and behavioural tolerance. To my knowledge, no prior study has compared the effect of the perceived costs and benefits (the main drivers of tolerance under the hazard-acceptance model proposed by Bruskotter & Wilson Reference Bruskotter and Wilson2014) with the effect of affective factors on the human tolerance of wildlife. Given that in most parts of the globe, carnivore conservation is partially dependent on the tolerance of human communities towards these species (Treves & Bruskotter Reference Treves and Bruskotter2014), the results presented here provide helpful insights for managers to devise conservation strategies with the aim of increasing tolerance for pumas, and large carnivores in general.
Methods
Study site and description of the communities
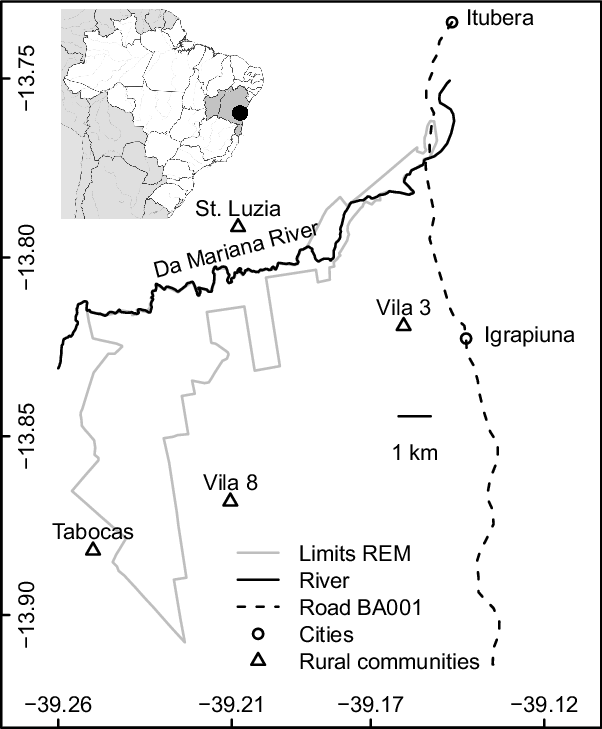
This research was conducted in the South of the state of Bahia, Brazil, between the municipalities of Ituberá and Igrapiúna (39°10’W 13°47’S and 39°13’W 13°54S) (Fig. 1). The study landscape encompasses a 3,386-ha private forest reserve (Reserva Ecológica Michelin [REM]) and tree crop farms. Livestock farming for commercial purposes is not common, and the people who keep animals raise mainly poultry for their own consumption. There are nine human communities (>10 households) settled within 2.5 km of the Reserve boundaries. In 2011 87% of the households had a monthly income of up to two Brazilian minimum salaries (i.e., c. US $400, June 2020). Most inhabitants (67%) had attended some years of, or completed up to, primary school, and 15% were illiterate (Ação Ambiental Reference Ação2011).
Study area and localization of the communities visited in this study. Bahia, Brazil.

Data collection
I conducted 109 semi-structured interviews between January 2013 and April 2014 in four communities located around the REM (Fig. 1). These communities were previously identified as stakeholders by the REM for the purposes of their outreach programme (Ação Ambiental Reference Ação2011). Each of these communities had an average of 34 families (Ação Ambiental Reference Ação2011). If a household consisted of more than one adult, only one participant was selected. Participants were selected by asking who in the household worked or spent the most time in the fields, because of the increased chances of interacting with wildlife. In addition to the people who inhabited these communities, I identified as stakeholders the field workers who lived in the nearby towns but that came to work in the Reserve and in the bordering farms on a daily basis. Given that these workers lived in the nearby towns, most of the interviews were conducted while they were working in the fields or while waiting for transport to their places of residence. Considering the short time available to conduct the interviews, the questionnaire included simple and direct questions. I tested the wording of the questionnaire with members of Ação Ambiental, an organization that has been working on environmental education projects in the area since 2007.
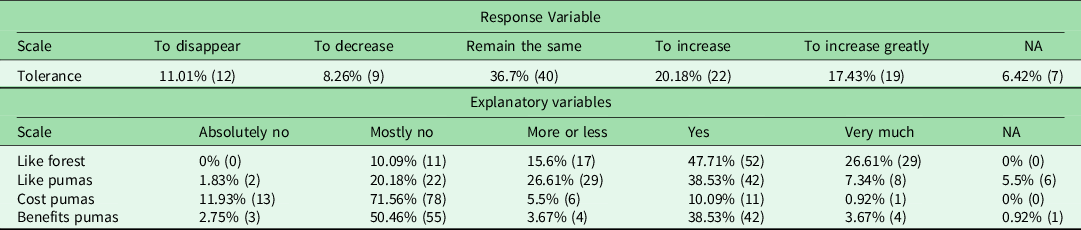
During the interviews, respondents were asked to report gender, place of residence, animal ownership, as well as previous interactions and conflicts with pumas. Given that liking or disliking animals, and nature in general, are direct manifestations of our emotions (Jacobs Reference Jacobs2009), the affective factors were measured by asking participants if they liked pumas and forests. The answers to these questions were registered in a 5-point ordered categorical scale (absolutely no, mostly no, more or less, yes, and very much). The inclusion of a question regarding the affective dispositions towards forests was due, first, to the communities’ association of pumas with the forests in the area, and second, to the fact that previous studies have demonstrated effects of ecocentric/naturalistic-related factors on the conservation of wildlife (Bjerke & Kaltenborn Reference Bjerke and Kaltenborn1999, Engel et al. Reference Engel, Vaske, Bath and Marchini2016, Castilho et al. Reference Castilho, De Vleeschouwer, Milner-Gulland and Schiavetti2018). The cognitive factors (i.e., perceived costs and benefits), related to the presence of pumas were measured by asking the participants if pumas brought negative (prejudicam) and positive outcomes to them. Responses to these questions were registered separately in a 5-point ordered categorical scale (absolutely no, mostly no, more or less, yes, and very much). Tolerance was measured as the preferred future population size of pumas and it was registered in a 5-point ordered categorical scale (to disappear, to decrease, to remain the same, to increase, to increase greatly). This attitudinal measure of tolerance was used in many of the supporting studies for the hazard-acceptance model for large carnivores (Bruskotter & Wilson Reference Bruskotter and Wilson2014). For the statistical analyses, the tolerance variable was rearranged into three groups representing the preferred population size (i.e., less, same and more). ‘I don’t know’ was provided as an option in all questions and was represented in the dataset as NA (Supplementary appendix, available online).
To determine in an exploratory way, the association between attitudinal tolerance (measured as preferred future population size) and behavioural tolerance (measured as behavioural intentions under a hypothetical scenario), participants were asked an open question about what would be their behaviour if they saw a puma in two situations: in the area but far from their homes, and near their homes. I classified their responses into a 3-point ordered categorical scale from behaviours that are intended to negatively impact wildlife, to behaviours that are intended to positively impact wildlife. The resulting categories were specified as: (1) negative, which included the cases where the respondents expressed their intention to kill the animal; (2) neutral, which included the cases where the respondents expressed their intention of not doing anything or protecting themselves (e.g., running, or throwing branches at the animal as scare tactic); and (3) positive, which included the cases where the respondents expressed their intention of protecting the animal (e.g., not making noise or scaring it solely with the intention of protecting it from others, or trying to contact people who they believed could protect it).
Statistical analysis
To determine the effect of the affective and cognitive factors on the tolerance for pumas, I used a set of two cumulative-link models (Agresti Reference Agresti2012) with two explanatory variables each (Table 1). In addition, an integrative (full) model was fit. All statistical analyses mentioned in this section were conducted in R (R Core Team 2019).
Statistical models, variables and inputs.

The affective and cognitive models defined above were then specified as:
 $logit\;{\rm{}}\left( {P\left( {{Y_i} \le j} \right)} \right) = {\theta _j} - {\beta _1}\left( {Variable{1_i}} \right) - {\beta _2}\left( {Variable{2_i}} \right)$
 $i = 1, \ldots ,n,\;{\rm{}}j = 1, \ldots ,J - 1$
where P (Y i ≤ j) is the cumulative probability that the ith response has of falling in the jth tolerance group or below, θ j is the intercept for each of the jth cumulative logits, and β1 and β2 represent the effects of the variables 1 and 2 on the tolerance, respectively. The θ parameters also represent the thresholds or cut-points between tolerance groups. I tested the proportional odds assumption, also called the equal slopes or parallel lines assumption, by examining the likelihood-ratio test between models with parallel and non-parallel lines (Peterson & Harrell Reference Peterson and Harrell1990). For all cases, the tests were non-significant (p ≥ 0.13) indicating no violation of the proportional odds assumption. Thus, the fit models assumed an identical effect of each covariate for each cut-point (i.e., intercepts differed but the slope for each explanatory variable stayed the same). Collinearity among the explanatory variables was tested using the vif function in the package usdm (Naimi Reference Naimi2019). In all cases the variance inflation factors (VIF) were ≤ 1.80, indicating no collinearity in the data. Models were fitted using the R package VGAM (Yee Reference Yee2019).
Models were selected by using the Akaike information criterion for small sample sizes (AICc), with the best models being identified by lower AICc values (Burnham & Anderson Reference Burnham and Anderson2002). To assess the probability of each model being the best given the data, I estimated the Akaike weights (w i ), which are specified as:
 ${w_i} = {{\exp \left( { - 1/2{\rm{\Delta}} _i}} \right)} \over {\mathop \sum \nolimits_{r = 1}^R \exp ( - 1/2{\rm{\Delta}} _r})}}$
where Δ
i is the difference between each model in the set and the best model (
 ${\rm\Delta} _i} = AIC{c_i} - AIC{c_{min}}$
) (Burnham & Anderson Reference Burnham and Anderson2002). To assess the explanatory power of the models, I used a generalized R 2, which is estimated as:
 ${R^2} = 1 - {\rm{exp}}[ - {2 \over n}\{ {\ell _1} - {\ell _0}\} ]$
where
 $\ell _1$
and
 $\ell _0$
are the log-likelihoods of the fitted and the null model, respectively (Nagelkerke Reference Nagelkerke1991). All analyses were conducted with matrices with complete cases.
Finally, in order to assess the relationship between attitudinal tolerance (i.e., preference for less, same and more pumas) and behavioural tolerance (i.e., negative, neutral and positive), I used the Spearman’s rho correlation for each one of two possible scenarios: sighting of an animal near home, and in the area but far from home. Both measures were estimated using the Stats package in R (R Core Team 2019).
Results
Most of the 109 participants were men (90.8%, n = 99) given that women preferred that the men participated in the interviews because according to them, the men knew more about wildlife. Most respondents lived and worked in the rural area (59.6%, n = 65) while the rest only worked in the rural area but lived in the city. Nearly half of the participants had animals (pets and/or livestock) in the rural area (48.6%, n = 53). Although 45.9% (n = 50) of the participants had seen signs or traces believed to be from pumas, sightings of the animal were rare (7.3%, n = 8). None of the interviewees had ever heard of a puma attack on humans in the region, and only 2.8% (n = 3) of the participants had heard about cases of attacks on animals. In all cases, those attacks occurred on animals owned by others in the greater region.
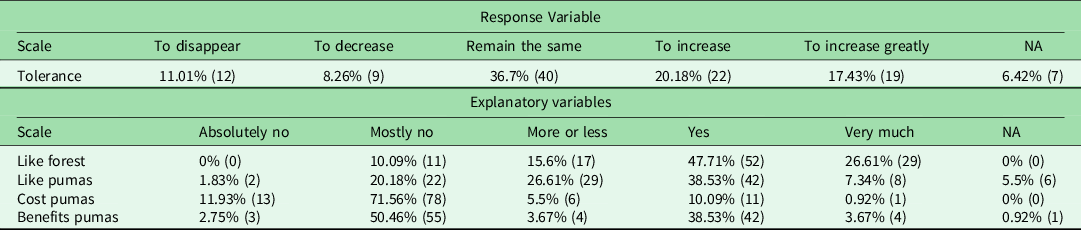
Of the 18 participants who affirmed that pumas brought negative outcomes to them, one did not mention a reason, while the rest mentioned fear and worry about possible attacks, as the only reasons for such perception. Of the 50 participants who affirmed that pumas brought positive outcomes to them, four did not mention a reason; five mentioned tangible benefits such as that the pumas scare thieves away; and 41 mentioned intangible benefits related to naturalistic reasons, such as the possibility of seeing the animal in the wild. Regarding the future population preference for pumas, 36.7% (n = 40) of the participants expressed their desire for the puma population to remain de same, followed by a 20.18% (n = 22) who preferred it to increase (Table 2).
Frequencies and percentages of responses of 109 participants to questions included the tolerance model. For the statistical analyses, the tolerance variable was rearranged into a 3-scale factor (less, same, more) representing the preferred pumas’ population size.
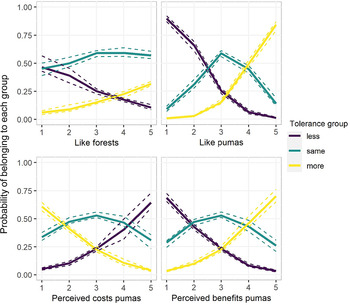
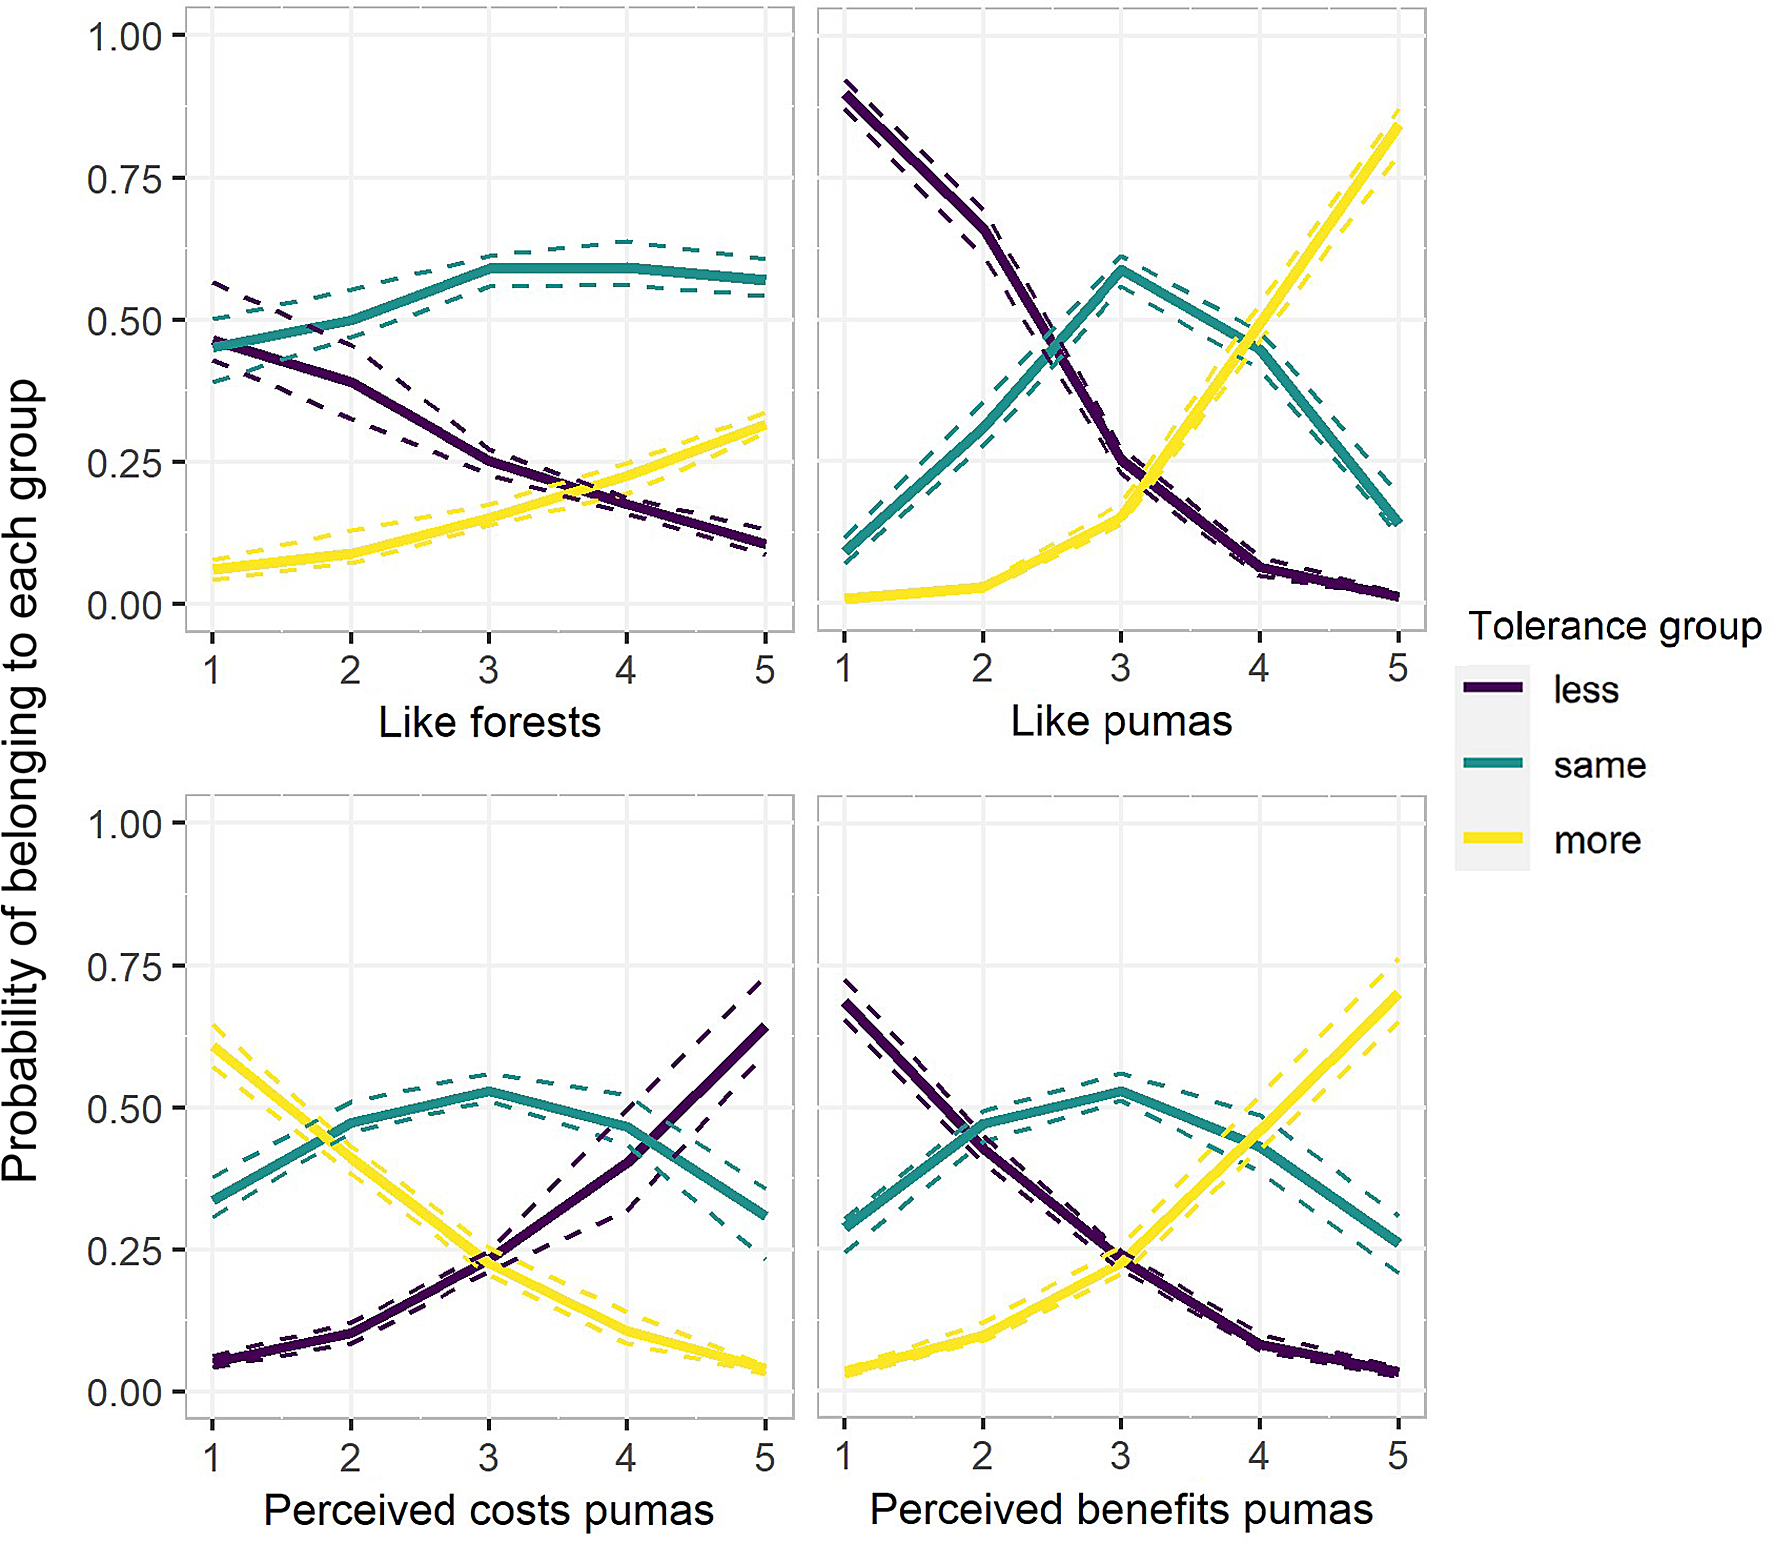
In both the affective and the cognitive models, all factors tested had a significant effect on the tolerance of the species (p ≤ 0.05). However, the affective factors explained a higher proportion of the variability in tolerance of pumas than the cognitive factors (gen. R 2 = 0.44 and gen. R 2 = 0.38, respectively). In addition, according to the Akaike weights, the affective model had a higher probability of being the best model in comparison with the cognitive model (Table 3). Under the affective model, the probabilities of belonging to the groups who preferred more and fewer pumas increased significantly (p ≤ 0.05) as participants expressed liking and disliking forests and pumas, respectively (Fig. 2). Under the full model, liking pumas was the factor with the strongest statistical significance (p = 0.000195), followed by perceived benefits (p = 0.01), perceived costs (p = 0.04) and liking forest (p = 0.1). Morever, the full model explained more than half of the total variability in the tolerance of the species (gen. R 2 = 0.51). The full model, according to the Akaike weights, had 98% probability of being the best model at explaining tolerance given the data and the set of three candidate models (Table 3).
Estimated B coefficients, standard errors, Z-values, Wald p-values, AICc, Delta AICc, Akaike weights and generalized R 2 for each one of the three proportional-odds cumulative logit models fit (n = 97).

Visualization of the effect of the affective and cognitive factors on the probability of belonging to the group that desires fewer, as many and more pumas in a crop-based landscape in Bahia, Brazil. Uncertainty values were obtained from a multinomial distribution.
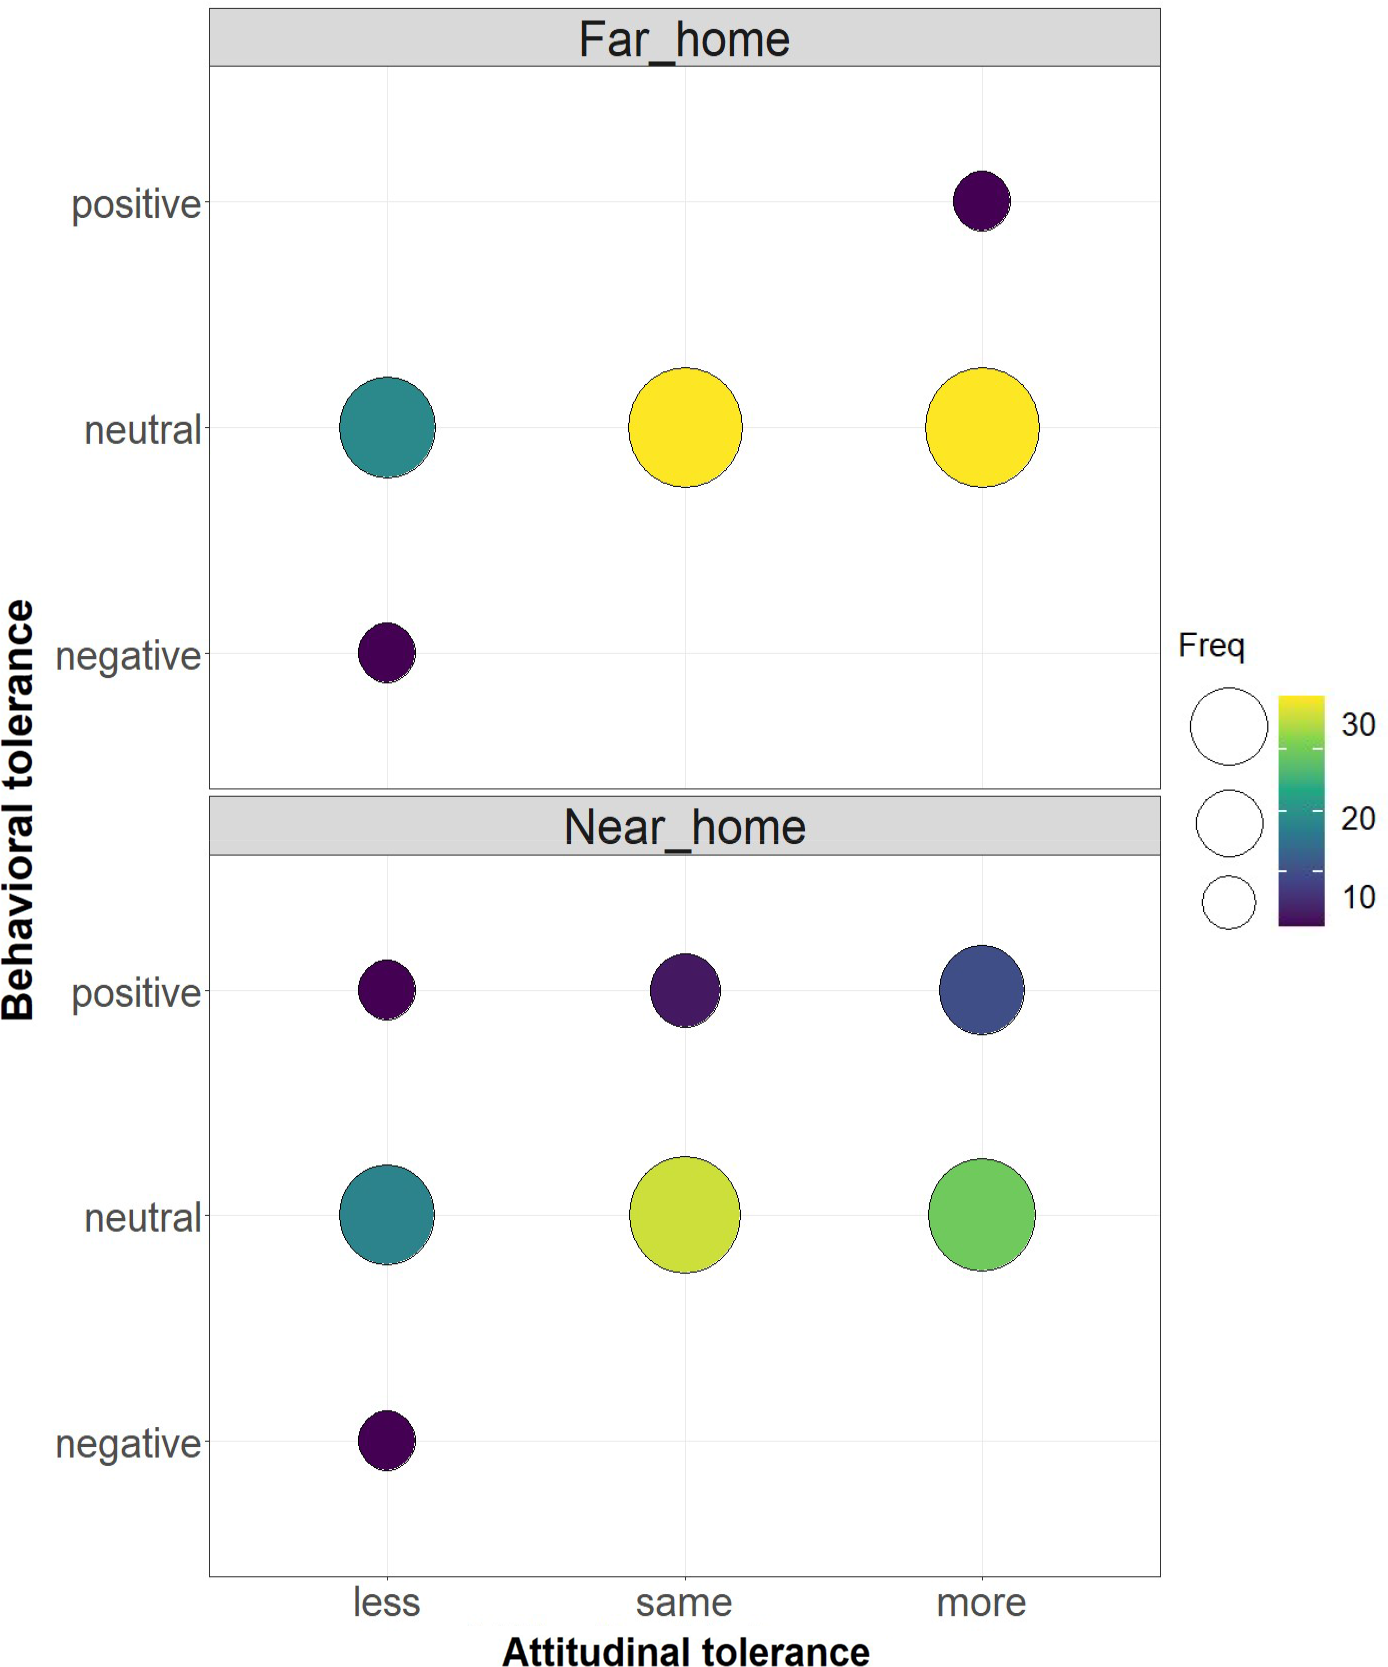
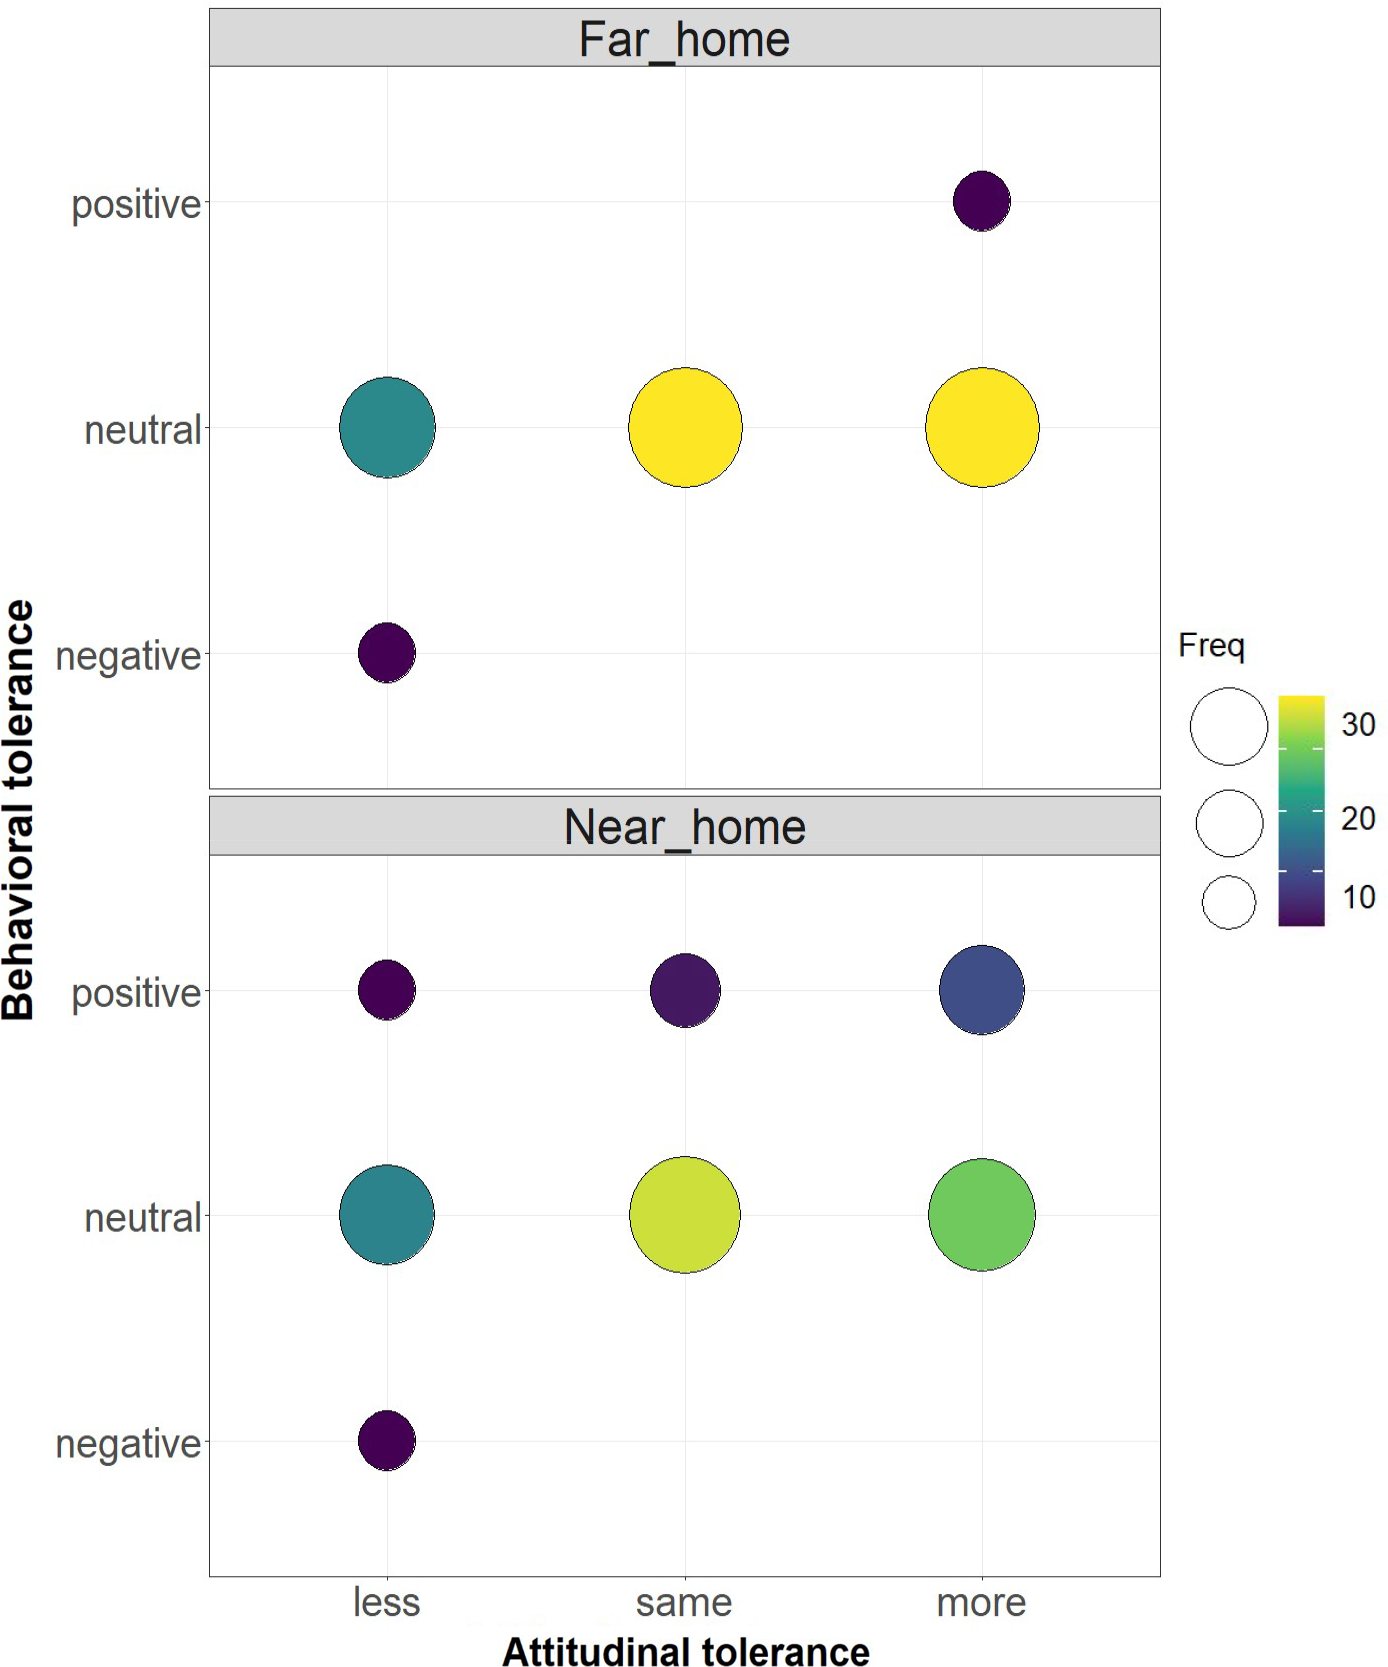
There was a stronger association between attitude and behaviour under a hypothetical scenario of a sighting near the participants’ home (r s = 0.27) than far from the participants’ home (r s = 0.18). A vast majority of the participants (91.74%, n = 100) expressed their intention of engaging in neutral behaviours (i.e., behaviours with no direct positive or negative effect on pumas) under the hypothetical scenario of seeing a puma far from the participants’ home. On the other hand, this percentage decreased to 74.31% (n = 81) if the sighting occurred near the participants’ home as more participants reported concordant behaviours (Fig. 3).
Visualization of the relative magnitude of corresponding components between attitudinal tolerance and behavioural tolerance.
Discussion
That tolerance of pumas was not the result of a purely cognitive analysis of the costs and benefits associated with the species is demonstrated by the affective model explaining a higher amount of the variability in the tolerance towards pumas than the cognitive model. This evidences the importance of the experiential system in understanding people’s relationships with wildlife. My results were consistent with other findings regarding the primary role that emotions and affect play for example, in the support of management of wolves (Canis lupus) (Slagle et al. Reference Slagle, Bruskotter and Wilson2012) and house sparrows (Passer domesticus) (Larson et al. Reference Larson, Cooper and Hauber2016) in the USA, Apennine brown bears (Ursus arctos) and wolves in Italy (Glikman et al. Reference Glikman, Vaske, Bath, Ciucci and Boitani2011), as well as in the risk perception of wolves in the USA (Landon et al. Reference Landon, Jacobs, Miller, Vaske and Williams2019). Moreover, the fact that a full model, containing both affective and cognitive factors, explained most of the total variability in the tolerance of the species, accords with recent studies that have shown the potential of these integrative models to predict the acceptability of wolf management actions in the Netherlands and in Germany (Straka et al. Reference Straka, Miller and Jacobs2019), as well as conservation policy support in Malaysia (Zainal Abidin & Jacobs Reference Zainal Abidin and Jacobs2019).
Likeability of the species had the strongest effect on the tolerance under the affective and the full models. The reasons why humans like animals include an innate emotional affiliation with all living things, or biophilia (Vining Reference Vining2003), an innate sensitivity to biological movement, and an inherent ability to recognize similarities in the emotional expressions across species (Jacobs Reference Jacobs2009). However, the reasons why humans like or dislike animals are not only innate, and can be influenced by previous experiences, knowledge, cultural and situational factors (Jacobs Reference Jacobs2009, Jacobs et al. Reference Jacobs, Vaske and Roemer2012b, Larson et al. Reference Larson, Cooper and Hauber2016). Likeability of forests (used in here as a proxy for biophilia) had a higher statistical significance under the affective model (p = 0.05) than under the full model (p = 0.1). Likeability of forests may thus not be as strong when compared with the other factors included in the full model (e.g., perceived costs and benefits). These results were surprizing given that participants identified the forests in the area as the habitat of pumas, and because previous studies have demonstrated the effects of ecocentric/naturalistic values on the conservation of wildlife (Bjerke & Kaltenborn Reference Bjerke and Kaltenborn1999, Engel et al. Reference Engel, Vaske, Bath and Marchini2016, Castilho et al. Reference Castilho, De Vleeschouwer, Milner-Gulland and Schiavetti2018). However, the weaker effect of likeability of forests in comparison with perceived costs and benefits of pumas may be due to the fact that the perceived benefits and costs were mostly related to intangible reasons, which compared with tangible factors have been shown to be stronger predictors of the tolerance of wildlife (Kansky et al. Reference Kansky, Kidd and Knight2016, Saif et al. Reference Saif, Kansky, Palash, Kidd and Knight2019). Most reported benefits were related to naturalistic factors (e.g., participants enjoyed the possibility of seeing the animal), and all reported costs were related to fear (or worry) of an attack. The stronger effect of perceived benefits in comparison with perceived costs was expected because of the distinct contribution of perceived benefits to tolerance of tigers (Carter et al. Reference Carter, Riley and Liu2012) and black bears (Slagle et al. Reference Slagle, Zajac, Bruskotter, Wilson and Prange2013, Lischka et al. Reference Lischka, Teel, Johnson and Crooks2019), and in the support to wolf management (Slagle et al. Reference Slagle, Bruskotter and Wilson2012).
Regarding the association between attitudinal and behavioural tolerance, my results suggest that there is a trend for people’s behavioural tolerance to be more consistent with their attitudinal tolerance in a familiar location than in a non-familiar location. This variability in the association between attitude and behaviour under spatially different scenarios can be explained by an increased sense of control in settings that are characterized by personal involvement (Thompson Reference Thompson1999). The lack of a stronger association between the two measurements of tolerance may be due to the limited number of hypothetical scenarios used. Thus, although most participants did not express their intention to personally kill an animal, and in fact most participants expressed a neutral behavioural intention, it does not necessarily mean that they do not support another person doing it. This is particularly true when many external factors may impede people from killing an animal personally (Bruskotter et al. Reference Bruskotter, Singh, Fulton and Slagle2015). In addition, misreporting is always possible in these situations especially considering that killing wildlife species in Brazil in considered illegal.
This research highlights the value of cumulative probability models in the analysis of categorical ordinal data. Although categorical ordinal data can be analyzed as continuous data by assigning numbers to the categories, this presumes that the data contain more information than it does (Christensen Reference Christensen2015, Bürkner & Vuorre Reference Bürkner and Vuorre2019). First, statistical methods designed for continuous data assume an equal distance between values (i.e., that the distance between 1 and 2, and 2 and 3 is the same), however, in the case of categorical ordinal data the distance, for example, between slightly and moderately agree, and between moderately and strongly agree is unknown (Agresti Reference Agresti2012, Liddell & Kruschke Reference Liddell and Kruschke2018). Second, given that categorical ordinal data do not contain values beyond the lowest and highest category, the assumption of normality that many statistical methods require, cannot be made (Christensen Reference Christensen2015, Bürkner & Vuorre Reference Bürkner and Vuorre2019). Thus, implementing models intended for continuous data by assigning numbers to ordinal categories may lead to biased effect-size estimates, inflated error rates, among other problems (Liddell & Kruschke Reference Liddell and Kruschke2018). Therefore, the suitability of cumulative probability models for the analysis of categorical ordinal data is due to their capability of treating the response variable as it is, categorical and not continuous, while taking advantage of its ordinal character (i.e., increased magnitude) (Christensen Reference Christensen2019).
In contrast with methods such as structural equation models (SEMs), cumulative probability models have been rarely used in studies of human dimensions of wildlife conservation and management. The frequent use of SEMs is due to their capacity to assess unobservable (latent) constructs and the links between them (Johansson et al. Reference Johansson, Karlsson, Pedersen and Flykt2012, Slagle et al. Reference Slagle, Bruskotter and Wilson2012). However, the applicability of SEMs requires in most cases large samples sizes for achieving adequate statistical power (Fritz & Mackinnon Reference Fritz and Mackinnon2007, Wolf et al. Reference Wolf, Harrington, Clark and Miller2013). Thus, cumulative probability models are also useful in cases such as the present study, where the communities and thus the sample sizes were not large enough to use SEM, which may require several hundreds of observations (Wolf et al. Reference Wolf, Harrington, Clark and Miller2013).
This study has several limitations that constrain the inferences that can be made from it, including the small sample size, the measure of attitudinal tolerance as a single item, the limited scenarios tested to determine the association between attitudinal tolerance and behavioural tolerance, and the fact that in the studied landscape interactions with pumas were rare. Thus, the results obtained here may differ from those obtained in landscapes in which interactions with pumas are common, and the tangible and intangible outcomes more complex (e.g., cattle grazing areas). Future studies on the human dimensions of wildlife conservation and management should focus on the relationship between attitudinal tolerance and behavioural tolerance and its context-specificity (e.g., location-dependent). In addition, given that the affect has a strong effect on people’s perceptions of risks and benefits of wild species (Finucane et al. Reference Finucane, Alhakami, Slovic and Johnson2000, Slagle et al. Reference Slagle, Bruskotter and Wilson2012, Landon et al. Reference Landon, Jacobs, Miller, Vaske and Williams2019), the relationship between cognitive and emotional factors should be explored more deeply. Although in the present study the associations between likeability of pumas, and the perceived costs and benefits of the species were not great enough to cause collinearity (r = −0.44 and 0.62, respectively), in different scenarios the degree of these associations may be greater (e.g., disliking the species may be highly correlated with perceiving a cost); thus it may become difficult to distinguish the direct effect of affective factors from the direct effect of cognitive factors on the tolerance of wildlife. In addition, future research should focus on implementing models that integrate cognitive and emotional factors, not only to evaluate the predictive potential of these models, but to assess the varying contribution of the emotional and cognitive components under different scenarios, as well as to determine the practical implications of these findings.
Considering that previous studies have demonstrated the critical role of communicating the benefits of the species in increasing the tolerance of carnivores, strategies for pumas should focus then not only on the risks (and how to decrease them) but on communicating the benefits associated with the species (Slagle et al. Reference Slagle, Zajac, Bruskotter, Wilson and Prange2013, Bruskotter & Wilson Reference Bruskotter and Wilson2014). From the emotional perspective, proven strategies for reducing fear of carnivores include education, direct contact and public participation in management actions (Johansson et al. Reference Johansson, Ferreira, Støen, Frank and Flykt2016a, Johansson et al. Reference Johansson, Frank, Støen and Flykt2016b, Johansson et al. Reference Johansson, Flykt, Frank and Støen2019). Although liking or disliking an animal is just one aspect of the experiential component of the emotional system (Jacobs Reference Jacobs2009), the present results show that it is important. Thus, a challenge remains in terms of what strategies to adopt to increase the likeability of a species. This is even truer considering the complexity behind why humans like or dislike animals. Conservation strategies require integrative approaches that consider both the role of emotion and cognition in how people judge, behave, and take decisions regarding wildlife.
Supplementary material
To view supplementary material for this article, please visit https://doi.org/10.1017/S0376892920000533
Acknowledgements
I thank Michelin and the Michelin personnel for financial and logistical support, and Brian A. Maurer for comments on the analyses of an earlier version of the paper. Ronaldo Carvalho, and Monica and Tarcisio Botelho, are thanked for their comments on the questionnaire, as are Kevin Flesher, Monica, Tarcisio, o Sr Gil, and Jose Carlos for their company during the visits to the communities. Special thanks to all the people who participated in this study. I am grateful to the editor and the anonymous reviewers who made valuable comments that improved the manuscript.
Financial support
This work was supported by a grant from Michelin, Bahia, Brazil. The funder had no role in the study design, data collection, analysis, interpretation of data, decision to publish or preparation of the manuscript.
Conflict of interest
None
Ethical standards
Interviews were conducted following a protocol approved by the Institutional Review Boards (IRBs) of Michigan State University under the IRB#: X09-465. In addition, I collected the data with approval of the Brazilian government under the CNPq permit # 001308/2012-2.