1. Introduction
Volatility is one of the most important statistical measures reflecting the real movement of securities and market indices. It represents the dispersion of returns for a given security or market index. A higher volatility implies that an asset's value can potentially be spread out over a larger range of values so that the asset price can change dramatically over a short time period in either direction. Assets with higher volatility are considered as the ones with higher risk because the price is expected to be less predictable. So, volatility is a key financial market factor when pricing derivatives like option contracts.
Volatility is governed by several state variables like the asset price level, the mean reversion (the tendency to revert to some long-run mean value) of the volatility and the variance of the volatility itself, among others. So, models whose volatility is not affected by those variables should have limitations for pricing derivatives. Stochastic or local volatility models are one possible way of resolving the shortcoming of the Black–Scholes model [Reference Black and Scholes2] which assumes a constant volatility. The constant elasticity of variance (CEV) model, the Heston model and the SABR model, developed by Cox and Ross [Reference Cox and Ross3], Heston [Reference Heston9] and Hagan et al. [Reference Hagan, Kumar, Lesniewski and Woodward8], respectively, are the most popular local or (pure) stochastic volatility models which are widely used by scholars or practitioners. Since these models have been introduced, several types of extension of the models have been developed to capture more realistic volatility structure, such as volatility smile and skew in derivative markets. Refer to Gatheral [Reference Gatheral7] for a general discussion on it.
Since the volatility moves freely in ever-changing market conditions and its characteristics have a variety of behaviors, it is necessary to introduce multi-factor stochastic volatility models in many cases. Among those multi-factor models, there is a so-called double-mean-reverting (DMR) model. This is a three-factor stochastic volatility model, developed by Gatheral [Reference Gatheral6], which is well-known to reflect the empirical dynamics of the variance and prices of options on both S&P 500 Index (SPX) and volatility index (VIX) consistently with the market. Here, SPX stands for the Standard and Poor's 500 (simply, the S&P 500) Index which is a stock market index of the 500 leading companies listed on stock exchanges in the United States. VIX is the commonly used name for the Chicago Board Options Exchange (CBOE)'s Volatility Index which is the most recognized measure of the stock market's expectation of volatility, calculated by SPX call and put option prices.
The DMR model can illustrate the required complex characteristics of volatility but it may be somewhat slow when calibrating the model to actual market data due to the absence of a closed-form solution. So, the DMR model has been modified by Huh et al. [Reference Huh, Jeon and Kim10] to study the pricing of VIX derivatives. They have obtained a closed-form pricing formula for the VIX derivatives. We adopt the modified model in this paper to derive a closed-form analytic formula for pricing European options. The formula obtained in this paper has no integral term. It is explicitly expressed by the functions that can be calculated easily and quickly. Also, we note that our model is a more general version than the model of [Reference Huh, Jeon and Kim10] in that the long-run mean of the volatility is given by a more general process, which is closer to the original DMR model, than the CIR process of [Reference Huh, Jeon and Kim10]. We show that faster calibration of the DMR model is available and yet the practical implied volatility structure of SPX options can be produced.
In the remainder of this paper, we first describe the rescaled DMR model considered in this paper in Section 2. In Section 3, we obtain a closed-form formula of the European call option prices. In Section 4, we use the option pricing result to derive an implied volatility formula. In Section 5, we check if the implied volatility formula is suitable for the actual market by calibrating the model to real market data (SPX options). We also look at the impact of each parameter of the formula on the implied volatility structure. Section 6 concludes.
2. Model formulation
In this paper, we describe the three-factor DMR model with required conditions and then a rescaled version of the model, which is denoted by the SDMR model.
2.1. The double-mean-reverting model
The DMR model of Gatheral [Reference Gatheral6] has the following dynamics for the underlying price  $X_t$ with zero interest rate.
 $$\left\{\begin{array}{l} dX_t=\sqrt{Y_t}X_t \,dW_t^{x},\\ dY_t=\kappa_1 (Z_t - Y_t) \,dt + \sigma_1 Y_t^{\alpha} \,dW_t^{y},\\ dZ_t=\kappa_2 (\theta - Z_t) \,dt + \sigma_2 Z_t^{\beta} \,dW_t^{z}, \end{array}\right.$$
where  $W_t^{x}$,
 $W_t^{y}$ and
 $W_t^{z}$ are standard Brownian motions with a correlation structure given by
 $dW_t^{x} \,dW_t^{y} = \rho _{xy} \,dt$,
 $dW_t^{y} \,dW_t^{z} = \rho _{yz} \,dt$ and
 $dW_t^{z} \,dW_t^{x} = \rho _{zx} \,dt$ and
 $\kappa _1$,
 $\kappa _2$,
 $\sigma _1$,
 $\sigma _2$,
 $\alpha$ and
 $\beta$ are all constants. The process
 $Y_t$ represents the variance of the underlying return, where
 $\kappa _1$ and
 $\sigma _1$ denote the mean reversion rate and the volatility coefficient of the volatility, respectively. The process
 $Z_t$ expresses the long-term mean level of the volatility, where
 $\kappa _2$ and
 $\sigma _2$ correspond to the mean reversion rate and the volatility coefficient of the long-term mean level, respectively. The correlation coefficients are assumed to satisfy
 $\rho _{xy}^{2} < 1$,
 $\rho _{yz}^{2} < 1$,
 $\rho _{zx}^{2} < 1$ and
 $\rho _{xy}^{2} + \rho _{yz}^{2} + \rho _{zx}^{2} - 2 \rho _{xy} \rho _{yz} \rho _{zx} < 1$, which ensure the positive definiteness of the covariance matrix of
 $W_t^{x}$,
 $W_t^{y}$ and
 $W_t^{z}$.
2.2. The rescaled double-mean-reverting model
The DMR model described above can capture the empirical dynamics of the variance well but calibration of the model to market data may not be easy as no closed-form formula for European option prices exists. To improve the slow calibration, we use the SDMR model of Huh et al. [Reference Huh, Jeon and Kim10]. In this model, the mean reversion rate  $\kappa _1$ of the variance in the DMR model is assumed to be much bigger than the mean reversion rate
 $\kappa _2$ of the long-term mean level, which is consistent with Bayer and Gatheral [Reference Bayer, Gatheral and Karlsmark1]. In Huh et al. [Reference Huh, Jeon and Kim10], the long-run mean level of the variance is specified by the CIR process, i.e.,
 $\beta =1/2$ below, but there is no such restriction on our model as expressed by
 $$\left\{\begin{array}{l} dX_t=\sqrt{Y_t}X_t \,dW_t^{x},\\ dY_t=\dfrac{1}{\epsilon} (Z_t - Y_t) \,dt + \dfrac{\nu\sqrt{2}}{\sqrt{\epsilon}} Y_t^{\alpha} \,dW_t^{y},\\ dZ_t=\delta(\theta - Z_t) \,dt + \sqrt{\delta} Z_t^{\beta} \,dW_t^{z}, \end{array}\right.$$
with  $dW_t^{x} \,dW_t^{y} = \rho _1 \,dt$ and
 $dW_t^{x} \,dW_t^{z} = \rho _2 \,dt$ satisfying
 $\rho _1^{2} < 1$,
 $\rho _2^{2} < 1$ and
 $\rho _1^{2} + \rho _2^{2} - 2 \rho _1 \rho _2 < 1$. This has a similar structure to the DMR model but it has fast and slow mean reversion rates by letting
 $\epsilon$ and
 $\delta$ be small positive numbers. Here,
 $\nu$ is a positive constant and
 $\sqrt {2}$ is just given for the simplicity of calculation.
The model described above still holds the important advantages of the original DMR model. We will prove that it retains important characteristics of volatility observed in real market and yet option prices can be given by a closed-form formula, which leads to fast calibration of the SDMR model than that of the DMR model.
3. Pricing European options
From now on, we consider a European call option with strike  $K$ at maturity
 $T$ whose payoff is given by
 $h(x)=(x-K)^{+}$. Since
 $X_t$,
 $Y_t$ and
 $Z_t$ have the Markov property, the option price at
 $t < T$ can be defined by
 $$P^{\epsilon,\delta}(t,x,y,z)=E^{Q} [h(X_T) \mid X_t=x, Y_t=y, Z_t=z]$$
for an expectation  $E^{Q}$ under a risk-neutral probability measure
 $Q$. For the calculation of the expectation (integral), one can use the asymptotic analysis of Fouque et al. [Reference Fouque, Papanicolaou, Sircar and Sølna4] under the assumption that
 $\epsilon$ is a small positive parameter, meaning that the volatility reverts fast to the long-term mean.
So, first, we change the integral to a partial differential equation (PDE) problem. By the Feynman–Kac theorem (cf. [Reference Øksendal11]),  $P^{\epsilon ,\delta }$ satisfies
 $$\mathcal{L} P^{\epsilon,\delta}(t,x,y,z) = 0,$$
where  $\mathcal {L}$ is a differential operator given by
 \begin{align*} \mathcal{L} & = \frac{\partial}{\partial t} + \frac{1}{\epsilon} (z-y)\frac{\partial}{\partial y} +\delta(\theta-z)\frac{\partial}{\partial z} + \frac{1}{2} y x^{2} \frac{\partial^{2}}{\partial x^{2}} + \frac{\nu ^{2}}{\epsilon} y^{2\alpha} \frac{\partial^{2}}{\partial y^{2}}\\ & \quad + \frac{1}{2} \delta z^{2\beta} \frac{\partial^{2}}{\partial z^{2}} + \rho_1 \frac{\nu \sqrt{2}}{\sqrt{\epsilon}} x y^{\alpha + {1}/{2}} \frac{\partial ^{2}}{\partial x \partial y} +\rho_2 \sqrt{\delta} x y^{{1}/{2}}z^{\beta} \frac{\partial ^{2}}{\partial x \partial z}. \end{align*}
We are interested in an asymptotic expansion given in terms of  ${\sqrt {\delta }}^{j}$ for integer
 $j$ which is expressed by
 $$P^{\epsilon,\delta} = P^{\epsilon,0} + \sqrt{\delta} P^{\epsilon,1} + \delta P^{\epsilon,2} + \delta \sqrt{\delta} P^{\epsilon,3} + \cdots$$
with the terminal conditions  $P^{\epsilon ,0}(T,x,y,z)=h(x)$ and
 $P^{\epsilon ,j}(T,x,y,z)=0$ for
 $j>0$. So, it is convenient to decompose the operator
 $\mathcal {L}$ as
 $$\mathcal{L} = \frac{1}{\epsilon}\mathcal{L}_0 + \frac{1}{\sqrt{\epsilon}} \mathcal{L}_1 + \mathcal{L}_2 + \sqrt{\delta} \mathcal{M}_1 + \delta \mathcal{M}_2,$$
where
 \begin{align*} \mathcal{L}_0 & = (z-y)\frac{\partial}{\partial y} + \nu^{2} y^{2\alpha} \frac{\partial^{2}}{\partial y^{2}},\\ \mathcal{L}_1 & = \rho_1 \nu \sqrt{2} x y^{\alpha + {1}/{2}} \frac{\partial ^{2}}{\partial x \partial y},\\ \mathcal{L}_2 & = \frac{\partial}{\partial t} +\frac{1}{2}y x^{2} \frac{\partial^{2}}{\partial x^{2}},\\ \mathcal{M}_1 & = \rho_2 x y^{{1}/{2}}z^{\beta} \frac{\partial ^{2}}{\partial x \partial z},\\ \mathcal{M}_2 & = (\theta-z)\frac{\partial}{\partial z} + \frac{1}{2} z^{2\beta} \frac{\partial^{2}}{\partial z^{2}}. \end{align*}
Then we have
 \begin{align} \left(\frac{1}{\epsilon} \mathcal{L}_0 + \frac{1}{\sqrt{\epsilon}} \mathcal{L}_1 + \mathcal{L}_2\right) P^{\epsilon,0} & = 0, \end{align}
 \begin{align} \left(\frac{1}{\epsilon} \mathcal{L}_0 + \frac{1}{\sqrt{\epsilon}} \mathcal{L}_1 + \mathcal{L}_2\right) P^{\epsilon,1} & ={-}\mathcal{M}_1 P^{\epsilon,0}, \end{align}
 \begin{align} \left(\frac{1}{\epsilon} \mathcal{L}_0 + \frac{1}{\sqrt{\epsilon}} \mathcal{L}_1 + \mathcal{L}_2\right) P^{\epsilon,2} & ={-}\mathcal{M}_1 P^{\epsilon,1} - \mathcal{M}_2 P^{\epsilon,0}, \end{align}
which are going to be solved for the European call option price in the following subsections.
In the following analysis, we use the probability density function  $\Phi (y)$ of the invariant distribution of
 $Y_t$ to define notation
 $\langle \cdot \rangle$ given by
 $$\langle g\rangle := \int g(y) \Phi(y) \,dy$$
for any integrable function  $g$. One of the powerful tools to be used is the Fredholm theorem (cf. [Reference Ramm12]). It implies that the existence of solutions to
 $\mathcal {L}_0 u + g=0$ requires
 $\langle g\rangle =0$ (the centering condition). In the following argument, we assume that every term
 $P^{i,j}$ does not grow exponentially in
 $y$ (the growth condition).
3.1.  $P^{0,0}$ and $P^{1,0}$ terms


Using (3.0.1) and the following expansion in terms of  ${\sqrt {\epsilon }}^{i}$ for integer
 $i$
 $$P^{\epsilon,0} = P^{0,0} + \sqrt{\epsilon}P^{1,0} + \epsilon P^{2,0} + \epsilon \sqrt{\epsilon}P^{3,0} + \cdots,$$
where  $P^{0,0}(T,x,y,z)=h(x)$ and
 $P^{i,0}=0$ for
 $i>0$, we obtain
 \begin{align} \mathcal{L}_0 P^{0,0} & = 0, \end{align}
 \begin{align} \mathcal{L}_1 P^{0,0} + \mathcal{L}_0 P^{1,0} & = 0, \end{align}
 \begin{align} \mathcal{L}_2 P^{0,0} + \mathcal{L}_1 P^{1,0} + \mathcal{L}_0 P^{2,0} & = 0, \end{align}
 \begin{align} \mathcal{L}_2 P^{1,0} + \mathcal{L}_1 P^{2,0} + \mathcal{L}_0 P^{3,0} & = 0, \end{align}
 \begin{align} \mathcal{L}_2 P^{2,0} + \mathcal{L}_1 P^{3,0} + \mathcal{L}_0 P^{4,0} & = 0. \end{align}
From (3.1.1) and (3.1.2), one can easily check that  $P^{0,0}$ and
 $P^{1,0}$ are independent of
 $y$. Using the fact that
 $\langle I\rangle =z$ holds for the identity function
 $I(y)=y$ (
 $z$ is the long-term mean of the mean-reverting process
 $Y_t$), we define the operator
 $\mathcal {L}_{\textrm {bs}}$ as
 $$\langle \mathcal{L}_2 u\rangle = \left(\frac{\partial}{\partial t} + \frac{1}{2} z x^{2} \frac{\partial^{2}}{\partial x^{2}}\right) u := \mathcal{L}_{\textrm{bs}} u$$
for any reasonably smooth function  $u$. Note that the operator
 $\mathcal {L}_{\textrm {bs}}$ is the same as the Black–Scholes operator with zero interest rate and constant volatility replaced by
 $\sqrt {z}$. From (3.1.3) and (3.1.4), the centering condition gives
 \begin{align*} \mathcal{L}_{\textrm{bs}} P^{0,0} & = 0, \\ \langle \mathcal{L}_2 P^{1,0} + \mathcal{L}_1 P^{2,0}\rangle & = 0. \end{align*}
So, we get a PDE problem for  $P^{0,0}$ as follows.
 \begin{align} \mathcal{L}_{\textrm{bs}}P^{0,0}(t,x,z) & = 0, \quad t< T, \end{align}
 \begin{align} P^{0,0}(T,x,z) & = (x-K)^{+}. \end{align}
The following proposition provides a solution of this problem.
Proposition 3.1  $P^{0,0}(t,x,z)$, the solution of the PDE (3.1.6) with terminal condition (3.1.7), is given by
 $$P^{0,0}(t,x,z) = x\mathcal{N}(d_1) - K\mathcal{N}(d_2),$$
where  $\mathcal {N}(\cdot )$ is the standard normal cumulative distribution function and
 $$d_{1,2} = \frac{1}{\sqrt{z(T-t)}} \left\{ \log{\frac{x}{K}} \pm \frac{1}{2} z(T-t) \right\}.$$
Proof. Let  $P_{\textrm {BS}}(t,x;K,T;\sigma )$ be the usual Black–Scholes price at time
 $t< T$ of a European call option with maturity
 $T$ and volatility
 $\sigma$. Then
 $P_{\textrm {BS}}(t,x;K,T;\sigma )$ is already known as
 $$P_{\textrm{BS}}(t,x;K,T;\sigma) = x\mathcal{N}(\bar{d}_1) - K\mathcal{N}(\bar{d}_2),$$
where  $\mathcal {N}(\cdot )$ is the standard normal cumulative distribution function and
 $$\bar{d}_{1,2} = \frac{1}{\sigma \sqrt{(T-t)}} \left\{ \log{\frac{x}{K}} \pm \frac{1}{2} \sigma^{2} (T-t) \right\}.$$
Since the operator  $\mathcal {L}_{\textrm {bs}}$ is the Black–Scholes operator with constant volatility
 $\sigma$ replaced by
 $\sqrt {z}$, the desired solution
 $P^{0,0}$ is
 $$P^{0,0}(t,x,z)=P_{\textrm{BS}}(t,x;K,T;\sqrt{z})$$
and the proposition follows.
Considering (3.1.3) and (3.1.5),  $P^{2,0}$ is given by the form
 $$P^{2,0} ={-}\mathcal{L}_0^{{-}1} \frac{1}{2} (y-z)x^{2} \frac{\partial^{2}}{\partial x^{2}} P^{0,0} + F(t,x,z)$$
for some  $y$-independent function
 $F(t,x,z)$. So, if
 $\phi (y,z)$ is the solution of
 $$\mathcal{L}_0 \phi(y,z) = y-z,$$
then
 \begin{equation} P^{2,0} ={-}\frac{1}{2} \phi(y,z) x^{2} \frac{\partial^{2}}{\partial x^{2}} P^{0,0} + F(t,x,z) \end{equation}
gives us a PDE problem for  $P^{1,0}$ as follows.
 \begin{align} \mathcal{L}_{\textrm{bs}} P^{1,0}(t,x,z) & = H_0 (t,x,z), \end{align}
 \begin{align} P^{1,0}(T,x,z) & = 0, \end{align}
where  $H_0$ is given in the following proposition. Then the following proposition provide an explicit solution for
 $P^{1,0}$.
Proposition 3.2  $P^{1,0}$, the solution of (3.1.9) with (3.1.10), is given by
 \begin{equation} P^{1,0}(t,x,z) ={-}(T-t)H_0(t,x,z), \end{equation}
where  $H_0$ is
 \begin{align*} H_0(t,x,z) & = 2 V_0 x^{2} \frac{\partial ^{2}}{\partial x^{2}} P^{0,0}(t,x,z) + V_0 x^{3} \frac{\partial^{3}}{\partial x^{3}} P^{0,0}(t,x,z),\\ V_0 & = \frac{1}{\sqrt{2}} \rho_1 \nu \left\langle y^{\alpha + {1}/{2}} \frac{\partial}{\partial y} \phi (y,z)\right\rangle . \end{align*}
Proof. One can easily check that the following identity holds between the operator  $\mathcal {L}_{\textrm {bs}}$ and the derivative with respect to
 $x$.
 $$\mathcal{L}_{\textrm{bs}} x^{n} \frac{\partial ^{n}}{\partial x^{n}} P^{0,0} = x^{n} \frac{\partial ^{n}}{\partial x^{n}} \mathcal{L}_{\textrm{bs}} P^{0,0},$$
Using this equality, a simple calculation says
 \begin{align*} & \mathcal{L}_{\textrm{bs}} (-(T-t)H_0(t,x,z)) \\ & \quad = H_0(t,x,z) - (T-t)\left(\frac{\partial}{\partial t} + \frac{1}{2} z x^{2} \frac{\partial^{2}}{\partial x^{2}}\right)H_0(t,x,z)\\ & \quad = H_0(t,x,z). \end{align*}
So,  $P^{1,0}(t,x,z) = -(T-t)H_0(t,x,z)$ is the solution of the PDE (3.1.9).
We define  $\bar {P}^{1,0}:=\sqrt {\epsilon }P^{1,0}$. Then from (3.1.11)
 $\bar {P}^{1,0}$ is given by
 $$\bar{P}^{1,0}(t,x,z) ={-}(T-t)\bar{H}_0(t,x,z),$$
where  $\bar {H}_0$ is
 \begin{align*} \bar{H}_0(t,x,z) & = 2 \bar{V}_0 x^{2} \frac{\partial ^{2}}{\partial x^{2}} P^{0,0}(t,x,z) + \bar{V}_0 x^{3} \frac{\partial ^{3}}{\partial x^{3}} P^{0,0}(t,x,z),\\ \bar{V}_0 & := \sqrt{\epsilon} V_0. \end{align*}
In the following section, we find the solutions  $P^{0,1}$ and
 $P^{1,1}$ by using the same technique as used for
 $P^{0,0}(t,x,z)$ and
 $P^{0,1}(t,x,z)$.
3.2. $P^{0,1}$ and $P^{1,1}$ terms


From (3.0.2) and the following expansion
 $$P^{\epsilon,1} = P^{0,1} + \sqrt{\epsilon}P^{1,1} + \epsilon P^{2,1} + \epsilon \sqrt{\epsilon}P^{3,1} + \cdots,$$
we get
 \begin{align} \mathcal{L}_0 P^{0,1} & = 0, \end{align}
 \begin{align} \mathcal{L}_1 P^{0,1} + \mathcal{L}_0 P^{1,1} & = 0, \end{align}
 \begin{align} \mathcal{L}_2 P^{0,1} + \mathcal{L}_1 P^{1,1} + \mathcal{L}_0 P^{2,1} & ={-}\mathcal{M}_1 P^{0,0}, \end{align}
 \begin{align} \mathcal{L}_2 P^{1,1} + \mathcal{L}_1 P^{2,1} + \mathcal{L}_0 P^{3,1} & ={-}\mathcal{M}_1 P^{1,0}. \end{align}
Then  $P^{0,1}$ is independent of
 $y$ and the centering condition tells
 $$\langle \mathcal{L}_2 P^{0,1} + \mathcal{M}_1 P^{0,0}\rangle = 0$$
holds. So, we have a PDE problem for  $P^{0,1}(t,x,z)$ as follows.
 \begin{align} \mathcal{L}_{\textrm{bs}}P^{0,1}(t,x,z) & = H_1 (t,x,z), \end{align}
 \begin{align} P^{0,1}(T,x,z) & = 0, \end{align}
where  $H_1$ is given in the following proposition.
Proposition 3.3  $P^{0,1}$, the solution of (3.2.5) with (3.2.6), is given by
 $$P^{0,1}(t,x,z) ={-}\tfrac{1}{2}(T-t)H_1(t,x,z),$$
where  $H_1$ is
 \begin{align*} H_1(t,x,z) & = V_1 x z^{\beta} \frac{\partial ^{2}}{\partial x \partial z} P^{0,0}(t,x,z),\\ V_1 & :={-} \rho_2 \langle y^{{1}/{2}}\rangle . \end{align*}
Proof. Using the property of
 $$\frac{\partial}{\partial z} P^{0,0} ={-} \frac{1}{2} (T-t) x^{2} \frac{\partial ^{2}}{\partial x^{2}} P^{0,0}$$
and the same method as in the proof of Proposition 3.2, one can prove the proposition.
Similarly to  $\bar {P}^{1,0}$ as in Section 3.1, we define
 $\bar {P}^{0,1}:=\sqrt {\delta }P^{0,1}$. Then it is given by
 $$\bar{P}^{0,1}(t,x,z) ={-}\tfrac{1}{2}(T-t)\bar{H}_1(t,x,z),$$
where  $\bar {H}_1$ is
 $$\bar{H}_1(t,x,z) = \sqrt{\delta} V_1 x z^{\beta} \frac{\partial ^{2}}{\partial x \partial z} P^{0,0}(t,x,z).$$
Note that  $\delta$ is going to be separately calibrated (not like
 $\epsilon$).
From now on in 3, we obtain the solutions of the second-order terms  $P^{1,1}$,
 $P^{2,0}$ and
 $P^{0,2}$. The solutions are going to be expressed in terms of a function
 $f$ defined by
 $$f(c_0, c_1, c_2, c_3) = c_0 (T-t)^{c_1} (\log{x/K})^{c_2} z^{c_3}.$$
To find  $P^{1,1}(t,x,z)$, we use (3.2.3), (3.2.4) and the function
 $\hat {\phi }(y,z)$ defined by the solution of
 $\mathcal {L}_0 \hat {\phi }(y,z) = \sqrt {y} - \langle \sqrt {y}\rangle$. Then we have the following PDE problem for
 $P^{1,1}$.
 \begin{align} \mathcal{L}_{\textrm{bs}}P^{1,1}(t,x,z) & = H_2 (t,x,z), \end{align}
 \begin{align} P^{1,1}(T,x,z) & = 0, \end{align}
where
 \begin{align*} H_2(t,x,z) & = V_1 z^{\beta} \frac{\partial}{\partial z} x \frac{\partial}{\partial x} P^{1,0}(t,x,z) \\ & \quad + V_0 x \frac{\partial}{\partial x} x^{2} \frac{\partial ^{2}}{\partial x^{2}} P^{0,1}(t,x,z) \\ & \quad + V_2 z^{\beta} \frac{\partial}{\partial z} x \frac{\partial}{\partial x} x\frac{\partial}{\partial x} P^{0,0}(t,x,z),\\ V_2 & := \rho_1 \rho_2 \nu \sqrt{2} \left\langle y^{\alpha + {1}/{2}} \frac{\partial}{\partial y} \hat{\phi} (y,z)\right\rangle . \end{align*}
Proposition 3.4  $P^{1,1}$, the solution of (3.2.7) with (3.2.8), is given by
 $$P^{1,1}(t,x,z) = \frac{1}{\sqrt{2\pi}} x \,e^{-{d_1 ^{2}}/{2}} u_1(t,x,z),$$
where
 \begin{align*} u_1(t,x,z) & = V_0 V_1 z^{\beta} \{ f(\tfrac{1}{4},-\tfrac{3}{2},4,-\tfrac{9}{2}) + f(-\tfrac{1}{4},-\tfrac{1}{2},3,-\tfrac{7}{2}) \\ & \quad + f(-\tfrac{3}{2},-\tfrac{1}{2},2,-\tfrac{7}{2}) + f(\tfrac{3}{4},\tfrac{1}{2},1,-\tfrac{5}{2}) \\ & \quad + f(\tfrac{3}{4},\tfrac{1}{2},0,-\tfrac{5}{2}) + f(\tfrac{3}{48},\tfrac{3}{2},1,-\tfrac{3}{2}) \\ & \quad + f(-\tfrac{3}{192},\tfrac{5}{2},0,-\tfrac{1}{2}) \} \\ & \quad - V_2 z^{\beta} \{ f(\tfrac{1}{4},-\tfrac{1}{2},2,-\tfrac{5}{2}) + f(-\tfrac{1}{4},\tfrac{1}{2},1,-\tfrac{3}{2}) \\ & \quad + f(-\tfrac{1}{4},\tfrac{1}{2},0,-\tfrac{3}{2}) + f(\tfrac{1}{16},\tfrac{3}{2},0,-\tfrac{1}{2}) \}. \end{align*}
Proof. We prove this in Appendix B.
We define  $\bar {P}^{1,1} := \sqrt {\epsilon \delta }P^{1,1}$. Then it is given by
 $$\bar{P}^{1,1}(t,x,z) = \frac{1}{\sqrt{2\pi}} x \,e^{-{d_1 ^{2}}/{2}} \bar{u}_1(t,x,z),$$
where
 \begin{align*} \bar{u}_1(t,x,z) & = \sqrt{\delta} \bar{V}_0 V_1 z^{\beta} \{ f(\tfrac{1}{4},-\tfrac{3}{2},4,-\tfrac{9}{2}) + f(-\tfrac{1}{4},-\tfrac{1}{2},3,-\tfrac{7}{2}) \\ & \quad + f(-\tfrac{3}{2},-\tfrac{1}{2},2,-\tfrac{7}{2}) + f(\tfrac{3}{4},\tfrac{1}{2},1,-\tfrac{5}{2}) + f(\tfrac{3}{4},\tfrac{1}{2},0,-\tfrac{5}{2}) \\ & \quad + f(\tfrac{3}{48},\tfrac{3}{2},1,-\tfrac{3}{2}) + f(-\tfrac{3}{192},\tfrac{5}{2},0,-\tfrac{1}{2}) \} \\ & \quad - \sqrt{\delta} \bar{V}_2 z^{\beta} \{ f(\tfrac{1}{4},-\tfrac{1}{2},2,-\tfrac{5}{2}) + f(-\tfrac{1}{4},\tfrac{1}{2},1,-\tfrac{3}{2}) \\ & \quad + f(-\tfrac{1}{4},\tfrac{1}{2},0,-\tfrac{3}{2}) + f(\tfrac{1}{16},\tfrac{3}{2},0,-\tfrac{1}{2}) \}, \\ \bar{V}_2 & := \sqrt{\epsilon} V_2. \end{align*}
In the next subsection, we obtain the solutions of  $P^{2,0}$ and
 $P^{0,2}$ terms. Note that
 $P^{2,0}$ is the second-order fast factor term involved in a terminal layer near expiry. The appropriate choice of the terminal condition is
 $\langle P^{2,0}(T,x,y,z)\rangle =0$. Refer to Fouque et al. [Reference Fouque, Lorig and Sircar5] for a detailed analysis (the full second-order asymptotics) on the terminal layer.
3.3. $P^{2,0}$ and $P^{0,2}$ terms


From (3.1.5) in Section 3.1, we have
 $$\langle \mathcal{L}_2 P^{2,0}\rangle ={-}\langle \mathcal{L}_1 P^{3,0}\rangle .$$
Let  $\psi (y,z)$ be the solution of
 $$\mathcal{L}_0 \psi(y,z) = y^{\alpha + {1}/{2}} \frac{\partial}{\partial y} \phi (y,z) - \left\langle y^{\alpha + {1}/{2}} \frac{\partial}{\partial y} \phi (y,z)\right\rangle .$$
Then using (3.1.4), the function  $F$ in (3.1.8) for
 $P^{2,0}$ satisfies
 \begin{align} \mathcal{L}_{\textrm{bs}}F(t,x,z) & = H_3 (t,x,z), \end{align}
 \begin{align} F(T,x,z) & = 0, \end{align}
where
 \begin{align*} H_3(t,x,z) & = V_3 x^{2} \frac{\partial ^{2}}{\partial x^{2}}x^{2} \frac{\partial ^{2}}{\partial x^{2}} P^{0,0}(t,x,z) \\ & \quad + V_4 x \frac{\partial}{\partial x}x \frac{\partial}{\partial x}x^{2} \frac{\partial ^{2}}{\partial x^{2}} P^{0,0}(t,x,z) \\ & \quad + V_0 x \frac{\partial}{\partial x}x^{2} \frac{\partial ^{2}}{\partial x^{2}} P^{1,0}(t,x,z),\\ V_3 & := \frac{1}{4} \langle (y-z)\phi (y,z)\rangle ,\\ V_4 & :={-}\rho_1^{2} \nu^{2} \left\langle y^{\alpha + {1}/{2}} \frac{\partial}{\partial y} \psi (y,z)\right\rangle . \end{align*}
The PDE problem (3.3.1)–(3.3.2) for  $F$ can be solved explicitly and the following formula for
 $P^{2,0}$ is obtained.
Proposition 3.5  $P^{2,0}$ with the terminal condition
 $\langle P^{2,0}(T,x,y,z)\rangle =0$ is given by
 $$P^{2,0}(t,x,y,z) ={-}\frac{1}{2} \phi(y,z) x^{2} \frac{\partial^{2}}{\partial x^{2}} P^{0,0} + F(t,x,z),$$
where
 $$F(t,x,z) ={-} \frac{1}{\sqrt{2\pi}} x \,e^{-{d_1 ^{2}}/{2}} u_2(t,x,z),$$
and
 \begin{align*} u_2(t,x,z) & = V_0^{2} \{f(-\tfrac{1}{2},-\tfrac{5}{2},4,-\tfrac{9}{2}) + f(\tfrac{1}{2},-\tfrac{3}{2},3,-\tfrac{7}{2}) + f(3,-\tfrac{3}{2},2,-\tfrac{7}{2}) \\ & \quad + f(-\tfrac{3}{2},-\tfrac{1}{2},1,-\tfrac{5}{2}) + f(-\tfrac{1}{8},\tfrac{1}{2},1,-\tfrac{3}{2}) \\ & \quad + f(-\tfrac{3}{2},-\tfrac{1}{2},0,-\tfrac{5}{2}) + f(\tfrac{1}{32},\tfrac{3}{2},0,-\tfrac{1}{2}) \} \\ & \quad + V_3 \{f(1,-\tfrac{3}{2},2,-\tfrac{5}{2}) + f({-}1,-\tfrac{1}{2},0,-\tfrac{3}{2}) + f(-\tfrac{1}{4},\tfrac{1}{2},0,-\tfrac{1}{2})\} \\ & \quad + V_4 \{f(1,-\tfrac{3}{2},2,-\tfrac{5}{2}) + f({-}1,-\tfrac{1}{2},1,-\tfrac{3}{2}) \\ & \quad + f({-}1,-\tfrac{1}{2},0,-\tfrac{3}{2}) + f(\tfrac{1}{4},\tfrac{1}{2},0,-\tfrac{1}{2})\}. \end{align*}
Proof.  $P^{2,0}$ is already given in (3.1.8) and the way to obtain the solution for
 $F(t,x,z)$ is similar to Proposition 3.4. The detailed argument is shown in Appendix B.
We define  $\bar {P}^{2,0} := \epsilon P^{2,0}$. Then it is given by
 $$\bar{P}^{2,0}(t,x,y,z) ={-}\frac{1}{2} \bar{\phi}(y,z) x^{2} \frac{\partial^{2}}{\partial x^{2}} P^{0,0} + \bar{F}(t,x,z),$$
where
 $$\bar{F}(t,x,z) ={-} \frac{1}{\sqrt{2\pi}} x e^{-{d_1 ^{2}}/{2}} \bar{u}_2(t,x,z),$$
 \begin{align*} \bar{u}_2(t,x,z)& := \bar{V}_0^{2} \{f(-\tfrac{1}{2},-\tfrac{5}{2},4,-\tfrac{9}{2}) + f(\tfrac{1}{2},-\tfrac{3}{2},3,-\tfrac{7}{2}) + f(3,-\tfrac{3}{2},2,-\tfrac{7}{2}) \\ & \quad + f(-\tfrac{3}{2},-\tfrac{1}{2},1,-\tfrac{5}{2}) + f(-\tfrac{1}{8},\tfrac{1}{2},1,-\tfrac{3}{2}) \\ & \quad + f(-\tfrac{3}{2},-\tfrac{1}{2},0,-\tfrac{5}{2}) + f(\tfrac{1}{32},\tfrac{3}{2},0,-\tfrac{1}{2}) \} \\ & \quad + \bar{V}_3 \{f(1,-\tfrac{3}{2},2,-\tfrac{5}{2}) + f({-}1,-\tfrac{1}{2},0,-\tfrac{3}{2}) + f(-\tfrac{1}{4},\tfrac{1}{2},0,-\tfrac{1}{2})\} \\ & \quad + \bar{V}_4 \{f(1,-\tfrac{3}{2},2,-\tfrac{5}{2}) + f({-}1,-\tfrac{1}{2},1,-\tfrac{3}{2}) \\ & \quad + f({-}1,-\tfrac{1}{2},0,-\tfrac{3}{2}) + f(\tfrac{1}{4},\tfrac{1}{2},0,-\tfrac{1}{2})\},\\ \bar{\phi}(y,z) & := \epsilon \phi(y,z),\\ \bar{V}_3 & := \epsilon V_3,\\ \bar{V}_4 & := \epsilon V_4. \end{align*}
Now, from (3.0.3) and the expansion
 $$P^{\epsilon,1} = P^{0,1} + \sqrt{\epsilon}P^{1,1} + \epsilon P^{2,1} + \epsilon \sqrt{\epsilon}P^{3,1} + \cdots,$$
we get the following PDE problem for  $P^{0,2}$.
 \begin{align} \mathcal{L}_{\textrm{bs}}P^{0,2}(t,x,z) & = H_4(t,x,z), \end{align}
 \begin{align} P^{0,2}(T,x,z) & = 0, \end{align}
where
 $$H_4(t,x,z) = V_1 z^{\beta} \frac{\partial}{\partial z} x \frac{\partial}{\partial x} P^{0,1}(t,x,z) -\left\{(\theta - z) \frac{\partial}{\partial z} + \frac{1}{2} z^{2\beta} \frac{\partial ^{2}}{\partial z^{2}}\right\} P^{0,0}(t,x,z).$$
Proposition 3.6  $P^{0,2}$, the solution of (3.3.3) with (3.3.4), is given by
 $$P^{0,2}(t,x,z) = \frac{1}{4 \sqrt{2\pi}} x e^{-{d_1 ^{2}}/{2}} u_3(t,x,z),$$
where
 \begin{align*} u_3(t,x,z) & = V_1^{2} z^{2 \beta} \{f(\tfrac{1}{8},-\tfrac{1}{2},4,-\tfrac{9}{2}) + f(-\tfrac{1}{8},\tfrac{1}{2},3,-\tfrac{7}{2}) \\ & \quad + f(\tfrac{1}{3} \beta,\tfrac{1}{2},2,-\tfrac{7}{2}) + f(-\tfrac{3}{4},\tfrac{1}{2},2,-\tfrac{7}{2}) + f(-\tfrac{1}{3} \beta,\tfrac{3}{2},1,-\tfrac{5}{2}) \\ & \quad + f(\tfrac{3}{8},\tfrac{3}{2},1,-\tfrac{5}{2}) + f(\tfrac{1}{32},\tfrac{5}{2},1,-\tfrac{3}{2}) + f(-\tfrac{1}{3} \beta, \tfrac{3}{2},0,-\tfrac{5}{2}) \\ & \quad + f(\tfrac{3}{8},\tfrac{3}{2},0,-\tfrac{5}{2}) + f(-\tfrac{1}{128},\tfrac{7}{2},0,-\tfrac{1}{2}) + f(\tfrac{1}{12} \beta,\tfrac{5}{2},0,-\tfrac{3}{2})\} \\ & \quad + z^{2 \beta} \{f(\tfrac{1}{6},\tfrac{1}{2},2,-\tfrac{5}{2}) + f(-\tfrac{1}{6},\tfrac{3}{2},0,-\tfrac{3}{2}) + f(-\tfrac{1}{24},\tfrac{5}{2},0,-\tfrac{1}{2}) \} \\ & \quad + (\theta - z) f(1,\tfrac{3}{2},0,-\tfrac{1}{2}). \end{align*}
Proof. See the proof in Appendix B.
We define  $\bar {P}^{0,2} := \delta P^{0,2}$. Then it is given by
 $$\bar{P}^{0,2}(t,x,z) = \frac{1}{4 \sqrt{2\pi}} x \,e^{-{d_1 ^{2}}/{2}} \bar{u}_3(t,x,z),$$
where
 $$\bar{u}_3(t,x,z) = \delta u_3(t,x,z).$$
Finally, by synthesizing the results from Proposition 3.1 to Proposition 3.6, we obtain our second-order approximation for  $P^{\epsilon ,\delta }$ as
 \begin{equation} P^{\epsilon,\delta} \approx \bar{P}^{\epsilon,\delta} := P^{0,0} + (\bar{P}^{1,0} + \bar{P}^{0,1}) + (\bar{P}^{1,1} + \bar{P}^{2,0} + \bar{P}^{0,2}).\end{equation}
Remark 1 The second-order approximation formula (3.3.5) has the accuracy given by
 $$|P^{\epsilon, \delta} - \bar{P}^{\epsilon, \delta}| = \mathcal{O}(\epsilon^{{3}/{2}-} + \epsilon\sqrt{\delta} + \delta\sqrt{\epsilon} + \delta^{{3}/{2}}),$$
where the notation  $\mathcal {O}(\epsilon ^{{3}/{2}-})$ denotes terms that are of order
 $\mathcal {O}(\epsilon ^{1+{a}/{2}})$ for any
 $a < 1$. The proof of this accuracy requires a careful analysis due to a terminal layer near the expiry. There are several possible approaches for this such as spectral methods, matched asymptotic expansions, Malliavin calculus approach, etc. Here, we quote a probabilistic approach of [Reference Fouque, Lorig and Sircar5]. The accuracy above can be proved similarly under the assumption that
 $\alpha$ and
 $\beta$ in the SDMR model satisfy the conditions stated there. The Ornstein–Uhlenbeck and Cox–Ingersoll–Ross processes corresponding to
 $\alpha =\beta =0$ and
 $\alpha =\beta =1/2$, respectively, satisfy the conditions.
4. Implied volatility formula
In this section, we obtain two implied volatility formulas based on the option pricing result in Section 3 under the SDMR model and identify the required group parameters for each formula.
We define the implied volatility  $I^{\epsilon ,\delta }$ by
 $$P_{\textrm{BS}}(t,x;K,T;I^{\epsilon,\delta}) = P^{\epsilon,\delta}(K,T),$$
where  $P_{\textrm {BS}}$ is the well-known Black–Scholes option price and
 $P^{\epsilon ,\delta }$ is given in Section 3, and we seek an asymptotic expansion of the form
 $$I^{\epsilon,\delta} = I^{0,0}+(\sqrt{\epsilon}I^{1,0}+\sqrt{\delta}I^{0,1})+(\sqrt{\epsilon\delta}I^{1,1}+\epsilon I^{2,0}+\delta I^{0,2})+\cdots.$$
Using a Taylor expansion of  $P_{\textrm {BS}}(I^{\epsilon ,\delta })$ about
 $I^{0,0}$, we get
 $$P_{\textrm{BS}}(I^{\epsilon,\delta})=P_{\textrm{BS}}(I^{0,0})+\sqrt{\epsilon}I^{1,0}\frac{\partial}{\partial\sigma}P_{\textrm{BS}}(I^{0,0}) +\sqrt{\delta}I^{0,1}\frac{\partial}{\partial\sigma}P_{\textrm{BS}}(I^{0,0})+\cdots.$$
Equating terms of like powers in  $\epsilon$ and
 $\delta$ in this and
 $P^{\epsilon ,\delta }=P^{0,0}+\sqrt {\epsilon }P^{1,0} +\sqrt {\delta }P^{0,1}+\cdots$, and applying our pricing result in Section 3, and using
 $P^{0,0}=P_{\textrm {BS}}(\sqrt {z})$, we obtain the first-order approximation
 $$I^{\epsilon,\delta} \approx I^{0,0} + \bar{I}^{1,0} + \bar{I}^{0,1},$$
where  $I^{0,0}=\sqrt {z}$ and
 \begin{align*} \bar{I}^{1,0} := \sqrt{\epsilon} I^{1,0} & = \frac{\bar{P}^{1,0}(t,x,z)}{\frac{\partial P_{\textrm{BS}}}{\partial \sigma} (t,x;K,T;\sqrt{z})},\\ \bar{I}^{0,1} := \sqrt{\delta} I^{0,1} & = \frac{\bar{P}^{0,1}(t,x,z)}{\frac{\partial P_{\textrm{BS}}}{\partial \sigma} (t,x;K,T;\sqrt{z})}. \end{align*}
However, this first-order approximation cannot capture the skew of the implied volatility, especially at short-term maturity, as we will see in Section 5. So, we need the following terms related to the second-order approximation.
 \begin{align*} \bar{I}^{1,1} & := \sqrt{\epsilon \delta} I^{1,1}= \frac{\bar{P}^{1,1}(t,x,z) -\bar{I}^{1,0} \bar{I}^{0,1} \frac{\partial^{2} P_{\textrm{BS}}}{\partial \sigma^{2}} (t,x;K,T;\sqrt{z})}{\frac{\partial P_{\textrm{BS}}}{\partial \sigma} (t,x;K,T;\sqrt{z})},\\ \bar{I}^{2,0} & := \epsilon I^{2,0} = \frac {\bar{P}^{2,0}(t,x,z) - \frac{1}{2} (\bar{I}^{1,0})^{2} \frac{\partial^{2} P_{\textrm{BS}}}{\partial \sigma^{2}} (t,x;K,T;\sqrt{z})}{\frac{\partial P_{\textrm{BS}}}{\partial \sigma} (t,x;K,T;\sqrt{z})},\\ \bar{I}^{0,2} & := \delta I^{0,2}= \frac{\bar{P}^{0,2}(t,x,z) - \frac{1}{2} (\bar{I}^{0,1})^{2} \frac{\partial^{2} P_{\textrm{BS}}}{\partial \sigma^{2}} (t,x;K,T;\sqrt{z})}{\frac{\partial P_{\textrm{BS}}}{\partial \sigma} (t,x;K,T;\sqrt{z})}. \end{align*}
Then the implied volatility approximation is extended to
 \begin{equation} I^{\epsilon,\delta} \approx \bar{I}^{\epsilon,\delta} = \sqrt{z} + (\bar{I}^{1,0} + \bar{I}^{0,1}) + (\bar{I}^{1,1} + \bar{I}^{2,0} + \bar{I}^{0,2}).\end{equation}
Remark 2 Similarly to the case of option price, the approximation formula (4.0.1) has the accuracy given by
 $$|I^{\epsilon, \delta} - \bar{I}^{\epsilon, \delta}| = \mathcal{O}(\epsilon^{{3}/{2}-} + \epsilon\sqrt{\delta} + \delta\sqrt{\epsilon} + \delta^{{3}/{2}}).$$
For the first-order approximation, we need to calibrate the unknown parameter set
 $$\Theta_1 = \{ \delta, z, \beta, \bar{V}_0, V_1 \},$$
and each parameter can capture a different characteristic of the implied volatility. Obviously,  $z$ is the long-term mean level of the underlying asset variance
 $Y_t$ and
 $\beta$ represents the constant elasticity of variance of the long-term mean level process
 $Z_t$ of the asset variance that affects
 $\bar {P}^{0,1}$. On the other hand,
 $\delta$ is the mean reversion speed of the long-term mean level process.
 $\bar {V}_0$ and
 $V_1$ are the group parameters that affect
 $\bar {P}^{1,0}$ and
 $\bar {P}^{0,1}$, respectively.
Meanwhile, for the second-order approximation, we need the parameter set
 $$\Theta_2 = \{ \delta, z, \beta, \theta, \phi, \bar{V}_0, V_1, \bar{V}_2, \bar{V}_3, \bar{V}_4 \}$$
which has more parameters to represent a more variety of features.  $\delta$,
 $z$ and
 $\beta$ are the same parameters as in the first-order approximation and
 $\theta$ is the constant long-term mean of the asset variance's mean level process that influences
 $\bar {P}^{2,0}$. The parameter
 $\phi$, defined in Section 3.1, is a function determining
 $\bar {P}^{2,0}$ but it has a particular value at time
 $t$.
 $\bar {V}_0$ has an effect on the
 $\epsilon$-related terms
 $\bar {P}^{1,0}$,
 $\bar {P}^{1,1}$ and
 $\bar {P}^{2,0}$.
 $V_1$ and
 $\beta$ affect the
 $\delta$-related terms
 $\bar {P}^{0,1}$,
 $\bar {P}^{1,1}$ and
 $\bar {P}^{0,2}$.
 $\bar {V}_2$ has an influence on only
 $\bar {P}^{1,1}$.
 $\bar {V}_3$ and
 $\bar {V}_4$ act on only
 $\bar {P}^{2,0}$. We will find out more specific impact of the parameters in Section 5.2.
5. Numerical experiment
In this section, we check the fitness of our analytic results to the real market implied volatility surface and investigate the impact of the relevant parameters on the implied volatility surface.
5.1. Calibration
We find the parameter sets  $\Theta _1$ and
 $\Theta _2$ for model fitting and compare the first- and second-order approximation formulas with the real market implied volatilities. We obtain calibration results of the implied volatility for S&P 500 option data with four different maturities.
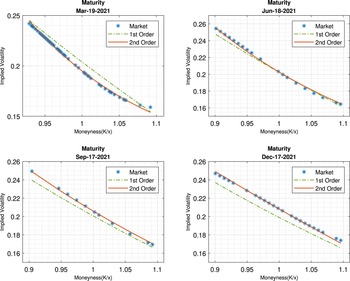
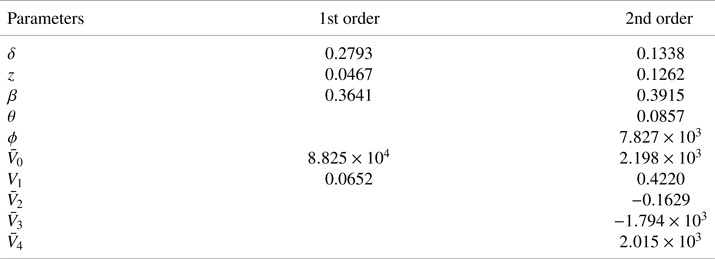
As shown in Figure 1, the first-order approximation has a difficulty of capturing not only the market implied volatilities enough but also the convexity (smile) of the implied volatility curve seen in the market data. However, the second-order approximation can find parameters that are good at catching the convexity of the volatility curve and fitting to the implied volatility curves for all the maturities. The pricing parameter values that are actually calculated are shown in Table 1.
Calibrated implied volatilities with Nov 25, 2020 S&P 500 option data for four different maturities.

Calibrated pricing parameters with Nov 25, 2020 S&P 500 option data.

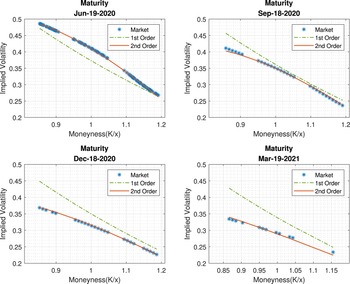
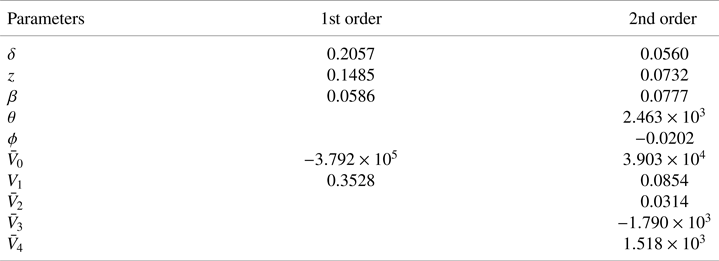
Usually, the implied volatility curves are convex as shown in Figure 1. But, in unusual markets such as the COVID-19 case, the convexity is broken. Our second-order approximation formula can reflect the market behavior in the COVID-19 situation as shown in Figure 2. Table 2 shows us the relevant calibrated pricing parameters.
Calibrated implied volatility with Mar 11, 2020 S&P 500 option data for four different maturities.

Calibrated pricing parameters with Mar 11, 2020 S&P 500 option data.

As shown in the figure, the second-order approximation formula of the implied volatility under the SDMR model can bring significant flexibility in fitting to the market data regardless of concavity (up or down). Table 3 also supports this quantitatively.
Mean square error of calibrating the first- and second-order approximations to Mar 11, 2020 and Nov 25, 2020 S&P 500 data.

5.2. Parameter sensitivity
The second-order approximation formula for the implied volatility contains various group parameters (apart from the model parameters) which can be changed depending on the market condition. These are  $\bar {V}_0$,
 $V_1$,
 $\bar {V}_2$,
 $\bar {V}_3$ and
 $\bar {V}_4$. They are group parameters for pricing options. These pricing parameters do not have practical meaning contrary to the model parameters but their impact on the implied volatility is important to be checked to see how much our model provides flexibility when it comes to calibrating the model to the implied volatility surface produced by options on the market. Also, one can use the sensitivity analysis to find an efficient calibration algorithm by assuming the less influential group parameters to be constants. So, in this section, we analyze the effect of each parameter on the implied volatility surface. When moving one parameter, we use the calibrated Nov-25-2020 S&P 500 data in Table 1 for the remaining fixed parameters.
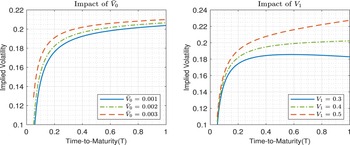
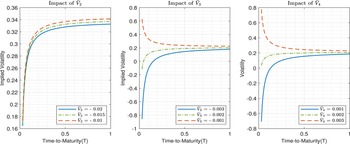
First, we show the implied volatility against time-to-maturity for three different levels of  $\bar {V}_0$ and
 $V_1$ in Figure 3. We observe that the implied volatility curves are concave for any level of
 $\bar {V}_0$ and
 $V_1$. The larger both
 $\bar {V}_0$ and
 $V_1$ values are, the higher the implied volatility is.
The impact of  $\bar {V}_0$ and
 $V_1$ on the implied volatility against time-to-maturity.

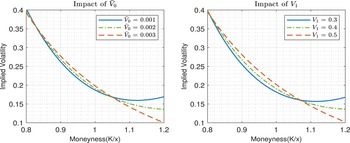
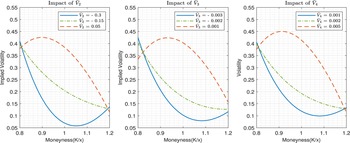
Figure 4 shows the implied volatility against moneyness for three different levels of  $\bar {V}_0$ and
 $V_1$. In this figure, the implied volatility curves are convex regardless of the choice of
 $\bar {V}_0$ and
 $V_1$ values. There is a turning point in moneyness where the increasing behavior of the implied volatility is changed into the decreasing behavior as
 $\bar {V}_0$ and
 $V_1$ values increase.
The impact of  $\bar {V}_0$ and
 $V_1$ on the implied volatility against moneyness.

Like the group parameters  $\bar {V}_0$ and
 $V_1$, the parameters
 $z$ (the long-run mean level of the asset variance) and
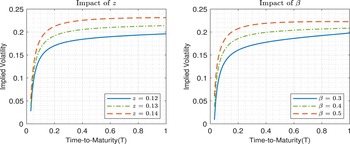
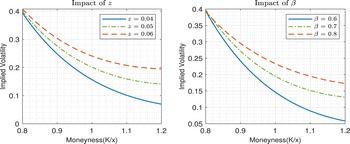
 $\beta$ (the elasticity of variance of the long-run mean level) are used for not only the first-order but also the second-order approximations. Their effects on the implied volatility are seen in Figures 5 and 6. The figures suggest that the overall level of the implied volatility increases as the value of the long-run mean level of the asset variance or the elasticity of variance of the long-run mean level increases.
The impact of  $z$ and
 $\beta$ on the implied volatility against time-to-maturity.

The impact of  $z$ and
 $\beta$ on the implied volatility against moneyness.

The group parameters  $\bar {V}_2$,
 $\bar {V}_3$ and
 $\bar {V}_4$ are parameters used only for the second-order terms
 $P^{1,1}$,
 $P^{2,0}$ and
 $P^{0,2}$, respectively. As shown in Figures 7 and 8, the overall implied volatility level goes up as each of
 $\bar {V}_2$,
 $\bar {V}_3$ and
 $\bar {V}_4$ increases. Note that
 $\bar {V}_3$ and
 $\bar {V}_4$ have an advantage of being able to express an increasing or decreasing tendency with respect to time-to-maturity by choosing the parameter values properly. On the other hand, as shown in Figure 8, the implied volatility against moneyness changes from its convex curve to concave down curve at some point as each of
 $\bar {V}_2$,
 $\bar {V}_3$ and
 $\bar {V}_4$ increases.
The impact of  $\bar {V}_2$,
 $\bar {V}_3$ and
 $\bar {V}_4$ on the implied volatility against time-to-maturity.

The impact of  $\bar {V}_2$,
 $\bar {V}_3$ and
 $\bar {V}_4$ on the implied volatility against moneyness.

Finally,  $\theta$ and
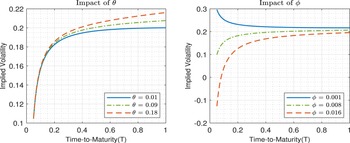
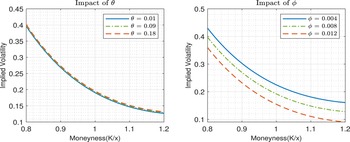
 $\phi$ are the rest of the parameters and they are used only for the second-order terms. The effects of these parameters can be found in Figures 9 and 10. The parameter
 $\theta$ represents the long-run mean of the the long-run mean level process of the asset variance. From the figures, we acknowledge that the influence of
 $\theta$ is quite ignorable as time-to-maturity becomes shorter. The implies volatility decreases as
 $\phi$ increases and the decreasing speed is very high when time-to-maturity is short.
The impact of  $\theta$ and
 $\phi$ on the implied volatility against time-to-maturity.

The impact of  $\theta$ and
 $\phi$ on the implied volatility against moneyness.

6. Conclusion
We have obtained a closed-form analytic solution formula for European options under the SDMR model. The formula is given by elementary functions without any integral terms so that it can be calculated quickly. The SDMR model calibrated to the real market implied volatility reflects the essential market parameters of the DMR model. So, simply by rescaling the existing model, we still can take advantage of the original model while the calculation cost is severely reduced.
We have found how the implied volatility changes with respect to each group parameter and how one can fit the model to market data quickly enough by using our analytic solution. If we want to make the calibration process further simpler, we can assume the less influential group parameters observed by the sensitivity analysis to be constants. An efficient calibration algorithm could be available from the chosen major parameters.
This paper has demonstrated the calibration results only for the two chosen dates representing two different market conditions but one can perform the calibration process for time series data and examine the sensitivity of the parameters in various market situations. It would allow us to consider specific constraints under which each parameter can be obtained to produce a local volatility model required for the provision of certain equity products in a daily changing market. Also, after modeling the risk-free rate and checking the impact of it at each time point, it is possible to perform a calibration study by applying the term structure of the risk-free rate to the actual market.
Acknowledgments
We thank anonymous referees for having provided valuable input on an earlier version of the manuscript. The research of J.-H. Kim was supported by the National Research Foundation of Korea NRF2021R1A2C1004080.
Conflicts of interest
The authors state that there is no conflict of interest.
Appendix A. The derivatives of $P^{0,0}$

This appendix provides the calculation result of the derivatives of  $P^{0,0}(t,x,z)$. For convenience, we use notation
 $D_i$ for an operator denoting
 $x^{i} ({\partial ^{i}}/{\partial x^{i}})$.
 \begin{align*} & D_2 P^{0,0} = \frac{1}{\sqrt{2\pi z(T-t)}} x\,e^{-{d_1^{2}}/{2}}, \\ & D_3 P^{0,0} ={-}\frac{1}{\sqrt{2\pi z(T-t)}} x \,e^{-{d_1^{2}}/{2}} \left(1 + \frac{d_1}{\sqrt{z(T-t)}}\right),\\ & D_1 D_2 P^{0,0} = \frac{1}{\sqrt{2\pi z(T-t)}} x \,e^{-{d_1^{2}}/{2}} \left(1 - \frac{d_1}{\sqrt{z(T-t)}}\right),\\ & D_2 D_2 P^{0,0} = \frac{1}{\sqrt{2\pi z(T-t)}} x\, e^{-{d_1^{2}}/{2}} \left(-\frac{d_1}{\sqrt{z(T-t)}} - \frac{1 - d_1^{2}}{z(T-t)}\right),\\ & D_1 D_1 D_2 P^{0,0} = \frac{1}{\sqrt{2\pi z(T-t)}} x \,e^{-{d_1^{2}}/{2}} \left(1 - \frac{2 d_1}{\sqrt{z(T-t)}} - \frac{1 - d_1^{2}}{z(T-t)}\right),\\ & D_1 D_2 D_2 P^{0,0} = \frac{1}{\sqrt{2\pi z(T-t)}} x\, e^{-{d_1^{2}}/{2}} \left (-\frac{d_1}{\sqrt{z(T-t)}} - \frac{2 - 2 d_1^{2}}{z(T-t)} + \frac{3 d_1 - d_1^{3}}{z(T-t)\sqrt{z(T-t)}}\right),\\ & D_1 D_2 D_3 P^{0,0} = \frac{1}{\sqrt{2\pi z(T-t)}} x \,e^{-{d_1^{2}}/{2}} \left(\frac{d_1}{\sqrt{z(T-t)}} + \frac{1 - d_1^{2}}{z(T-t)} + \frac{3 d_1 - d_1^{3}}{z(T-t)\sqrt{z(T-t)}}\right.\\ & \qquad\qquad\qquad\quad \left. + \frac{3 - 6 d_1^{2} + d_1^{4}}{z^{2} (T-t)^{2}}\right), \end{align*}
 \begin{align*} \\ & \frac{\partial}{\partial z} P^{0,0} = \frac{\sqrt{T-t}}{2 \sqrt{2\pi z}} x \,e^{-{d_1^{2}}/{2}},\\ & \frac{\partial^{2}}{\partial z^{2}} P^{0,0} ={-} \frac{1}{8 \sqrt{2\pi}} x\, e^{-{d_1^{2}}/{2}} \left(\frac{d_1 (T-t)}{z} + \frac{2 \sqrt{T-t}}{z\sqrt{z}} - \frac{2 d_1 \log{\frac{x}{K}}}{z^{2}}\right),\\ & \frac{\partial}{\partial z} D_2 P^{0,0} = \frac{1}{4 \sqrt{2\pi}} x \,e^{-{d_1^{2}}/{2}} \left(- \frac{d_1}{z} - \frac{2}{z\sqrt{z(T-t)}} + \frac{2 d_1 \log{\frac{x}{K}}}{z^{2}(T-t)}\right),\\ & \frac{\partial}{\partial z} D_3 P^{0,0} = \frac{1}{4 \sqrt{2\pi}} x \,e^{-{d_1^{2}}/{2}} \left(\frac{d_1}{z} + \frac{1 + d_1^{2}}{z \sqrt{z(T-t)}} + \frac{2 d_1 (2 - \log{\frac{x}{K}})}{z^{2} (T-t)} + \frac{2 (1 - d_1^{2}) \log{\frac{x}{K}}}{z^{2} (T-t) \sqrt{z(T-t)}}\right),\\ & \frac{\partial}{\partial z} D_4 P^{0,0} = \frac{1}{4 \sqrt{2\pi}} x \,e^{-{d_1^{2}}/{2}} \left(- \frac{2 d_1}{z} - \frac{1 + 3 d_1^{2}}{z \sqrt{z(T-t)}} - \frac{d_1(9 - 4 \log{\frac{x}{K}} + d_1^{2})}{z^{2} (T-t)} + \frac{6 (1 - d_1^{2}) (1 - \log{\frac{x}{K}})}{z^{2} (T-t) \sqrt{z(T-t)}}\right.\\ & \qquad\qquad\qquad \left. - \frac{2 d_1 \log{\frac{x}{K}}(3 - d_1^{2})}{z^{3} (T-t)^{2}}\right),\\ & \frac{\partial}{\partial z} D_1 D_1 P^{0,0} = \frac{1}{4 \sqrt{2\pi}} x\, e^{-{d_1^{2}}/{2}} \left(\frac{\sqrt{T-t}}{\sqrt{z}} - \frac{d_1}{z} - \frac{2(1 + \log{\frac{x}{K}})}{z\sqrt{z(T-t)}} + \frac{2 d_1 \log{\frac{x}{K}}}{z^{2}(T-t)}\right), \\ & \frac{\partial}{\partial z} \frac{\partial}{\partial z} D_1 D_1 P^{0,0} = \frac{1}{16 \sqrt{2\pi}} x\, e^{-{d_1^{2}}/{2}} \left(- \frac{d_1 (T-t)}{z} - \frac{(3 - d_1^{2}) \sqrt{T-t}}{z\sqrt{z}} + \frac{2 d_1(3 + 2 \log{\frac{x}{K}})}{z^{2}}\right.\\ & \qquad\qquad\qquad\qquad \left. + \frac{4(3 + 4\log{\frac{x}{K}} - d_1^{2} \log{\frac{x}{K}})}{z^{2} \sqrt{z(T-t)}} - \frac{4d_1\log{\frac{x}{K}}(5 + \log{\frac{x}{K}})}{z^{3} (T-t)} - \frac{4(1 - d_1^{2})(\log{\frac{x}{K}})^{2}}{z^{3}(T-t)\sqrt{z(T-t)}}\right).\end{align*}
Appendix B. Proofs of Propositions 3.4, 3.5 and 3.6
The PDEs for  $P^{1,1}$,
 $F$ and
 $P^{0,2}$ have the form of nonhomogenous heat equation. This appendix describes how to obtain solutions of those PDEs.
Suppose that we have the following PDE problem.
 \begin{align*} \left(\frac{\partial}{\partial t} + \frac{1}{2} z x^{2} \frac{\partial^{2}}{\partial x^{2}}\right)P(t,x,z) & = H(t,x,z),\\ P(T,x,z) & = 0, \end{align*}
where the function  $H$ can represent
 $H_2$,
 $H_3$ or
 $H_4$ in Section 3 corresponding to
 $P^{1,1}$,
 $F$ or
 $P^{0,2}$. Let
 $s = \log ({x}/{K})$ and
 $\tau = T-t$. Then
 \begin{align*} \left(\frac{\partial}{\partial \tau} + \frac{1}{2} z \frac{\partial}{\partial s} - \frac{1}{2} z \frac{\partial^{2}}{\partial s^{2}}\right) \tilde{P}(\tau,s,z) & ={-} \tilde{H}(\tau,s,z), \\ \tilde{P}(0,s,z) & = 0, \end{align*}
where  $\tilde {P}(\tau ,s,z) = P(t,x,z)$ and
 $\bar {H}(\tau ,s,z) = H(t,x,z)$. Using the Green function method, we have the solution
 $$\tilde{P}(\tau,s,z) = e^{\frac{1}{2}s - \frac{1}{8}z\tau} u(\tau,s,z),$$
where
 \begin{align*} u(\tau,s,z) & = \int_{0}^{\tau} \int_{-\infty}^{\infty} -e^{\frac{1}{2} \xi + \frac{1}{8}z\bar{\tau}} \tilde{H}(\bar{\tau},\xi,z) G(\tau - \bar{\tau},s,\xi) \, d\xi d\bar{\tau}, \\ G(\tau,s,\xi) & = \frac{1}{\sqrt{2 \pi z \tau}}\,e^{- {(s-\xi)^{2}}/{2 z \tau}}. \end{align*}
Since the function  $H$ always has the form of
 $H(t,x,z) = ({1}/{\sqrt {2 \pi }}) x \,e^{-{d_1^{2}}/{2}}H^{{\dagger} }(t,x,z)$ for some function
 $H^{{\dagger} }$, the inner integral above can be expressed by
 \begin{align*} & \int_{-\infty}^{\infty} -e^{\frac{1}{2} \xi + \frac{1}{8}z\bar{\tau}} \tilde{H}(\bar{\tau},\xi,z) G(\tau - \bar{\tau},s,\xi) \,d\xi \\ & \quad ={-}\frac{\sqrt{\bar{\tau}}}{\sqrt{2 \pi \tau}} K \,e^{-{s^{2}}/{2 z \tau}} \int_{-\infty}^{\infty} \frac{1}{\sigma \sqrt{2 \pi}} \,e^{- {(\xi - \mu)^{2}}/{2 \sigma^{2}}} \tilde{H}^{{{\dagger}}}(\bar{\tau},\xi,z) d\xi, \end{align*}
where  $\mu = {\bar {\tau } s}/{\tau }$,
 $\sigma = \sqrt {{(z\bar {\tau }(\tau - \bar {\tau }))}/{\tau }}$ and
 $\tilde {H^{{\dagger} }}(\tau ,s,z) = H^{{\dagger} }(t,x,z)$.
In our case, we can calculate this integral explicitly in terms of expectation of the power of normally distributed random variable  $\xi _{*}$. Let the result be denoted by
 $\tilde {u}(\bar {\tau },s,z)$. Then the solution
 $\tilde {P}(\tau ,s,z)$ is given by
 $$\tilde{P}(\tau,s,z) = e^{\frac{1}{2}s - \frac{1}{8}z\tau} \int_{0}^{\tau} \tilde{u}(\bar{\tau},s,z) \,d\bar{\tau}.$$
So, we can get the solution  $P(t,x,z)$ by computing the integral with respect to
 $\bar {\tau }$ and substituting
 $s = \log ({x}/{k})$ and
 $\tau = T-t$ into the result.
Proof of Proposition 3.4.  $P^{1,1}(t,x,z)$ is the solution of the PDE problem
 \begin{align*} \left(\frac{\partial}{\partial t} + \frac{1}{2} z x^{2} \frac{\partial^{2}}{\partial x^{2}}\right)P^{1,1}(t,x,z) & = H_2 (t,x,z),\\ P^{1,1}(T,x,z) & = 0, \end{align*}
where
 \begin{align*} H_2(t,x,z) & = V_1 z^{\beta} \frac{\partial}{\partial z} x \frac{\partial}{\partial x} P^{1,0}(t,x,z) \\ & \quad + V_0 x \frac{\partial}{\partial x} x^{2} \frac{\partial ^{2}}{\partial x^{2}} P^{0,1}(t,x,z) \\ & \quad + V_2 z^{\beta} \frac{\partial}{\partial z} x \frac{\partial}{\partial x} x\frac{\partial}{\partial x} P^{0,0}(t,x,z). \end{align*}
By using  $P^{1,0}(t,x,z)$ and
 $P^{0,1}(t,x,z)$ in Propositions 3.2 and 3.3, respectively, a simple calculation leads to
 \begin{align*} H_2(t,x,z) & ={-} 6 V_0V_1 (T-t) z^{\beta}\frac{\partial}{\partial z} x^{2} \frac{\partial^{2}}{\partial x^{2}} P^{0,0}(t,x,z) \\ & \quad - \frac{15}{2} V_0V_1 (T-t) z^{\beta}\frac{\partial}{\partial z} x^{3} \frac{\partial ^{3}}{\partial x^{3}} P^{0,0}(t,x,z) \\ & \quad - \frac{3}{2} V_0V_1 (T-t) z^{\beta}\frac{\partial}{\partial z} x^{4} \frac{\partial ^{4}}{\partial x^{4}} P^{0,0}(t,x,z) \\ & \quad + V_2 z^{\beta} \frac{\partial}{\partial z} x \frac{\partial}{\partial x} x\frac{\partial}{\partial x} P^{0,0}(t,x,z). \end{align*}
Then we use the derivatives of  $P^{0,0}(t,x,z)$ in Appendix A to obtain
 \begin{align*} H_2(t,x,z) & = \frac{1}{\sqrt{2 \pi}} x e^{-{d_1^{2}}/{2}} \left[ - V_0 V_1 z^{\beta} \left( \frac{3}{4}\left(\log{\frac{x}{K}}\right)^{4} z^{-{9}/{2}} (T-t)^{-{5}/{2}} - \frac{3}{4}\left(\log{\frac{x}{K}}\right)^{3} z^{-{7}/{2}} (T-t)^{-{3}/{2}}\right.\right. \\ & \quad - \frac{9}{2} \left(\log{\frac{x}{K}}\right)^{2} z^{-{7}/{2}} (T-t)^{-{3}/{2}} + \log{\frac{x}{K}} \left(\frac{9}{4} z^{-{5}/{2}} (T-t)^{-{1}/{2}} + \frac{3}{16} z^{-{3}/{2}} (T-t)^{{1}/{2}}\right) \\ & \quad + \left.\frac{9}{4} z^{-{5}/{2}} (T-t)^{-{1}/{2}} - \frac{3}{64} z^{-{1}/{2}} (T-t)^{{3}/{2}}\right)\\ & \quad + V_2 z^{\beta} \left( \frac{1}{2} \left(\log{\frac{x}{K}}\right)^{2} z^{-{5}/{2}} (T-t)^{-{3}/{2}} - \frac{1}{2} \log{\frac{x}{K}} z^{-{3}/{2}} (T-t)^{-{1}/{2}} \right.\\ & \quad \left.\left.- \frac{1}{2} z^{-{3}/{2}} (T-t)^{-{1}/{2}} + \frac{1}{8} z^{-{1}/{2}} (T-t)^{{1}/{2}} \right) \right]. \end{align*}
By letting  $H_2(t,x,z) = x \,e^{-{d_1^{2}}/{2}}H_2^{{\dagger} }(t,x,z)$, we have
 \begin{align*} & - \frac{\sqrt{\bar{\tau}}}{\sqrt{2 \pi \tau}} K \,e^{-{s^{2}}/{2 z \tau}} \int_{-\infty}^{\infty} \frac{1}{\sigma \sqrt{2 \pi}} \,e^{- {(s - \mu)^{2}}/{2 \sigma^{2}}} \tilde{H}_2^{{{\dagger}}}(\bar{\tau},\xi,z) \,d\xi\\ & \quad ={-} \frac{\sqrt{\bar{\tau}}}{\sqrt{2 \pi \tau}} K \,e^{-{s^{2}}/{2 z \tau}} \left[ - V_0 V_1 z^{\beta} \left( \frac{3}{4} z^{-{9}/{2}} \bar{\tau}^{-{5}/{2}} E[\xi^{4}_{*}] - \frac{3}{4} z^{-{7}/{2}} \bar{\tau}^{-{3}/{2}} E[\xi^{3}_{*}]\right.\right.\\ & \qquad - \frac{9}{2} z^{-{7}/{2}} \bar{\tau}^{-{3}/{2}} E[\xi^{2}_{*}] + \left(\frac{9}{4} z^{-{5}/{2}} \bar{\tau}^{-{1}/{2}} + \frac{3}{16} z^{-{3}/{2}} \bar{\tau}^{{1}/{2}}\right) E[\xi_{*}] \\ & \qquad \left.+ \frac{9}{4} z^{-{5}/{2}} \bar{\tau}^{-{1}/{2}} - \frac{3}{64} z^{-{1}/{2}} \bar{\tau}^{{3}/{2}}\right)\\ & \qquad + V_2 z^{\beta} \left( \frac{1}{2} z^{-{5}/{2}} \bar{\tau}^{-{3}/{2}} E[\xi^{2}_{*}] - \frac{1}{2} z^{-{3}/{2}} \bar{\tau}^{-{1}/{2}} E[\xi_{*}]\right. \\ & \qquad \left.\left. - \frac{1}{2} z^{-{3}/{2}} \bar{\tau}^{-{1}/{2}} + \frac{1}{8} z^{-{1}/{2}} \bar{\tau}^{{1}/{2}} \right)\right]. \end{align*}
Since the random variable  $\xi _{*}$ is normally distributed with the mean
 $\mu$ and the variance
 $\sigma ^{2}$, we can use the expression
 $E[e^{t\xi _{*}}] = \exp \{ \mu t + \frac {1}{2} \sigma ^{2} t^{2} \}$. By differentiating both sides with respect to
 $t$ and letting
 $t=0$, we can easily calculate the expectation of the power of
 $\xi _{*}$ as follows.
 \begin{align*} E[\xi^{4}_{*}] & = \mu^{4} + 6 \sigma^{2} \mu^{2} + 3 \sigma^{4} \\ & = \bar{\tau}^{4} s^{4} \tau^{{-}4} + 6z \bar{\tau}^{3} s^{2} \tau^{{-}2} - 6z \bar{\tau}^{4} s^{2} \tau^{{-}3} + 3z^{2} \bar{\tau}^{2} - 6z^{2} \bar{\tau}^{3} \tau^{{-}1} + 3z^{2} \bar{\tau}^{4} \tau^{{-}2}, \\ E[\xi^{3}_{*}] & = \mu^{3} + 3 \sigma^{2} \mu \\ & = \bar{\tau}^{3} s^{3} \tau^{{-}3} + 3z \bar{\tau}^{2} s \tau^{{-}1} - 3z \bar{\tau}^{3} s \tau^{{-}2}, \\ E[\xi^{2}_{*}] & = \mu^{2} + \sigma^{2} \\ & = \bar{\tau}^{2} s^{2} \tau^{{-}2} + z \bar{\tau} - z \bar{\tau}^{2} \tau^{{-}1}, \\ E[\xi_{*}] & = \mu = \bar{\tau} s \tau^{{-}1}. \end{align*}
Putting these results into the equation above, we explicitly compute the inner integral with respect to  $\xi$. Then only the integral with respect to
 $\tau$ remains as
 $$\tilde{P}^{1,1}(\tau,s,z) = \frac{1}{\sqrt{2\pi}} K\,e^{-{\tilde{d_2} ^{2}}/{2}} \int_{0}^{\tau} \tilde{u_1}(\tau,s,z,\bar{\tau}) \,d\bar{\tau} ,$$
where
 \begin{align*} \tilde{d_2} & = \frac{1}{\sqrt{z\tau}} \left( s - \frac{1}{2} z\tau \right), \\ \tilde{u_1}(\tau,s,z,\bar{\tau}) & = V_0 V_1 z^{\beta} \left\{ g\left(\frac{3}{4},-\frac{9}{2},4,-\frac{9}{2},2\right) + g\left(-\frac{3}{4},-\frac{7}{2},3,-\frac{7}{2},2\right) \right.\\ & \quad + g\left(-\frac{9}{2},-\frac{7}{2},2,-\frac{7}{2},2\right) + g\left(\frac{9}{4},-\frac{5}{2},1,-\frac{5}{2},2\right) \\ & \quad + g\left(\frac{9}{4},-\frac{5}{2},0,-\frac{5}{2},2\right) + g\left(\frac{3}{16},-\frac{3}{2},1,-\frac{3}{2},2\right) \\ & \quad \left.+ g\left(-\frac{3}{64},-\frac{1}{2},0,-\frac{1}{2},2\right) \right\} \\ & \quad - V_2 z^{\beta} \left\{ g\left(\frac{1}{2},-\frac{5}{2},2,-\frac{5}{2},1\right) + g\left(-\frac{1}{2},-\frac{3}{2},1,-\frac{3}{2},1\right) \right.\\ & \quad \left.+ g\left(-\frac{1}{2},-\frac{3}{2},0,-\frac{3}{2},1\right) + g\left(\frac{1}{8},-\frac{1}{2},0,-\frac{1}{2},1\right) \right\},\\ g(c_0, c_1, c_2, c_3, c_4) & := c_0 \tau^{c_1} s^{c_2} z^{c_3} \bar{\tau}^{c_4}. \end{align*}
Finally, we calculate the integral and obtain the closed-form solution  $P^{1,1}(t,x,z)$ as given in Proposition 3.4 by substituting
 $\tau = T-t$ and
 $s = \log ({x}/{K})$.
Proof of Proposition 3.5. As described in Section 3.3,  $F(t,x,z)$ is the solution of the PDE problem
 \begin{align*} \left(\frac{\partial}{\partial t} + \frac{1}{2} z x^{2} \frac{\partial^{2}}{\partial x^{2}}\right)F(t,x,z) & = H_3 (t,x,z)\\ F(T,x,z) & = 0, \end{align*}
where
 \begin{align*} H_3(t,x,z) & = V_3 x^{2} \frac{\partial ^{2}}{\partial x^{2}}x^{2} \frac{\partial ^{2}}{\partial x^{2}} P^{0,0}(t,x,z)\\ & \quad + V_4 x \frac{\partial}{\partial x}x \frac{\partial}{\partial x}x^{2} \frac{\partial^{2}}{\partial x^{2}} P^{0,0}(t,x,z)\\ & \quad + V_0 x \frac{\partial}{\partial x}x^{2} \frac{\partial ^{2}}{\partial x^{2}} P^{1,0}(t,x,z), \\ V_3 & = \frac{1}{4} \langle (y-z)\phi (y,z)\rangle , \\ V_4 & ={-}\rho_1^{2} \nu^{2} \left\langle y^{\alpha + {1}/{2}} \frac{\partial}{\partial y} \psi (y,z)\right\rangle . \end{align*}
Substituting  $P^{1,0}(t,x,z)$ in Proposition 3.2 into
 $H_3(t,x,z)$, we get the following equation.
 \begin{align*} H_3(t,x,z) & = V_3 x^{2} \frac{\partial ^{2}}{\partial x^{2}} x^{2} \frac{\partial ^{2}}{\partial x^{2}} P^{0,0}(t,x,z)\\ & \quad + V_4 x \frac{\partial}{\partial x}x \frac{\partial}{\partial x}x^{2} \frac{\partial^{2}}{\partial x^{2}} P^{0,0}(t,x,z)\\ & \quad - 2 V_0^{2}(T-t) x \frac{\partial}{\partial x} x^{2} \frac{\partial ^{2}}{\partial x^{2}} x^{2} \frac{\partial ^{2}}{\partial x^{2}} P^{0,0}(t,x,z)\\ & \quad - V_0^{2}(T-t) x \frac{\partial}{\partial x} x^{2} \frac{\partial ^{2}}{\partial x^{2}} x^{3} \frac{\partial ^{3}}{\partial x^{3}} P^{0,0}(t,x,z). \end{align*}
From Appendix A, we have
 \begin{align*} H_3(t,x,z) & = \frac{1}{\sqrt{2 \pi}} x e^{-{d_1^{2}}/{2}} \left[V_3 \left(\left(\log{\frac{x}{K}}\right)^{2} z^{-{5}/{2}} (T-t)^{-{5}/{2}} - z^{-{3}/{2}} (T-t)^{-{3}/{2}} - \frac{1}{4} z^{-{1}/{2}} (T-t)^{-{1}/{2}}\right)\right. \\ & \quad + V_4 \left(\left(\log{\frac{x}{K}}\right)^{2} z^{-{5}/{2}} (T-t)^{-{5}/{2}} - \log{\frac{x}{K}} z^{-{3}/{2}} (T-t)^{-{3}/{2}} \right.\\ & \quad \left.- z^{-{3}/{2}} (T-t)^{-{3}/{2}} + \frac{1}{4} z^{-{1}/{2}} (T-t)^{-{1}/{2}}\right) \\ & \quad + V_0^{2} \left(-\left(\log{\frac{x}{K}}\right)^{4} z^{-{9}/{2}} (T-t)^{-{7}/{2}} + \left(\log{\frac{x}{K}}\right)^{3} z^{-{7}/{2}} (T-t)^{-{5}/{2}}\right. \\ & \quad + 6 \left(\log{\frac{x}{K}}\right)^{2} z^{-{7}/{2}} (T-t)^{-{5}/{2}} - \log{\frac{x}{K}} \left(3 z^{-{5}/{2}} (T-t)^{-{3}/{2}} + \frac{1}{4} z^{-{3}/{2}} (T-t)^{-{1}/{2}}\right) \\ & \quad \left.\left.- 3 z^{-{5}/{2}} (T-t)^{-{3}/{2}} + \frac{1}{16} z^{-{1}/{2}} (T-t)^{{1}/{2}}\right)\right] \end{align*}
and  $H_3(t,x,z) = x \,e^{-{d_1^{2}}/{2}}H_3^{{\dagger} }(t,x,z)$ gives us
 \begin{align*} & - \frac{\sqrt{\bar{\tau}}}{\sqrt{2 \pi \tau}} K\, e^{-{s^{2}}/{2 z \tau}} \int_{-\infty}^{\infty} \frac{1}{\sigma \sqrt{2 \pi}} \,e^{-{(s - \mu)^{2}}/{2 \sigma^{2}}} \tilde{H}_3^{{{\dagger}}}(\bar{\tau},\xi,z) \,d\xi \\ & \quad={-} \frac{\sqrt{\bar{\tau}}}{\sqrt{2 \pi \tau}} K \,e^{-{s^{2}}/{2 z \tau}} \left[ V_3 \left(z^{-{5}/{2}} \bar{\tau}^{-{5}/{2}} E[\xi^{2}_{*}] - z^{-{3}/{2}} \bar{\tau}^{-{3}/{2}} - \frac{1}{4} z^{-{1}/{2}} \bar{\tau}^{-{1}/{2}}\right)\right.\\ & \qquad + V_4 \left( z^{-{5}/{2}} \bar{\tau}^{-{5}/{2}} E[\xi^{2}_{*}] - z^{-{3}/{2}} \bar{\tau}^{-{3}/{2}} E[\xi_{*}] - z^{-{3}/{2}} \bar{\tau}^{-{3}/{2}} + \frac{1}{4} z^{-{1}/{2}} \bar{\tau}^{-{1}/{2}}\right)\\ & \qquad + V_0^{2} \left(- z^{-{9}/{2}} \bar{\tau}^{-{7}/{2}} E[\xi^{4}_{*}] + z^{-{7}/{2}} \bar{\tau}^{-{5}/{2}} E[\xi^{3}_{*}]\right. \\ & \qquad + 6 z^{-{7}/{2}} \bar{\tau}^{-{5}/{2}} E[\xi^{2}_{*}] - \left(3 z^{-{5}/{2}} \bar{\tau}^{-{3}/{2}} + \frac{1}{4} z^{-{3}/{2}} \bar{\tau}^{-{1}/{2}}\right) E[\xi_{*}] \\ & \qquad \left.\left.- 3 z^{-{5}/{2}} \bar{\tau}^{-{3}/{2}} + \frac{1}{16} z^{-{1}/{2}} \bar{\tau}^{{1}/{2}}\right) \right]. \end{align*}
Using the expectation of the power of  $\xi _{*}$ described as in the proof of Proposition 3.4, we obtain
 $$\tilde{F}(t,s,z) ={-} \frac{1}{\sqrt{2\pi}} K \,e^{-{\tilde{d_2} ^{2}}/{2}} \int_{0}^{\tau} \tilde{u_2}(\tau,s,z,\bar{\tau}) \,d\bar{\tau},$$
where
 \begin{align*} \tilde{u_2}(\tau,s,z,\bar{\tau}) & = V_0^{2} \{ g({-}1,-\tfrac{9}{2},4,-\tfrac{9}{2},1) + g(1,-\tfrac{7}{2},3,-\tfrac{7}{2},1) \\ & \quad + g(6,-\tfrac{7}{2},2,-\tfrac{7}{2},1) + g({-}3,-\tfrac{5}{2},1,-\tfrac{5}{2},1) \\ & \quad + g(-\tfrac{1}{4},-\tfrac{3}{2},1,-\tfrac{3}{2},1) + g({-}3,-\tfrac{5}{2},0,-\tfrac{5}{2},1) \\ & \quad + g(\tfrac{1}{16},-\tfrac{1}{2},0,-\tfrac{1}{2},1)\} \\ & \quad + V_3 \{g(1,-\tfrac{5}{2},2,-\tfrac{5}{2},0) + g({-}1,-\tfrac{3}{2},0,-\tfrac{3}{2},0) \\ & \quad + g(-\tfrac{1}{4},-\tfrac{1}{2},0,-\tfrac{1}{2},0)\} \\ & \quad + V_4 \{g(1,-\tfrac{5}{2},2,-\tfrac{5}{2},0) + g({-}1,-\tfrac{3}{2},1,-\tfrac{3}{2},0) \\ & \quad + g({-}1,-\tfrac{3}{2},0,-\tfrac{3}{2},0) + g(\tfrac{1}{4},-\tfrac{1}{2},0,-\tfrac{1}{2},0)\}. \end{align*}
Thus we obtain  $F(t,x,z)$ and subsequently
 $P^{2,0}(t,x,y,z)$ as in Proposition 3.5 by simple computation.
Proof of Proposition 3.6. As described in Section 3.3,  $P^{0,2}(t,x,z)$ is the solution of the PDE problem
 \begin{align*} \left(\frac{\partial}{\partial t} + \frac{1}{2} z x^{2} \frac{\partial^{2}}{\partial x^{2}}\right)P^{0,2}(t,x,z) & = H_4(t,x,z),\\ P^{0,2}(T,x,z) & = 0, \end{align*}
where
 \begin{align*} H_4(t,x,z) & = V_1 z^{\beta} \frac{\partial}{\partial z} x \frac{\partial}{\partial x} P^{0,1}(t,x,z) \\ & \quad -\left\{(\theta - z) \frac{\partial}{\partial z} + \frac{1}{2} z^{2\beta} \frac{\partial ^{2}}{\partial z^{2}}\right\} P^{0,0}(t,x,z). \end{align*}
From Propositions 3.1 and 3.3 for  $P^{0,0}$ and
 $P^{0,1}$, respectively, we get
 \begin{align*} H_4(t,x,z) & ={-} \frac{1}{2} V_1^{2} (T-t) z^{\beta} \frac{\partial}{\partial z} z^{\beta} \frac{\partial}{\partial z} x \frac{\partial}{\partial x} x \frac{\partial}{\partial x} P^{0,0}(t,x,z) \\ & \quad -\left\{(\theta - z) \frac{\partial}{\partial z} + \frac{1}{2} z^{2\beta} \frac{\partial ^{2}}{\partial z^{2}}\right\} P^{0,0}(t,x,z) \\ & ={-} \frac{1}{4 \sqrt{2 \pi}} x\, e^{-{d_1^{2}}/{2}} \left[V_1^{2} z^{2 \beta} \left(\frac{1}{2} \left(\log{\frac{x}{K}}\right)^{4} z^{-{9}/{2}} (T-t)^{-{3}/{2}} \right.\right.\\ & \quad - \frac{1}{2} \left(\log{\frac{x}{K}}\right)^{3} z^{-{7}/{2}} (T-t)^{-{1}/{2}} \\ & \quad + (\beta - 3) \left(\log{\frac{x}{K}}\right)^{2} z^{-{7}/{2}} (T-t)^{-{1}/{2}} \\ & \quad + \log{\frac{x}{K}} \left(\left(- \beta + \frac{3}{2}\right) z^{-{5}/{2}} (T-t)^{{1}/{2}} + \frac{1}{8} z^{-{3}/{2}} (T-t)^{{3}/{2}}\right) \\ & \quad + \left(- \beta + \frac{3}{2}\right) z^{-{5}/{2}} (T-t)^{{1}/{2}} + \frac{1}{4} \beta z^{-{3}/{2}} (T-t)^{{3}/{2}} \\ & \quad \left.- \frac{1}{32} z^{-{1}/{2}} (T-t)^{{5}/{2}}\right) \\ & \quad + z^{2 \beta} \left(\frac{1}{2} \left(\log{\frac{x}{K}}\right)^{2} z^{-{5}/{2}} (T-t)^{-{1}/{2}} \right.\\ & \quad \left.- \frac{1}{2} z^{-{3}/{2}} (T-t)^{{1}/{2}} - \frac{1}{8} z^{-{1}/{2}} (T-t)^{{3}/{2}}\right) \\ & \quad \left.\vphantom{\left(\frac{1}{2}\right)} + 2(\theta - z) z^{-{1}/{2}} (T-t)^{{1}/{2}}\right], \end{align*}
and  $H_4(t,x,z) = x \,e^{-{d_1^{2}}/{2}}H_4^{{\dagger} }(t,x,z)$ gives us
 \begin{align*} & - \frac{\sqrt{\bar{\tau}}}{\sqrt{2 \pi \tau}} K \,e^{-{s^{2}}/{2 z \tau}} \int_{-\infty}^{\infty} \frac{1}{\sigma \sqrt{2 \pi}} \,e^{-{(s - \mu)^{2}}/{2 \sigma^{2}}} \tilde{H}_4^{{{\dagger}}}(\bar{\tau},\xi,z) \,d\xi\\ & \quad ={-} \frac{\sqrt{\bar{\tau}}}{4 \sqrt{2 \pi \tau}} K \,e^{-{s^{2}}/{2 z \tau}} \left[ V_1^{2} z^{2 \beta} \left(\frac{1}{2} z^{-{9}/{2}} \bar{\tau}^{-{3}/{2}} E[\xi^{4}_{*}] - \frac{1}{2} z^{-{7}/{2}} \bar{\tau}^{-{1}/{2}} E[\xi^{3}_{*}] \right.\right.\\ & \qquad + (\beta - 3) z^{-{7}/{2}} \bar{\tau}^{-{1}/{2}} E[\xi^{2}_{*}] \\ & \qquad + \left(\left(- \beta + \frac{3}{2}\right) z^{-{5}/{2}} \bar{\tau}^{{1}/{2}} + \frac{1}{8} z^{-{3}/{2}} \bar{\tau}^{{3}/{2}}\right) E[\xi_{*}] \\ & \qquad \left.+ \left(- \beta + \frac{3}{2}\right) z^{-{5}/{2}} \bar{\tau}^{{1}/{2}} + \frac{1}{4} \beta z^{-{3}/{2}} \bar{\tau}^{{3}/{2}} - \frac{1}{32} z^{-{1}/{2}} \bar{\tau}^{{5}/{2}}\right) \\ & \qquad + z^{2 \beta} \left(\frac{1}{2} z^{-{5}/{2}} \bar{\tau}^{-{1}/{2}} E[\xi^{2}_{*}] - \frac{1}{2} z^{-{3}/{2}} \bar{\tau}^{{1}/{2}} - \frac{1}{8} z^{-{1}/{2}} \bar{\tau}^{{3}/{2}}\right) \\ & \qquad \left.\vphantom{\left(\frac{1}{2}\right)} + 2(\theta - z) z^{-{1}/{2}} \bar{\tau}^{{1}/{2}} \right]. \end{align*}
Using the expectation of the power of  $\xi _{*}$ in the proof of Proposition 3.4, we obtain
 $$\tilde{P}^{0,2}(\tau,s,z) = \frac{1}{4 \sqrt{2\pi}} K \,e^{-{\tilde{d}_2^{2}}/{2}} \int_{0}^{\tau} \tilde{u}_3(\tau,s,z,\bar{\tau}) \,d\bar{\tau},$$
where
 \begin{align*} \tilde{u}_3(\tau,s,z,\bar{\tau}) & = V_1^{2} z^{2 \beta} \{g(\tfrac{1}{2},-\tfrac{9}{2},4,-\tfrac{9}{2},3) + g(-\tfrac{1}{2},-\tfrac{7}{2},3,-\tfrac{7}{2},3) \\ & \quad + g(\beta,-\tfrac{5}{2},2,-\tfrac{7}{2},2) + g({-}3,-\tfrac{7}{2},2,-\tfrac{7}{2},3) + g(-\beta, -\tfrac{3}{2},1,-\tfrac{5}{2},2) \\ & \quad + g(\tfrac{3}{2},-\tfrac{5}{2},1,-\tfrac{5}{2},3) + g(\tfrac{1}{8},-\tfrac{3}{2},1,-\tfrac{3}{2},3) + g(-\beta, -\tfrac{3}{2},0,-\tfrac{5}{2},2) \\ & \quad + g(\tfrac{3}{2},-\tfrac{5}{2},0,-\tfrac{5}{2},3) + g(-\tfrac{1}{32},-\tfrac{1}{2},0,-\tfrac{1}{2},3) + g(\tfrac{1}{4} \beta,-\tfrac{1}{2},0,-\tfrac{3}{2},2)\} \\ & \quad + z^{2 \beta} \{g(\tfrac{1}{2},-\tfrac{5}{2},2,-\tfrac{5}{2},2) + g(-\tfrac{1}{2},-\tfrac{3}{2},0,-\tfrac{3}{2},2) + g(-\tfrac{1}{8},-\tfrac{1}{2},0,-\tfrac{1}{2},2) \} \\ & \quad + g(2 \theta,-\tfrac{1}{2},0,-\tfrac{1}{2},1) + g({-}2,-\tfrac{1}{2},0,\tfrac{1}{2},1). \end{align*}
By simple integral calculation, we get  $P^{0,2}(t,x,z)$ as in Proposition 3.6 from
 $\tau = T-t$ and
 $s = \log ({x}/{K})$.