





1. Introduction
Recent Hele-Shaw cell experiments have enriched the knowledge of Faraday waves (Faraday Reference Faraday1831). Researchers have uncovered a new type of highly localised standing waves, referred to as oscillons, that are both steep and solitary-like in nature (Rajchenbach, Leroux & Clamond Reference Rajchenbach, Leroux and Clamond2011). These findings have spurred further experimentations with Hele-Shaw cells filled with one or more liquid layers, using a variety of fluids, ranging from silicone oil and water–ethanol mixtures to pure ethanol (Li et al. Reference Li, Li, Liao and Chen2018b). Through these experiments, new combined patterns produced by triadic interactions of oscillons were discovered by Li, Xu & Liao (Reference Li, Xu and Liao2014). Additionally, another new family of waves was observed in a cell filled solely with pure ethanol and at extremely shallow liquid depths (Li, Yu & Liao Reference Li, Yu and Liao2015; Li, Li & Liao Reference Li, Li and Liao2016).
All these findings contribute to the understanding of the wave behaviour in Hele-Shaw configurations and call for a reliable stability theory that can explain and predict the instability onset for the emergence of initial wave patterns.
Notwithstanding two-dimensional direct numerical simulations, Ubal, Giavedoni & Saita (Reference Ubal, Giavedoni and Saita2003) and Périnet et al. (Reference Périnet, Falcón, Chergui, Juric and Shin2016) have been able to qualitatively replicate standing wave patterns reminiscent of those observed in experiments (Li et al. Reference Li, Xu and Liao2014), these simulations overlook the impact of wall attenuation, hence resulting in a simplified model that cannot accurately predict the instability regions (Benjamin & Ursell Reference Benjamin and Ursell1954; Kumar & Tuckerman Reference Kumar and Tuckerman1994) and is therefore not suitable for modelling Hele-Shaw flows. On the other hand, attempting to conduct three-dimensional simulations of fluid motions in a Hele-Shaw cell poses a major challenge due to the high computational cost associated with the narrow dimension of the cell, which requires a smaller grid cell size to capture the shear dissipation accurately. Consequently, the cost of performing such simulations increases rapidly as the cell gap narrows.
In order to tackle the challenges associated with resolving fluid dynamics within such systems, researchers have utilised Darcy's law as an approach to treating the confined fluid between two vertical walls. This approximation, also used in the context of porous media, considers the fluid to be flowing through a porous medium, resulting in a steady parabolic flow in the short dimension. When gap-averaging the linearised Navier–Stokes equation, this approximation translates into a damping coefficient  $\sigma$ that scales as
 $12\nu /b^2$, with
 $\nu$ the fluid kinematic viscosity and
 $b$ the cell's gap size, which represents the boundary layer dissipation at the lateral walls. However, Darcy's model is known to be inaccurate when convective and unsteady inertial effects are not negligible, such as in waves (Kalogirou, Moulopoulou & Bokhove Reference Kalogirou, Moulopoulou and Bokhove2016). It is challenging to reintroduce convective terms consistently into the gap-averaged Hele-Shaw equations from a mathematical standpoint (Ruyer-Quil Reference Ruyer-Quil2001; Plouraboué & Hinch Reference Plouraboué and Hinch2002; Luchini & Charru Reference Luchini and Charru2010).
In their research, Li et al. (Reference Li, Li, Hen, Xie and Liao2018a) applied the Kelvin–Helmholtz–Darcy theory proposed by Gondret & Rabaud (Reference Gondret and Rabaud1997) to reintroduce advection and derive the nonlinear gap-averaged Navier–Stokes equations. These equations were then implemented in the open-source code Gerris developed by Popinet (Reference Popinet2003, Reference Popinet2009) to simulate Faraday waves in a Hele-Shaw cell. Although this gap-averaged model was compared with several experiments and demonstrated fairly good agreement, it should be noted that the surface tension term remains two-dimensional, as the out-of-plane interface shape is not directly taken into account. Recently, Rachik & Aniss (Reference Rachik and Aniss2023) have studied the effects of finite depth and surface tension on the linear and weakly nonlinear stability of the Faraday waves in Hele-Shaw cells, but the out-of-plane curvature was not retained. This simplified treatment neglects the contact line dynamics and may lead to miscalculations in certain situations. Advances in this direction were made by Li, Li & Liao (Reference Li, Li and Liao2019), who found that the out-of-plane capillary forces associated with the meniscus curvature across the thin-gap direction should be retained in order to improve the description of the wave dynamics, as experimental evidence suggests. By employing a more sophisticated model, coming from molecular kinetics theory (Blake Reference Blake1993; Hamraoui et al. Reference Hamraoui, Thuresson, Nylander and Yaminsky2000; Blake Reference Blake2006) and similar to the macroscopic model introduced by Hocking (Reference Hocking1987), they included the capillary contact line motion arising from the small scale of the gap size between the two walls of a Hele-Shaw cell and they derived a novel dispersion relation, which indeed better predicts the observed instability onset.
However, discrepancies in the instability thresholds were still found. This mismatch was tentatively attributed to factors that are not accounted for in the gap-averaged model, such as the extra dissipation on the lateral walls in the elongated direction. Of course, a laboratory-scale experiment using a rectangular cell cannot entirely replace an infinite-length model. Still, if the container is sufficiently long, this extra dissipation should be negligible. Other candidates for the mismatch between theory and experiments were identified in the phenomenological contact line model or free surface contaminations.
If these factors can certainly be sources of discrepancies, we believe that a pure hydrodynamic effect could be at the origin of the discordance between theory and experiments in the first place.
Despite that the use of the Darcy approximation is well-assessed in the literature, the choice of a steady Poiseuille flow profile as an ansatz to build the gap-averaged model appears in fundamental contrast with the unsteady nature of oscillatory Hele-Shaw flows, such as Faraday waves. At low enough oscillation frequencies or for sufficiently viscous fluids, the thickness of the oscillating Stokes boundary layer becomes comparable to the cell gap: the Stokes layers over the lateral solid faces of the cell merge and eventually invade the entire fluid bulk. The Poiseuille profile gives an adequate flow description in such scenarios, but this prerequisite is rarely met in the above-cited experimental campaigns. It appears, thus, very natural to ask oneself whether a more appropriate description of the oscillating boundary layer impacts the prediction of stability boundaries. This study is precisely devoted to answering this question by proposing a revised gap-averaged Floquet analysis based on the classical Womersley-like solution for the pulsating flow in a channel (Womersley Reference Womersley1955; San & Staples Reference San and Staples2012).
Following the approach taken by Viola, Gallaire & Dollet (Reference Viola, Gallaire and Dollet2017), we examine the impact of inertial effects on the instability threshold of Faraday waves in Hele-Shaw cells, with a focus on the unsteady term of the Navier–Stokes equations. This scenario corresponds to a pulsatile flow where the fluid's motion reduces to a two-dimensional oscillating channel flow, which seems better suited than the steady Poiseuille profile to investigate the stability properties of the system. When gap-averaging the linearised Navier–Stokes equation, this results in a modified damping coefficient becoming a function of the ratio between the Stokes boundary layer thickness and the cell's gap, and whose complex value will depend on the frequency of the wave response specific to each unstable parametric region.
First, we consider the case of horizontally infinite rectangular Hele-Shaw cells by also accounting for the same dynamic contact angle model employed by Li et al. (Reference Li, Li and Liao2019) so as to quantify the predictive improvement brought by the present theory. A vis-à-vis comparison with experiments by Li et al. (Reference Li, Li and Liao2019) points out how the standard Darcy model often underestimates the Faraday threshold. In contrast, the present theory can explain and close the gap with these experiments.
The analysis is then extended to the case of thin annuli. This less common configuration has already been used to investigate oscillatory phase modulation of parametrically forced surface waves (Douady, Fauve & Thual Reference Douady, Fauve and Thual1989) and drift instability of cellular patterns (Fauve, Douady & Thual Reference Fauve, Douady and Thual1991). For our interest, an annular cell is convenient as it naturally filters out the extra dissipation that could take place on the lateral boundary layer in the elongated direction, hence allowing us to reduce the sources of extra uncontrolled dissipation and perform a cleaner comparison with experiments. Our homemade experiments for this configuration highlight how Darcy's theory overlooks a frequency detuning that is essential to correctly predict the locations of the Faraday tongues in the frequency spectrum. These findings are well rationalised and captured by the present model.
The paper is organised as follows. In § 2, we revisit the classical case of horizontally infinite rectangular Hele-Shaw cells. The present model is compared with theoretical predictions from the standard Darcy theory and existing experiments. The case of thin annuli is then considered. The model for the latter unusual configuration is formulated in § 3 and compared with homemade experiments in § 4. Conclusions are outlined in § 5.
2. Horizontally infinite Hele-Shaw cells
Let us begin by considering the case of a horizontally infinite Hele-Shaw cell of width  $b$ filled to a depth
 $h$ with an incompressible fluid of density
 $\rho$, dynamic viscosity
 $\mu$ (kinematic viscosity
 $\nu =\mu /\rho$) and liquid–air surface tension
 $\gamma$ (see also the sketch in figure 1a). The vessel undergoes a vertical sinusoidal oscillation of amplitude
 $a$ and angular frequency
 $\varOmega$. In a frame of reference which moves with the oscillating container, the free liquid interface is flat and stationary for small forcing amplitudes, and the oscillation is equivalent to a temporally modulated gravitational acceleration,
 $G(t')=g-a\varOmega ^2\cos {\varOmega t'}$. The equations of motion for the fluid bulk are
 \begin{equation}
\rho\left(\frac{\partial \boldsymbol{U}'}{\partial
t'}+\boldsymbol{U}'\boldsymbol{\cdot}\boldsymbol{\nabla}'\boldsymbol{U}'\right)={-}\boldsymbol{\nabla}'
P' + \mu\nabla'^2\boldsymbol{U}'-\rho
G\left(t\right)\boldsymbol{e}_z,\quad
\boldsymbol{\nabla}'\boldsymbol{\cdot}\boldsymbol{U}'=0.
\end{equation}
Linearising about the rest state  $\boldsymbol {U}'=\boldsymbol {0}$ and
 $P'(z',t')=-\rho G(t') z'$, the equations for the perturbation velocity,
 $\boldsymbol {u}'(x',y',z',t')=\{u',v',w'\}^{\rm T}$, and pressure,
 $p'(x',y',z',t')$, fields, associated with a certain perturbation's wavelength
 $l=2{\rm \pi} /k$ (
 $k$, wavenumber), read
 \begin{equation} \rho\frac{\partial\boldsymbol{u}'}{\partial t'}={-}\boldsymbol{\nabla}' p' + \mu{\nabla'^{2}}\boldsymbol{u}',\quad \boldsymbol{\nabla}'\boldsymbol{\cdot}\boldsymbol{u}'=0. \end{equation}
Assuming that  $bk\ll 1$, then the velocity along the narrow
 $y'$-dimension
 $v'\ll u',w'$ and, by employing the Hele-Shaw approximation as in, for instance, Viola et al. (Reference Viola, Gallaire and Dollet2017), one can simplify the linearised Navier–Stokes equations as follows:
 \begin{gather} \frac{\partial u'}{\partial x'} + \frac{\partial v'}{\partial y'} + \frac{\partial w'}{\partial z'} = 0, \end{gather}
 \begin{gather} \rho\frac{\partial u'}{\partial t'} ={-}\frac{\partial p'}{\partial x'} + \mu \frac{\partial^2 u'}{\partial y'^2},\quad \rho\frac{\partial w'}{\partial t'} ={-}\frac{\partial p'}{\partial z'} + \mu \frac{\partial^2 w'}{\partial y'^2},\quad \frac{\partial p'}{\partial y'}=0. \end{gather}
Equations (2.3a)–(2.3b) are made dimensionless using  $k^{-1}$ for the directions
 $x'$ and
 $z'$, and
 $b$ for
 $y'$. The forcing amplitude and frequency provide a scale
 $a\varOmega$ for the in-plane
 $xz$-velocity components, whereas the continuity equation imposes the transverse component
 $v'$ to scale as
 $v'\sim bk a\varOmega \ll a\varOmega \sim u'$, due to the strong confinement in the
 $y$-direction (
 $bk\ll 1$). With these choices, dimensionless spatial scales, velocity components and pressure write
 \begin{align} \begin{gathered} x=x'k,\quad
y=\frac{y'}{b},\quad z=z' k,\quad
u=\frac{u'}{a\varOmega},\quad v=\frac{v'}{bk
a\varOmega},\quad w=\frac{w'}{a\varOmega},\nonumber\\ \quad
p=\frac{kp'}{\rho a\varOmega^2},\quad t=\varOmega t'.\end{gathered}
\end{align}
The first two equations in (2.3b) in non-dimensional form are
 \begin{equation} \frac{\partial u}{\partial t}={-}\frac{\partial p}{\partial x}+\frac{\delta_{St}^2}{2} \frac{\partial^2 u}{\partial y^2},\quad \frac{\partial w}{\partial t}={-}\frac{\partial p}{\partial z}+\frac{\delta_{St}^2}{2} \frac{\partial^2 w}{\partial y^2}, \end{equation}
where  $\delta _{St}=\delta _{St}'/b$ and with
 $\delta _{St}'=\sqrt {2\nu /\varOmega }$ denoting the thickness of the oscillating Stokes boundary layer. The ratio
 $\sqrt {2}/\delta _{St}$ is also commonly referred to as the Womersley number,
 $Wo=b\sqrt {\varOmega /\nu }$ (Womersley Reference Womersley1955; San & Staples Reference San and Staples2012).
(a) Sketch of Faraday waves in a rectangular Hele-Shaw cell of width  $b$ and length
 $l$ filled to a depth
 $h$ with a liquid. Here
 $b$ denotes the gap size of the Hele-Shaw cell,
 $l$ is the wavelength of a certain wave, such that
 $b/l\ll 1$, and
 $\theta$ is the dynamic contact angle of the liquid on the lateral walls. The vessel undergoes a vertical sinusoidal oscillation of amplitude
 $a$ and angular frequency
 $\varOmega$. The free surface elevation is denoted by
 $\eta '(x')$. (b) Same as (a), but in an annular Hele-Shaw cell with internal and external radii, respectively,
 $R-b/2$ and
 $R+b/2$. Here,
 $b/R\ll 1$ and the free surface elevation is a function of the azimuthal coordinate
 $\varphi '$, i.e.
 $\eta '(\varphi ')$.

2.1. Floquet analysis of the gap-averaged equations
Given its periodic nature, the stability of the base flow, represented by a time-periodic modulation of the hydrostatic pressure, can be investigated via Floquet analysis. We, therefore, introduce the following Floquet ansatz (Kumar & Tuckerman Reference Kumar and Tuckerman1994):
 \begin{gather} \boldsymbol{u}\left(x,y,z,t\right)={\rm e}^{\mu_F t}\sum_{n={-}\infty}^{+\infty}\tilde{\boldsymbol{u}}_n\left(x,y,z\right) {\rm e}^{\text{i}\left(n+\alpha/\varOmega\right) t}={\rm e}^{\mu_F t}\sum_{n={-}\infty}^{+\infty}\tilde{\boldsymbol{u}}_n\left(x,y,z\right) {\rm e}^{\text{i}\xi_n t}, \end{gather}
 \begin{gather} p\left(x,z,t\right)={\rm e}^{\mu_F t}\sum_{n={-}\infty}^{+\infty}\tilde{p}_n\left(x,z\right) {\rm e}^{\text{i}\left(n+\alpha/\varOmega\right) t}={\rm e}^{\mu_F t}\sum_{n={-}\infty}^{+\infty}\tilde{p}_n\left(x,z\right) {\rm e}^{\text{i}\xi_n t}, \end{gather}
where  $\mu _F$ is the real part of the non-dimensional Floquet exponent and represents the growth rate of the perturbation. We have rewritten
 $(n+\alpha /\varOmega )=\xi _n$ to better demonstrate the parametric nature of the oscillation frequency of the wave response. In the following, we will focus on the condition for marginal stability (boundaries of the Faraday tongues), which requires a growth rate
 $\mu _F=0$. In addition, values of
 $\alpha =0$ and
 $\varOmega /2$ correspond, respectively, to harmonic and subharmonic parametric resonances (Kumar & Tuckerman Reference Kumar and Tuckerman1994). This implies that
 $\xi _n$ is a parameter whose value is either
 $n$, for harmonics, or
 $n+1/2$, for subharmonics, with
 $n$ an integer
 $n=0,1,2,\ldots$ specific to each Fourier component in (2.6a)–(2.6b).
By substituting the ansatzes (2.6a)–(2.6b) in (2.4a–h), we find that each component of the Fourier series must satisfy
 \begin{equation} \forall n: \quad\text{i}\xi_n \tilde{u}_n={-}\frac{\partial \tilde{p}_n}{\partial x}+\frac{\delta_{St}^2}{2} \frac{\partial^2 \tilde{u}_n}{\partial y^2},\quad \text{i}\xi_n \tilde{w}_n={-}\frac{\partial \tilde{p}_n}{\partial z}+\frac{\delta_{St}^2}{2} \frac{\partial^2 \tilde{w}_n}{\partial y^2}, \end{equation}
which, along with the no-slip condition at  $y=\pm 1/2$, correspond to a two-dimensional pulsatile Poiseuille flow with solution
 \begin{align} \tilde{u}_n=\frac{\text{i}}{\xi_n}\frac{\partial \tilde{p}_n}{\partial x}\, F_n\left(y\right),\quad \tilde{w}_n=\frac{\text{i}}{\xi_n}\frac{\partial \tilde{p}_n}{\partial z}\, F_n\left(y\right),\quad F_n\left(y\right)=\left(1-\frac{\cosh{\left(\left(1+\text{i}\right)y/\delta_n\right)}}{\cosh{\left(\left(1+\text{i}\right)/2\delta_n\right)}}\right), \end{align}
and where  $\delta _n=\delta _{St}/\sqrt {\xi _n}$ is a rescaled Stokes boundary layer thickness specific to the
 $n$th Fourier component. The function
 $F_n(y)$ is displayed in figure 2(b), which depicts how a decrease in the value of
 $\delta _n$ starting from large values corresponds to a progressive transition from a fully developed flow profile to a plug flow connected to thin boundary layers.
(a) Real and imaginary (Imag) parts of the complex auxiliary coefficient  $\chi =\chi _r+\text {i}\chi _i$ versus twice the non-dimensional Stokes boundary layer thickness
 $\delta$. The horizontal black dotted line indicates the constant value
 $12$ given by the Darcy approximation. (b) Normalised profile
 $F(y)$ (Womersley profile) for different
 $\delta =b^{-1}\sqrt {2\nu /\xi \varOmega }$, whose values are specified by the filled circles in (a) with matching colours. The Poiseuille profile is also reported for completeness. In drawing these figures, we let the oscillation frequency of the wave,
 $\xi \varOmega$, be free to assume any value, but we recall that the parameter
 $\xi$ can only assume discrete values, and so do
 $\chi$ and
 $F(y)$.

The gap-averaged velocity along the  $y$-direction satisfies a Darcy-like equation,
 \begin{equation} \langle\tilde{\boldsymbol{u}}_n\rangle=\int_{{-}1/2}^{1/2}\tilde{\boldsymbol{u}}_n\,\text{d}y=\frac{\text{i}\beta_n}{\xi_n}\boldsymbol{\nabla} \tilde{p}_n,\quad \beta_n=1-\frac{2\delta_n}{1+\text{i}}\tanh{\frac{1+\text{i}}{2\delta_n}}. \end{equation}
To obtain a governing equation for the pressure  $\tilde {p}_n$, we average the continuity equation and we impose the impermeability condition for the spanwise velocity,
 $v=0$ at
 $y=\pm 1/2$,
 \begin{equation} \frac{\partial \langle\tilde{u}_n\rangle}{\partial x}+\underbrace{\int_{{-}1/2}^{1/2}\frac{\partial \tilde{v}_n}{\partial y}\,\text{d} y}_{\tilde{v}_n\left(1/2\right)-\tilde{v}_n\left({-}1/2\right)=0}+\,\frac{\partial \langle\tilde{w}_n\rangle}{\partial z}=\boldsymbol{\nabla}\boldsymbol{\cdot}\langle\tilde{\boldsymbol{u}}_n\rangle=0. \end{equation}
Since  $\langle \tilde {\boldsymbol {u}}_n\rangle =\text {i}(\beta _n/\xi _n) \boldsymbol {\nabla } \tilde {p}_n$, the pressure field
 $\tilde {p}_n$ must obey the Laplace equation
 \begin{equation} \nabla^2 \tilde{p}_n=\frac{\partial^2 \tilde{p}_n}{\partial x^2}+\frac{\partial^2 \tilde{p}_n}{\partial z^2}=0. \end{equation}
It is now useful to expand each Fourier component  $\tilde {p}_n(x,z)$ in the infinite
 $x$-direction as
 $\sin {x}$ such that the
 $y$-average implies
 \begin{gather} \tilde{p}_n\left(x,z\right)=\hat{p}_n\left(z\right) \sin{x}, \end{gather}
 \begin{gather} \langle\tilde{u}_n\rangle={\frac{\text{i}\beta_n}{\xi_n} \hat{p}_n\cos{x}=\hat{u}_n\cos{x}},\quad \langle\tilde{w}_n\rangle={\frac{\text{i}\beta_n}{\xi_n} \frac{\partial \hat{p}_n}{\partial z}\sin{x}=\hat{w}_n\sin{x}.} \end{gather}
Replacing (2.12a) in (2.11) leads to
 \begin{equation} \left(\frac{\partial^2 }{\partial z^2}-1\right)\hat{p}_n=0, \end{equation}
which admits the solution form
 \begin{equation} \hat{p}_n=c_{1}\cosh{z}+c_{2}\sinh{z}. \end{equation}
The presence of a solid bottom imposes that  $\hat {w}_n=0$ and, therefore, that
 $\partial \hat {p}_n/\partial z=0$, at a non-dimensional fluid depth
 $z=-hk$, hence giving
 \begin{equation} \hat{p}_n=c_{1}\left[\cosh{z}+\tanh{kh}\sinh{z}\right]. \end{equation}
Let us now invoke the kinematic boundary condition linearised around a flat static interface
 \begin{equation} \frac{\partial \eta}{\partial t} =w. \end{equation}
Note that the free surface elevation,  $\eta '(x',y',t')$, has been rescaled by the forcing amplitude
 $a$, i.e.
 $\eta '/a=\eta$, and represents the projection of the bottom of the transverse concave meniscus on the
 $xz$-plane of figure 1(a).
Moreover, by recalling the Floquet ansatzes (2.6a)–(2.6b) (with  $\mu _F=0$), here specified for the interface, we get an equation for each Fourier component
 $n$,
 \begin{equation} \eta=\sum_{n={-}\infty}^{+\infty}\tilde{\eta}_n {\rm e}^{\text{i}\xi_n t}. \end{equation}
Expanding  $\tilde {\eta }_n$ in the
 $x$-direction as
 $\sin {x}$ and averaging in
 $y$, i.e.
 $\langle \tilde {\eta }_n\rangle =\hat {\eta }_n$, leads to
 \begin{equation} \forall n : \quad \text{i}\xi_n\hat{\eta}_n=\hat{w}_n=\frac{\text{i}\beta_n}{\xi_n}\left.\frac{\partial \hat{p}_n}{\partial z}\right|_{z=0}=\frac{\text{i}\beta_n}{\xi_n} c_{1}\tanh{kh}\quad \longrightarrow\quad c_{1}=\frac{\xi_n^2}{\beta_n}\frac{\hat{\eta}_n}{\tanh{kh}}. \end{equation}
Lastly, we consider the dynamic equation (normal stress) linearised around a flat nominal interface and evaluated at  $z'=0$,
 \begin{equation} -p'+\rho G\left(t'\right)\eta'+2\mu\frac{\partial w'}{\partial z'}-\gamma \left(\frac{\partial^2\eta'}{\partial x'^2}+\frac{\partial^2\eta'}{\partial y'^2}\right)=0, \end{equation}
with the term in brackets representing the first-order variation of the interface curvature. After turning to non-dimensional quantities using the scaling in (2.4a–h), (2.19) reads
 \begin{equation} -\varOmega^2p+gk\eta-\frac{\gamma}{\rho}k\frac{\partial ^2\eta}{\partial x^2}-\frac{\gamma}{\rho b^2} k \frac{\partial^2 \eta}{\partial y^2}=\frac{a\varOmega^2}{g}gk\eta\cos{t}, \end{equation}
where the viscous stress term has been neglected by analogy with Viola et al. (Reference Viola, Gallaire and Dollet2017), Li et al. (Reference Li, Li, Hen, Xie and Liao2018a) and Li et al. (Reference Li, Li and Liao2019). Indeed, dimensional analysis suggests that such a term scales as  $\delta _{St}^2 k^2b^2$ (with
 $kb\ll 1$), which is therefore negligible compared with the others as soon as
 $\delta _{St}$ is of order
 $\sim O(1)$ or smaller.
The capillary force in the  $x$-direction becomes important only at large enough wavenumbers, although the associated term can be retained in the analysis so as to retrieve the well-known dispersion relation (Saffman & Taylor Reference Saffman and Taylor1958; Chuoke, van Meurs & van der Poel Reference Chuoke, van Meurs and van der Poel1959; McLean & Saffman Reference McLean and Saffman1981; Park & Homsy Reference Park and Homsy1984; Schwartz Reference Schwartz1986; Afkhami & Renardy Reference Afkhami and Renardy2013; Li et al. Reference Li, Li and Liao2019). With the introduction of the Floquet ansatzes (2.6b)–(2.17) and by recalling the
 $x$-expansion of the interface and pressure as
 $\sin {x}$, the averaged normal stress equation becomes
 \begin{align} \forall n:\quad -\varOmega^2\hat{p}_n+\left(1+\frac{\gamma}{\rho g}k^2\right)gk\hat{\eta}_n-\frac{\gamma}{\rho b^2}k\int_{{-}1/2}^{1/2}\frac{\partial^2\tilde{\eta}_n}{\partial y^2}\,\text{d}y=\frac{a\varOmega^2}{2g}gk\left(\hat{\eta}_{n-1}+\hat{\eta}_{n+1}\right), \end{align}
where the decomposition  $\cos {\varOmega t'}=({\rm e}^{\text {i} \varOmega t'}+{\rm e}^{-\text {i}\varOmega t'})/2=({\rm e}^{\text {i} t}+{\rm e}^{-\text {i} t})/2$ has also been used to decompose the right-hand side into the
 $(n-1)$th and
 $(n+1)$th harmonics.
2.1.1. Treatment of the integral contact line term
The treatment of the integral term hides several subtleties. Owing to the antisymmetry of the first derivative of the interface at the two sidewalls, this term can be rewritten as
 \begin{equation} \int_{{-}1/2}^{1/2}\frac{\partial^2\tilde{\eta}_n}{\partial y^2}\,\text{d}y=\left[\frac{\partial\tilde{\eta}_n}{\partial y}\right]_{y={-}1/2}^{y=1/2}=2\left.\frac{\partial\tilde{\eta}_n}{\partial y}\right|_{y=1/2}. \end{equation}
Linking the interface position  $\tilde {\eta }_n(y)$ to the vertical velocity
 $\tilde {w}_n(y)$ given by (2.7a,b) through the kinematic equation (2.16), and then taking their
 $y$-derivative in
 $y=1/2$ to express
 ${\partial \tilde {\eta }_n}/{\partial y}|_{y=1/2}$ seems the natural choice. However, this means assuming that the contact line remains pinned during the motion as
 $\tilde {w}_n$ satisfies the no-slip wall condition at
 $y=\pm 1/2$. Although the scenario of a pinned contact line dynamics (Benjamin & Scott Reference Benjamin and Scott1979; Graham-Eagle Reference Graham-Eagle1983) is experimentally reproducible under controlled edge conditions (Henderson & Miles Reference Henderson and Miles1994; Bechhoefer et al. Reference Bechhoefer, Ego, Manneville and Johnson1995; Howell et al. Reference Howell, Buhrow, Heath, McKenna, Hwang and Schatz2000; Shao et al. Reference Shao, Gabbard, Bostwick and Saylor2021a,Reference Shao, Wilson, Saylor and Bostwickb; Wilson et al. Reference Wilson, Shao, Saylor and Bostwick2022), the most common experimental condition is that of a moving contact line (Benjamin & Ursell Reference Benjamin and Ursell1954; Henderson & Miles Reference Henderson and Miles1990; Batson, Zoueshtiagh & Narayanan Reference Batson, Zoueshtiagh and Narayanan2013; Li et al. Reference Li, Yu and Liao2015, Reference Li, Li and Liao2016, Reference Li, Li and Liao2019; Ward, Zoueshtiagh & Narayanan Reference Ward, Zoueshtiagh and Narayanan2019; Wilson et al. Reference Wilson, Shao, Saylor and Bostwick2022), which is not compatible with the no-slip condition satisfied by
 $\tilde {w}_n$. One natural option would be to relax this no-slip condition by introducing a small slip region in the vicinity of the contact line, within which the flow quickly adapts from a no-slip to a slip condition (Miles Reference Miles1990; Ting & Perlin Reference Ting and Perlin1995). Accounting for this slip region, where the fluid speed relative to the solid is proportional to the viscous stress through a spatially varying slip length, is hardly compatible with the presently proposed depth-averaged modelling.
However, following Li et al. (Reference Li, Li and Liao2019) and Hamraoui et al. (Reference Hamraoui, Thuresson, Nylander and Yaminsky2000), it is possible to get inspiration from the contact line literature and relate the slope  $\partial \tilde {\eta }_n/\partial y|_{y=1/2}$ to the gap-averaged contact line velocity
 $\langle \tilde {w}_n\rangle$ in the averaged sense, drawing a phenomenological analogy with the contact line law referred to as the linear Hocking's model (Hocking Reference Hocking1987). To that purpose, the slope
 $\partial \tilde {\eta }_n/\partial y|_{y=1/2}$ is first related to the dynamic contact angle
 $\theta (t)$ through the geometrical relation
 \begin{equation} \left.\frac{\partial\eta'}{\partial y'}\right|_{y'=b/2}=\cot{\theta}. \end{equation}
Assuming the static interface to be flat means taking the static contact angle  $\theta _s$ equal to
 ${\rm \pi} /2$. Linearisation of (2.23) around
 $\theta _s={\rm \pi} /2$ and substitution of the Floquet ansatz lead, in non-dimensional form, to
 \begin{equation} \forall n:\quad \left.\frac{\partial\tilde{\eta}_n}{\partial y}\right|_{y=1/2}={-}\frac{b}{a}\theta_n, \end{equation}
with  $\theta _n$ representing a small angle variation around
 $\theta _s$ associated with the
 $n$th harmonic.
Defining  $\langle Ca\rangle =(\mu /\gamma ) \langle w'\rangle$, we prescribe
 \begin{equation} \forall n:\quad \theta_n=\frac{M}{\gamma}a\varOmega \langle\tilde{w}_n\rangle=a\frac{M}{\gamma}\text{i}\left(\xi_n\varOmega\right)\hat{\eta}_n. \end{equation}
The friction coefficient  $M$, sometimes referred to as mobility parameter
 $M$ (Xia & Steen Reference Xia and Steen2018), is here not interpreted in the framework of molecular kinetics theory (Voinov Reference Voinov1976; Hocking Reference Hocking1987; Blake Reference Blake1993, Reference Blake2006; Johansson & Hess Reference Johansson and Hess2018) but rather viewed as a constant phenomenological parameter that defines the energy dissipation rate per unit length of the contact line and, as in Li et al. (Reference Li, Li and Liao2019), we use the values proposed by Hamraoui et al. (Reference Hamraoui, Thuresson, Nylander and Yaminsky2000).
In Hocking's model (Hocking Reference Hocking1987), adopting a value of  $M=0$ naturally means considering a contact line freely oscillating with a constant slope, while taking
 $M=+\infty$ simulates the case of a pinned contact line with fixed elevation. In contrast, in the present Hele-Shaw framework, the capillary number can only be defined in terms of averaged interface velocity, so one cannot distinguish the contact line motion from the averaged interface evolution. As a result, the averaged model overlooks the free-to-pinned transition described by Hocking (Reference Hocking1987) at large
 $M$, and somewhat paradoxically, the pinned regime cannot be described with this law.
2.1.2. Modified damping coefficient
Equations (2.15) and (2.18) are finally used to express the dynamic equation as a function of the non-dimensional averaged interface only,
 \begin{align}
&-\frac{\left(\xi_n\varOmega\right)^2}{\beta_n} \hat{\eta}_n
+\text{i}\left(\xi_n\varOmega\right)\frac{2M}{\rho
b}k\tanh{kh}\hat{\eta}_n +
\left(1+\varGamma\right)gk\tanh{kh}\,\hat{\eta}_n\nonumber\\ &\quad =\frac{gk\tanh{kh}}{2}
f\left(\hat{\eta}_{n-1}+\hat{\eta}_{n+1}\right),
\end{align}
with the auxiliary variables  $f=a\varOmega ^2/g$ and
 $\varGamma =\gamma k^2/\rho g$, such that
 $(1+\varGamma )gk\tanh {kh}=\omega _0^2$, the well-known dispersion relation for capillary-gravity waves (Lamb Reference Lamb1993).
As in the present form, the interpretation of coefficient  $\beta _n$ does not appear straightforward, it is useful to define the damping coefficients
 \begin{equation} \sigma_n=\sigma_{BL}+\sigma_{CL},\quad \sigma_{BL}=\chi_n\frac{\nu}{b^2},\quad \sigma_{CL}=\frac{2M}{\rho b}k\tanh{kh}, \end{equation}
where  $\chi _n$ is used to help rewriting
 ${1}/{\beta _n}=1-\text {i}({\delta _n^2}/{2})\chi _n$,
 \begin{equation} \chi_n=\text{i}\frac{2}{\delta_n^2}\left(\frac{1-\beta_n}{\beta_n}\right)=12\left[\frac{\text{i}}{6\delta_n^2}\left( \frac{\dfrac{2\delta_n}{1+\text{i}}\tanh{\dfrac{1+\text{i}}{2\delta_n}}}{1-\dfrac{2\delta_n}{1+\text{i}}\tanh{\dfrac{1+\text{i}}{2\delta_n}}} \right)\right]. \end{equation}
These auxiliary definitions allow one to express (2.26) as
 \begin{equation} {-}\!\left(\xi_n\varOmega\right)^2 \hat{\eta}_n +\text{i}\left(\xi_n\varOmega\right)\sigma_n \hat{\eta}_n + \omega_0^2\hat{\eta}_n= \frac{\omega_0^2}{2\left(1+\varGamma\right)} f\left[\hat{\eta}_{n+1}+\hat{\eta}_{n-1}\right)], \end{equation}
or, equivalently,
 \begin{equation} \frac{2\left(1+\varGamma\right)}{\omega_0^2}\left[-\left(n\varOmega+\alpha\right)^2+\text{i}\left(n\varOmega+\alpha\right)\sigma_n+\omega_0^2\right]\hat{\eta}_n=f \left[\hat{\eta}_{n+1}+\hat{\eta}_{n-1}\right]. \end{equation}
Subscripts  $BL$ and
 $CL$ in (2.27a) denote, respectively, the boundary layers and contact line contributions to the total damping coefficient
 $\sigma _n$.
2.1.3. Results
At the end of this mathematical derivation, a useful result is the modified damping coefficient  $\sigma _n$. Since the boundary layer contribution,
 $\sigma _{BL}$ depends on the
 $n$th Fourier component, the overall damping,
 $\sigma _n$, is mode dependent and its value is different for each specific
 $n$th parametric resonant tongue considered. This starkly contrasts with the standard Darcy approximation, where
 $\sigma _{BL}$ is the same for each resonance and amounts to
 $12\nu /b^2$. In our model, the case of
 $\alpha =0$ with
 $n=0$ constitutes a peculiar case, as
 $\xi _n=\xi _0=0$ and
 $\delta _0\rightarrow +\infty$. In such a situation,
 $F_0(y)$ tends to the steady Poiseuille profile so that we take
 $\chi _0=12$.
Similarly to Kumar & Tuckerman (Reference Kumar and Tuckerman1994), (2.29) is rewritten as
 \begin{equation} A_n\hat{\eta}_n=f\left[\hat{\eta}_{n+1}+\hat{\eta}_{n-1}\right], \end{equation}
with
 \begin{equation} A_n=\frac{2\left(1+\varGamma\right)}{\omega_0^2}\left(-\left(n\varOmega+\alpha\right)^2+\text{i}\left(n\varOmega+\alpha\right)\sigma_n+\omega_0^2\right)=A_n^r+\text{i}A_n^i\in\mathbb{C}. \end{equation}
The non-dimensional amplitude of the external forcing,  $f=a\varOmega ^2/g$ appears linearly, therefore (2.30) can be considered to be a generalised eigenvalue problem
 \begin{equation} \boldsymbol{A}\hat{\boldsymbol{\eta}}=f\boldsymbol{B}\hat{\boldsymbol{\eta}}, \end{equation}
with eigenvalues  $f$ and eigenvectors whose components are the real and imaginary parts of
 $\hat {\eta }_n$ (see Kumar & Tuckerman (Reference Kumar and Tuckerman1994) for the structure of matrices
 $\boldsymbol {A}$ and
 $\boldsymbol {B}$).
For one frequency forcing we use a truncation number  $N=10$, which produces
 $2(N+1)\times 2(N+1) = 22\times 22$ matrices. Eigenproblem (2.32) is then solved in MATLAB using the built-in function eigs and selecting several smallest, real positive values of
 $f$. For a fixed forcing frequency
 $\varOmega$ and wavenumber
 $k$, the eigenvalue with the smallest real part will define the instability threshold. Further details about the numerical convergence as the truncation number
 $N$ varies are given in Appendix A.
Figure 3 shows the results of this procedure for one of the configurations considered by Li et al. (Reference Li, Li and Liao2019) and neglecting the dissipation associated with the contact line motion, i.e.  $M=0$. In each panel, associated with a fixed forcing frequency, the black regions correspond to the unstable Faraday tongues computed using
 $\sigma _{BL}=12\nu /b^2$ as given by Darcy's approximation, whereas the red regions are the unstable tongues computed with the modified
 $\sigma _{BL}=\chi _n\nu /b^2$. At a forcing frequency
 $4\ \text {Hz}$, the first subharmonic tongues computed using the two models essentially overlap. Yet, successive resonances display an increasing departure from Darcy's model due to the newly introduced complex coefficient
 $\sigma _n$. Particularly, the real part of
 $\chi _n$ is responsible for the higher onset acceleration, while the imaginary part is expected to act as a detuning term, which shifts the resonant wavenumbers
 $k$.
Faraday tongues computed via Floquet analysis at different fixed driving frequencies (reported above each panel). Black regions correspond to the unstable Faraday tongues computed using  $\sigma _{BL}=12\nu /b^2$ as in the standard Darcy approximation, whereas red regions are the unstable tongues computed with the present modified
 $\sigma _{BL}=\chi _n\nu /b^2$. For this example, we consider ethanol 99.7 % (see table 1) in a Hele-Shaw cell of gap size
 $b=2\ \text{mm}$ filled to a depth
 $h=60\ \text{mm}$. Here
 $f$ denotes the non-dimensional forcing acceleration,
 $f=a\varOmega ^2/g$, with dimensional forcing amplitude
 $a$ and angular frequency
 $\varOmega$. For plotting, we define a small scale-separation parameter
 $\epsilon = kb/2{\rm \pi}$ and arbitrarily set its maximum acceptable value to 0.2. Contact line dissipation is not included, i.e.
 $M=\sigma _{CL}=0$. The tongues are labelled as follows: SH, subharmonic; H, harmonic.

2.2. Asymptotic approximations
The main result of this analysis consists of the derivation of the modified damping coefficient  $\sigma _n=\sigma _{n,r}+\text {i}\sigma _{n,i}$ associated with each parametric resonance. Aiming at better elucidating how this modified complex damping influences the stability properties of the system, we would like to derive in this section an asymptotic approximation, valid in the limit of small forcing amplitudes, damping and detuning, of the first subharmonic (SH1) and harmonic (H1) Faraday tongues.
Unfortunately, the dependence of  $\sigma _n$ on the parametric resonance considered and, more specifically, on the
 $n$th Fourier component, does not allow one to directly convert the governing equations (2.28), expressed in a discrete frequency domain, back into the continuous temporal domain. By keeping this in mind, we can still imagine fixing the value of
 $\sigma _n$ to that corresponding to the parametric resonance of interest, e.g.
 $\sigma _0$ (with
 $n=0$ and
 $\xi _0\varOmega =\varOmega /2$) for SH1 or
 $\sigma _1$ (with
 $n=1$ and
 $\xi _1\varOmega =\varOmega$) for H1. By considering then that for the SH1 and H1 tongues, the system responds in time as
 $\exp (\text {i}\varOmega t/2)$ and
 $\exp (\text {i}\varOmega t )$, respectively, we can recast, for these two specific cases, (2.28) into a damped Mathieu equation (Benjamin & Ursell Reference Benjamin and Ursell1954; Kumar & Tuckerman Reference Kumar and Tuckerman1994; Müller et al. Reference Müller, Wittmer, Wagner, Albers and Knorr1997)
 \begin{equation} \frac{\partial^2 \hat{\eta}}{\partial t'^2}+\hat{\sigma}_{n}\frac{\partial \hat{\eta}}{\partial t'}+\omega_0^2\left(1-\frac{f}{1+\varGamma}\cos{\varOmega t'}\right)\hat{\eta}=0, \end{equation}
with either  $\hat {\sigma }_{n}=\sigma _0$ (SH1) or
 $\hat {\sigma }_n=\sigma _1$ (H1) and where one can recognise that
 $-(\xi _n\varOmega )^2\hat {\eta }\leftrightarrow \partial ^2\hat {\eta }/\partial t'^2$ and
 $\text {i}(\xi _n\varOmega )\hat {\eta }\leftrightarrow \partial \hat {\eta }/\partial t'$. Asymptotic approximations can be then computed by expanding asymptotically the interface as
 $\hat {\eta }=\hat {\eta }_0+\epsilon \hat {\eta }_1+\epsilon ^2\hat {\eta }_2+\cdots$, with
 $\epsilon$ a small parameter
 $\ll 1$.
2.2.1. First subharmonic tongue
As anticipated above, when looking at the first or fundamental subharmonic tongue (SH1), one should take  $\hat {\sigma }_n\rightarrow \sigma _{0}$ (with
 $\xi _{0}\varOmega =\varOmega /2$), which is assumed small of order
 $\epsilon$. The forcing amplitude
 $f$ is also assumed of order
 $\epsilon$. Furthermore, a small detuning
 $\sim \epsilon$, such that
 $\varOmega =2\omega _0+\epsilon \lambda$, is also considered, and, in the spirit of the multiple time scale analysis, a slow time scale
 $\tau '=\epsilon t'$ (Nayfeh Reference Nayfeh2008) is introduced. At leading order, the solution reads
 $\hat {\eta }_0=A{(\tau ')}{\rm e}^{\text {i}\omega _0 t'}+{\rm c.c.}$, with
 ${\rm c.c.}$ denoting the complex conjugate part. At the second order in
 $\epsilon$, the imposition of a solvability condition necessary to avoid secular terms prescribes the amplitude
 $B{(\tau ')}=A{(\tau ')}{\rm e}^{-\text {i}\lambda {\tau '}/2}$ to obey the following amplitude equation:
 \begin{equation} \frac{{\rm d} B}{{\rm d} {\tau'}}={-}\frac{\sigma_{0}}{2}B-\text{i}\frac{\lambda}{2}B-\text{i}\frac{\omega_0}{4\left(1+\varGamma\right)}f \bar{B}. \end{equation}
Turning to polar coordinates, i.e.  $B=|B|{\rm e}^{\text {i}\varPhi }$, keeping in mind that
 $\sigma _{0}=\sigma _{0,r}+\text {i}\sigma _{0,i}$ and looking for stationary solutions with
 $|B|\ne 0$ (we skip the straightforward mathematical steps), one ends up with the following approximation for the marginal stability boundaries associated with the first subharmonic Faraday tongue:
 \begin{equation} \left(\frac{\varOmega+\sigma_{0,i}}{2\omega_0}-1\right)={\pm}\frac{1}{4\left(1+\varGamma\right)}\sqrt{f^2-\frac{4\sigma_{0,r}^2\left(1+\varGamma\right)^2}{\omega_0^2}}, \end{equation}
whose onset acceleration value,  $\min {f_{1_{SH}}}$, for a fixed driving frequency
 $\varOmega /2{\rm \pi}$, amounts to
 \begin{equation} \min{f_{SH1}} = 2\sigma_{0,r}\sqrt{\frac{1+\varGamma}{gk\tanh{kh}}}\approx 2\sigma_{0,r}\sqrt{\frac{1}{g}\left(\frac{1}{k}+\frac{\gamma}{\rho g}k \right)}. \end{equation}
Note that the final approximation on the right-hand side of (2.36) only holds if  $kh\gg 1$, so that
 $\tanh {kh}\approx 1$ (deep-water regime). Given that
 $\chi _{0,r}>12$ and
 $\chi _{0,i}>0$ always, the asymptotic approximation (2.36), in its range of validity, suggests that Darcy's model underestimates the subharmonic stability threshold. Moreover, from (2.35), the critical wavenumber
 $k$, associated with
 $\min {f_{SH1}}$, would correspond to that prescribed by the Darcy approximation but at an effective forcing frequency
 $\varOmega +\sigma _{0,i}=2 \omega _0$ instead of at
 $\varOmega =2\omega _0$. This explains why the modified tongues appear to be shifted towards higher wavenumbers. These observations are clearly visible in figure 4.
First subharmonic and harmonic Faraday tongues at a driving frequency  $1/T=18\ \text{Hz}$ (where
 $T$ is the forcing period) for the same configuration of figure 3. Black and red regions show unstable tongues computed via Floquet analysis by using, respectively,
 $\sigma _{BL}=12\nu /b^2$ and the modified
 $\sigma _{BL}=\chi _1\nu /b^2$ from the present model. Dashed and solid light-blue lines correspond to the asymptotic approximations according to (2.35)–(2.38).

2.2.2. First harmonic tongue
By analogy with § 2.2.1, an analytical approximation of the first harmonic tongue (H1) can be provided. In the same spirit of Rajchenbach & Clamond (Reference Rajchenbach and Clamond2015), we adapt the asymptotic scaling such that  $f$ is still of order
 $\epsilon$, but
 ${\tau '=\epsilon ^2 t'}$,
 $\hat {\sigma }_n=\sigma _1\sim \epsilon ^2$ (with
 $\xi _{1}\varOmega =\varOmega$) and
 $\varOmega =\omega _0+\epsilon ^2\lambda$. Pursuing the expansion up to
 $\epsilon ^2$-order, with
 $\hat {\eta }_0=A{(\tau ')}{\rm e}^{\text {i}\omega _0 t'}+{\rm c.c.}$ and
 $B{(\tau ')}=A{(\tau ')}{\rm e}^{-\text {i}\lambda {\tau '}}$, will provide the amplitude equation
 \begin{equation} \frac{{\rm d} B}{{\rm d} {\tau'}}={-}\frac{\sigma_{1}}{2}B-\text{i}\lambda B-\text{i}\frac{\omega_0}{8\left(1+\varGamma\right)^2}f^2 \bar{B}+\text{i}\frac{\omega_0}{12\left(1+\varGamma\right)^2}f^2 B. \end{equation}
The approximation for the marginal stability boundaries derived from (2.37) takes the form
 \begin{equation} \left(\frac{\varOmega+\sigma_{1,i}/2}{\omega_0}-1\right)=\frac{f^2}{12\left(1+\varGamma\right)^2}\pm\frac{1}{8\left(1+\varGamma\right)^2}\sqrt{f^4-\left(\frac{4\sigma_{1,r}\left(1+\varGamma\right)^2}{\omega_0}\right)^2} \end{equation}
with a minimum onset acceleration,  $\min {f_{1_{H}}}$
 \begin{equation} \min{f_H} = 2\sqrt{\sigma_{1,r}}\left(\frac{\left(1+\varGamma\right)^3}{gk\tanh{kh}}\right)^{1/4}\approx 2\sqrt{\sigma_{1,r}}\frac{1}{g^{1/4}}\left(\frac{1}{k^{1/3}}+\frac{\gamma}{\rho g}k^{5/3}\right)^{3/4}, \end{equation}
and where, as before, the final approximation on the right-hand side is only valid in the deep-water regime. Similarly to the subharmonic case, the critical wavenumber  $k$ corresponds to that prescribed by the Darcy approximation but at an effective forcing frequency
 $\varOmega +\sigma _{1,i}/2=\omega _0$ instead of at
 $\varOmega =\omega _0$ and the onset acceleration is larger than that predicted from the Darcy approximation (as
 $\chi _{1,r}>12$).
2.3. Comparison with experiments by Li et al. (Reference Li, Li and Liao2019)
Results presented so far were produced by assuming the absence of contact line dissipation, i.e. coefficient  $M$ was set to
 $M=0$ so that
 $\sigma _{CL}=0$. In this section, we reintroduce such a dissipative contribution and we compare our theoretical predictions with a set of experimental measurements reported by Li et al. (Reference Li, Li and Liao2019), using the values they have proposed for
 $M$. This comparison, shown in figure 5, is outlined in terms of non-dimensional minimum onset acceleration,
 $\min {f}=\min {f_{SH1}}$, versus driving frequency. These authors performed experiments in two different Hele-Shaw cells of length
 $l=300\ \text{mm}$, fluid depth
 $h=60\ \text{mm}$ and gap size
 $b=2\ \text{mm}$ or
 $b=5\ \text{mm}$. Two fluids, whose properties are reported in table 1, were used: ethanol 99.7 % and ethanol 50 %. The empty squares in figure 5 are computed via Floquet stability analysis (2.32) using the Darcy approximation for
 $\sigma _{BL}=12\nu /b^2$ and correspond to the theoretical prediction by Li et al. (Reference Li, Li and Liao2019), while the coloured triangles are computed using the present theory, with the corrected
 $\sigma _{BL}=\chi _n\nu /b^2$. Although the trend is approximately the same, the Darcy approximation underestimates the onset acceleration with respect to the present model, which overall compares better with the experimental measurements (black-filled circles). Some disagreement still exists, especially at smaller cell gaps, i.e.
 $b=2\ \text{mm}$, where surface tension effects are even more prominent. This is likely attributable to an imperfect phenomenological contact line model (Bongarzone, Viola & Gallaire Reference Bongarzone, Viola and Gallaire2021; Bongarzone et al. Reference Bongarzone, Viola, Camarri and Gallaire2022b), whose definition falls beyond the scope of this work. Yet, this comparison shows how the modifications introduced by the present model contribute to closing the gap between theoretical Faraday onset estimates and these experiments.
Subharmonic instability onset,  $\min {f}$, versus driving frequency,
 $1/T$ (where
 $T$ is the forcing period). Comparison between theoretical data (empty squares, standard Darcy model,
 $\sigma _{BL}=12\nu /b^2$; coloured triangles, present model,
 $\sigma _{BL}=\chi _n\nu /b^2$) and experimental measurements (Exp.) by Li et al. (Reference Li, Li and Liao2019). The values of the mobility parameter
 $M$ here employed are reported in the figure.

Characteristic fluid parameters for the three ethanol–water mixtures considered in this study. Data for the pure ethanol and ethanol–water mixture (50 %) are taken from Li et al. (Reference Li, Li and Liao2019). The value of the friction parameter  $M$ for ethanol 70 % is fitted from the experimental measurements reported in § 4, but lies well within the range of values used by Li et al. (Reference Li, Li and Liao2019) and agrees with the linear trend displayed in figure 5 of Hamraoui et al. (Reference Hamraoui, Thuresson, Nylander and Yaminsky2000).

3. The case of thin annuli
We now consider the case of a thin annular container, whose nominal radius is  $R$ and the actual inner and outer radii are
 $R-b/2$ and
 $R+b/2$, respectively (see the sketch in figure 1b). In the limit of
 $b/R\ll 1$, the wall curvature is negligible and the annular container can be considered a Hele-Shaw cell. The following change of variable for the radial coordinate,
 $r'=R+y'=R(1+y'/R)$ with
 $y'\in [-b/2,b/2]$, will be useful in the rest of the analysis. As in § 2, we first linearise around the rest state. Successively, we introduce the following non-dimensional quantities:
 \begin{align} r=\frac{r'}{R},\quad y=\frac{y'}{b},\quad z=\frac{z'}{R},\quad u=\frac{u_{\varphi}'}{a\varOmega},\quad v=\frac{u_r'}{a\varOmega\left(b/R\right)},\quad w=\frac{u_z'}{a\varOmega},\quad p=\frac{p'}{\rho Ra\varOmega^2}. \end{align}
It follows that, at leading order,  $r=1+yb/R\sim 1\longrightarrow 1/r=1/(1+yb/R)\sim 1$ but
 $\partial /\partial _r=(R/b)\partial /\partial _y\sim (b/R)^{-1}\gg 1$. With this scaling and introducing the Floquet ansatzes (2.6a)–(2.6b), one obtains the following simplified governing equations:
 \begin{gather} \frac{\partial \tilde{u}_n}{\partial \varphi}+\frac{\partial \tilde{v}_n}{\partial y}+\frac{\partial \tilde{w}_n}{\partial z}=0, \end{gather}
 \begin{gather} \text{i}\tilde{u}_n={-}\frac{1}{\xi_n}\frac{\partial \tilde{p}_n}{\partial \varphi}+\frac{\delta_{n}^2}{2}\frac{\partial ^2 \tilde{u}_n}{\partial y^2},\quad \text{i} \tilde{w}_n={-}\frac{1}{\xi_n}\frac{\partial \tilde{p}_n}{\partial z}+\frac{\delta_{n}^2}{2}\frac{\partial ^2 \tilde{w}_n}{\partial y^2}\quad \text{or}\quad \tilde{\boldsymbol{u}}_n=\frac{\text{i}}{\xi_n}\boldsymbol{\nabla} \tilde{p}_n F_n\left(y\right), \end{gather}
which are fully equivalent to those for the case of conventional rectangular cells if the transformation  $\varphi \rightarrow x$ is introduced. Averaging the continuity equation with the imposition of the no-penetration condition at
 $y=\mp 1/2$,
 $v(\mp 1/2)$, eventually leads to
 \begin{equation} \nabla^2 \tilde{p}_n=\frac{\partial^2 \tilde{p}_n}{\partial z^2}+\frac{\partial^2 \tilde{p}_n}{\partial \varphi^2}, \end{equation}
identically to (2.11). Expanding  $\tilde {p}_n$ in the azimuthal direction as
 $\tilde {p}_n=\hat {p}_n\sin {m\varphi }$, with
 $m$ the azimuthal wavenumber, provides
 \begin{equation} \left(\frac{\partial^2}{\partial z^2}-m^2\right)\hat{p}_n=0\quad \longrightarrow\quad \hat{p}_n=c_{1}\cosh{mz}+c_{2}\sinh{mz}, \end{equation}
and the no-penetration condition at the solid bottom located at  $z=-h/R$,
 $\hat {w}_n=\partial _z\hat {p}_n=0$, prescribes
 \begin{equation} \hat{p}_n=c_{1}\left(\cosh{mz}+\tanh{mh/R}\sinh{mz}\right). \end{equation}
Although so far the theory for the rectangular and the annular cases is the same, here it is crucial to observe that the axisymmetric container geometry translates into a periodicity condition,
 \begin{equation} \sin{\left({-}m{\rm \pi}\right)}=\sin{\left(m{\rm \pi}\right)}\quad \longrightarrow\quad \sin{m{\rm \pi}}=0, \end{equation}
which always imposes the azimuthal wavenumber to be an integer. In other words, in contradistinction with the case of § 2, where the absence of a lateral wall ideally allows for any wavenumber  $k$, here we have
 $m=0,1,2,3,\ldots \in \mathbb {N}$.
By repeating the calculations outlined in § 2, one ends up with the same (2.29) (and subsequent (2.30)–(2.32)), but where  $\omega _0$ obeys the quantised dispersion relation
 \begin{equation} \omega_0^2=\left(\frac{g}{R}m+\frac{\gamma}{\rho R^3}m^3\right)\tanh{m \frac{h}{R}}=\left(1+\varGamma\right)\frac{g}{R}m\tanh{m \frac{h}{R}}, \end{equation}
with  $\varGamma =\gamma m^2/\rho g R^2$. In this context, a representation of Faraday tongues in the forcing frequency–amplitude plane appears most natural, as each parametric tongue will correspond to a fixed wavenumber
 $m$. Consequently, instead of fixing
 $\varOmega$ and varying the wavenumber, here we solve (2.32) by fixing
 $m$ and varying
 $\varOmega$.
3.1. Floquet analysis and asymptotic approximation
The results from this procedure are reported in figure 6, where, as in figure 3, the black regions correspond to the unstable tongues obtained according to the standard gap-averaged Darcy model, while the red ones are computed using the present theory with the corrected gap-averaged  $\sigma _{BL}=\chi _n\nu /b^2$. The regions with the lowest thresholds in each panel are subharmonic tongues associated with modes from
 $m=1$ to
 $14$. In figure 6(a), no contact line model is included, i.e.
 $M=0$, whereas in figure 6(b) a mobility parameter
 $M=0.0485$ is accounted for. Figure 6(b) shows how the additional contact line dissipation, introduced by
 $\sigma _{CL}\propto m$ (see (2.27a)), dictates the linear-like trend followed by the minimum onset acceleration at larger azimuthal wavenumbers. The use of this specific value for
 $M$ will be clarified in the next section when comparing the theory with dedicated experiments, but a thorough sensitivity analysis to variations of
 $M$ is carried out in Appendix B.
Faraday tongues computed via Floquet analysis (2.32) at different fixed azimuthal wavenumber  $m$ and varying the driving frequency,
 $\varOmega /2/{\rm \pi}$. Black regions correspond to the unstable Faraday tongues computed using
 $\sigma _{BL}=12\nu /b^2$, whereas red regions are the unstable tongues computed with the present modified
 $\sigma _{BL}=\chi _n\nu /b^2$. The fluid parameters used here correspond to those given in table 1 for ethanol 70 %. The gap size is set to
 $b=7\ \text {mm}$, the fluid depth to
 $h=65\ \text {mm}$ and the nominal radius to
 $R=44\ \text {mm}$. Contact line dissipation is included in (b) by accounting for a mobility coefficient
 $M=0.0485$. The regions with the lowest thresholds in each panel are subharmonic tongues associated with modes from
 $m=1$ to
 $14$.

In general, the present model gives a higher instability threshold, consistent with the results reported in the previous section. However, the tongues are here shifted to the left.
The asymptotic approximation for the subharmonic onset acceleration, adapted to this case from (2.35) yields
 \begin{equation} f_{SH1} = 2 \sqrt{\left(1+\varGamma\right)\frac{\sigma_{0,r}^2}{\left(g/R\right)m\tanh{m h/R}}+4\left(1+\varGamma\right)^2\left(\frac{\varOmega+\sigma_{0,i}}{2\omega_0}-1\right)^2}, \end{equation}
with
 \begin{align} \min{f_{SH1}} = 2\sigma_{0,r}\frac{1+\varGamma}{\omega_0}=2\sigma_{0,r}\sqrt{\frac{1+\varGamma}{\left(g/R\right)m\tanh{m h/R}}}\approx 2\sigma_{0,r}\sqrt{\frac{R}{g}\left(\frac{1}{m}+\frac{\gamma}{\rho g R^2}m\right)}, \end{align}
helps us in rationalising the influence of the modified complex damping coefficient.
This apparent opposite correction is a natural consequence of the different representations: varying wavenumber at a fixed forcing frequency (as in figure 3) versus varying forcing frequency at a fixed wavenumber (figure 6). Such a behaviour is clarified by the asymptotic relation (3.8) and, particularly by the term  $(({\varOmega +\sigma _{0,i}})/({2\omega _0})-1)$. In § 2, the analysis is based on a fixed forcing frequency, while the wavenumber
 $k$ and, hence, the natural frequency
 $\omega _0$, are free to vary. The first subharmonic Faraday tongue occurs when
 $\varOmega +\sigma _{0,i} \approx 2\omega _0$. Since
 $\varOmega$ is fixed and
 $\sigma _{0,i}>0$,
 $\varOmega +\sigma _{0,i}>\varOmega$ such that
 $\omega _0$ and therefore
 $k$ have to increase in order to satisfy the relation. On the other hand, if the wavenumber
 $m$ and, hence,
 $\omega _0$ are fixed as in this section, then
 $2\omega _0-\sigma _{0,i}<2\omega _0$ and the forcing frequency around which the subharmonic resonance is centred, decreases by a contribution
 $\sigma _{0,i}$, which introduces a frequency detuning responsible for the negative frequency shift displayed in figure 6.
3.2. Discussion on the system's spatial quantisation
The frequency-dependence of the damping coefficient  $\sigma _{n}$ associated with each Faraday tongue is one of the first aspects that needs to be better discussed. In the case of horizontally infinite cells, the most natural description for investigating the system's stability properties is in the
 $(k,f)$ plane for a fixed forcing angular frequency
 $\varOmega$ (Kumar & Tuckerman Reference Kumar and Tuckerman1994). According to our model, the oscillating system's response occurring within each tongue is characterised by a Stokes boundary layer thickness
 $\delta _n=\sqrt {2\nu /(n\varOmega +\alpha )}/b$. For instance, let us consider subharmonic resonances with
 $\alpha =\varOmega /2$. As
 $\varOmega$ is fixed (see any subpanel of figure 3), each unstable region sees a constant
 $\delta _n$ (with
 $n=0,1,2,\ldots$) and hence a constant damping
 $\sigma _n$.
On the other hand, in the case of quantised wavenumber as for the annular cell of § 3, the most suitable description is in the driving frequency-driving amplitude plane at fixed wavenumber  $m$ (see figure 6) (Batson et al. Reference Batson, Zoueshtiagh and Narayanan2013). In this description, each subharmonic (
 $\alpha =\varOmega /2$) or harmonic (
 $\alpha =\varOmega$)
 $n$th tongue associated with a wavenumber
 $m$, sees a
 $\delta _n$, and thus a
 $\sigma _n$, changing with
 $\varOmega$ along the tongue itself.
4. Experiments
In a real laboratory-scale experiment, the horizontal size of the rectangular cells is never infinite due to the presence of lateral walls in the elongated direction. In such a case, however, the solution form (2.7a,b) prevents the no-slip condition for the in-plane  $xz$-velocity components to be imposed (Viola et al. Reference Viola, Gallaire and Dollet2017). This always translates into a theoretical underestimation of the overall damping of the system in rectangular Hele-Shaw cells, although the sidewall contribution is expected to be negligible for sufficiently long cells.
On the other hand, the case of a thin annulus, by naturally filtering out this extra dissipation owing to the periodicity condition, offers a prototype configuration that can potentially allow one to quantify better the correction introduced by the present gap-averaged model when compared with dedicated experiments.
4.1. Set-up
The experimental apparatus, shown in figure 7, consists of a Plexiglas annular container of height  $100\ \text {mm}$, nominal radius
 $R=44\ \text {mm}$ and gap size
 $b=7\ \text {mm}$. The container is then filled to a depth
 $h=65\ \text {mm}$ with ethanol 70 % (see table 1 for the fluid properties). An air-conditioning system helps in maintaining the temperature of the room at around
 $22^{\circ }$. The container is mounted on a loudspeaker (VISATON TIW 360
 $8\Omega$) placed on a flat table and connected to a wave generator (TEKTRONIX AFG 1022), whose output signal is amplified using a wideband amplifier (THURKBY THANDER WA301). The motion of the free surface is recorded with a digital camera (NIKON D850) coupled with a 60 mm f/2.8D lens and operated in slow-motion mode, allowing for an acquisition frequency of 120 frames per second. A light-emitting diode (LED) panel placed behind the apparatus provides back illumination of the fluid interface for better optimal contrast. The wave generator imposes a sinusoidal alternating voltage,
 $v=(\text {V}_{pp}/2)\cos {(\varOmega t')}$, with
 $\varOmega$ the angular frequency and
 $Vpp$ the full peak-to-peak voltage. The response of the loudspeaker to this input translates into a vertical harmonic motion of the container,
 $a\cos {(\varOmega t')}$, whose amplitude,
 $a\,[\text {mm}]$, is measured with a chromatic confocal displacement sensor (STI CCS PRIMA/CLS-MG20). This optical pen, which is placed around
 $2\ \text {cm}$ (within the admissible working range of
 $2.5\ \text {cm}$) above the container and points at the top flat surface of the outer container's wall, can detect the time-varying distance between the fixed sensor and the oscillating container's surface with a sampling rate of the order of kilohertz and a precision of
 $\pm 1\ \mathrm {\mu }\text {m}$. Thus, the pen can be used to obtain a very precise real-time value of
 $a$ as the voltage amplitude
 $Vpp$ and the frequency
 $\varOmega$ are adjusted.
Photograph of the experimental set-up.

4.2. Identification of the accessible experimental range
Such a simple set-up, however, put some constraints on the explorable experimental frequency range.
(i) First, we must ensure that the loudspeaker's output translates into a vertical container's displacement following a sinusoidal time signal. To this end, the optical sensor is used to measure the container motion at different driving frequencies. These time signals are then fitted with a sinusoidal law. Figure 8 shows how, below a forcing frequency of
 $8\ \text {Hz}$, the loudspeaker's output begins to depart from a sinusoidal signal. This check imposes a first lower bound on the explorable frequency range.
(ii) In addition, as Faraday waves only appear above a threshold amplitude, it is convenient to measure a priori the maximal vertical displacement
$a$ achievable. The loudspeaker response curve is reported in figure 8(b). A superposition of this curve with the predicted Faraday tongues immediately identifies the experimental frequency range within which the maximal achievable $a$ is larger than the predicted Faraday threshold so that standing waves are expected to emerge in our experiments. Assuming the herein proposed gap-averaged model (red regions) to give a good prediction of the actual instability onset, the experimental range explored in the next section is limited to approximately $\in [10.2,15.6]$ Hz.


(a) Vertical container displacement  $a$ versus time at different forcing frequencies. The black curves are the measured signal, while the green dash–dotted curves are sinusoidal fitting. Below a forcing frequency of 8 Hz, the loudspeaker's output begins to depart from a sinusoidal signal. (b) Subharmonic Faraday tongues computed by accounting for contact line dissipation with a mobility parameter
 $M=0.0485$. The light blue curve here superposed corresponds to the maximal vertical displacement
 $a$ achievable with our set-up. With this constraint, Faraday waves are expected to be observable only in the frequency range highlighted in blue.

4.3. Procedure
Given the constraints discussed in § 4.2, experiments have been carried out in a frequency range between 10.2 Hz and 15.6 Hz with a frequency step of 0.1 Hz. For each fixed forcing frequency, the Faraday threshold is determined as follows: the forcing amplitude  $a$ is set to the maximal value achievable by the loudspeaker so as to trigger the emergence of the unstable Faraday wave quickly. The amplitude is then progressively decreased until the wave disappears and the surface becomes flat again.
More precisely, a first quick pass across the threshold is made to determine an estimate of the sought amplitude. A second pass is then made by starting again from the maximum amplitude and decreasing it. When we approach the value determined during the first pass, we perform finer amplitude decrements, and we wait several minutes between each amplitude change to ensure that the wave stably persists. We eventually identify two values: the last amplitude where the instabilities were present (see figure 9a) and the first one where the surface becomes flat again (see figure 9b). Two more runs following an identical procedure are then performed to verify previously found values. Lastly, an average between the smallest unstable amplitude and the largest stable one gives us the desired threshold.
Free surface shape at a forcing frequency  $1/T=11.7\ \text {Hz}$ (here
 $T$ is the forcing period) and corresponding to: (a) the lowest forcing amplitude value,
 $a=0.4693\ \text {mm}$, for which the
 $m=6$ standing wave is present (the figure shows a temporal snapshot); (b) the largest forcing amplitude value,
 $a=0.4158\ \text {mm}$, for which the surface becomes flat and stable again. Despite the small forcing amplitude variation, the change in amplitude is large enough to allow for a visual inspection of the instability threshold with sufficient accuracy.

Once the threshold amplitude value is found for the considered frequency, the output of the wave generator is switched off, the frequency is changed and the steps presented above are repeated for the new frequency. In this way, we always start from a stable configuration, limiting the possibility of nonlinear interaction between different modes.
For each forcing frequency, the two limiting amplitude values, identified as described above, are used to define the error bars reported in figure 10. Those error bars must also account for the optical pen's measurement error ( $0.1\ \mathrm {\mu }\text {m}$), as well as the non-uniformity of the output signal. By looking at the measured average, minimum and maximum amplitude values in the temporal output signal, it is noteworthy that the average value typically deviates from the minimum and maximum by around
 $10\ \mathrm {\mu }\text {m}$. Consequently, we incorporate in the error bars this additional
 $10\ \mathrm {\mu }\text {m}$ of uncertainty in the value of
 $a$. The uncertainty in the frequency of the output signal is not included in the definition of the error bars, as it is tiny, of the order of
 $0.001\ \text {Hz}$.
Experiments (empty circles) are compared with the theoretically predicted subharmonic Faraday threshold computed via Floquet analysis (2.32) for different fixed azimuthal wavenumber  $m$ and according to the standard (black solid lines) and revised (red regions) gap-averaged models. The tongues are computed by including contact line dissipation with a value of
 $M$ equal to
 $0.0485$ as in figures 6(b) and 8. As explained in § 4.3, the vertical error bars indicate the amplitude range between the smallest measured forcing amplitude at which the instability was detected and the largest one at which the surface remains stable and flat. These two limiting values are successively corrected by accounting for the optical pen's measurement error and the non-uniformity of the output signal of the loudspeaker.

4.4. Instability onset and wave patterns
The experimentally detected threshold at each measured frequency is reported in figure 10 in terms of forcing acceleration  $f$ and amplitude
 $a$. Once again, the black unstable regions are calculated according to the standard gap-averaged model with
 $\sigma _{BL}=12\nu /b^2$, whereas red regions are the unstable tongues computed using the modified damping
 $\sigma _{BL}=\chi _n\nu /b^2$. Both scenarios include contact line dissipation
 $\sigma _{CL}=(2M/\rho b)(m/R)\tanh {(mh/R)}$, with a value of
 $M$ equal to
 $0.0485$ for ethanol 70 %. Although, at first, this value has been selected in order to fit our experimental measurements, it is in perfect agreement with the linear relation linking
 $M$ to the liquid's surface tension reported in figure 5 of Hamraoui et al. (Reference Hamraoui, Thuresson, Nylander and Yaminsky2000) and used by Li et al. (Reference Li, Li and Liao2019) (see table 1).
As figure 10 strikingly shows, the present theoretical thresholds match well our experimental measurements. On the contrary, the poor description of the oscillating boundary layer in the classical Darcy model translates into a lack of viscous dissipation. The arbitrary choice of a higher fitting parameter  $M$ value, e.g.
 $M\approx 0.09$ would increase contact line dissipation and compensate for the underestimated Stokes boundary layer one, hence bringing these predictions much closer to experiments; however, such a value would lie well beyond the typical values reported in the literature. Furthermore, the real damping coefficient
 $\sigma _{BL}=12\nu /b^2$ given by the Darcy theory does not account for the frequency detuning displayed by experiments. This frequency shift is instead well captured by the imaginary part of the new damping
 $\sigma _{BL}=\chi _n\nu /b^2$ (with
 $\chi _n=\chi _{n,r}+\text {i}\chi _{n,i}$).
Within the experimental frequency range considered, five different standing waves, corresponding to  $m=5,6,7,8$ and 9, have emerged. The identification of the wavenumber
 $m$ has been performed by visual inspection of the free surface patterns reported in figure 11. Indeed, by looking at a time snapshot, it is possible to count the various wave peaks along the azimuthal direction.
Snapshots of the wave patterns experimentally observed within the subharmonic Faraday tongues associated with the azimuthal wavenumbers  $m=5,6,7,8$ and
 $9$. Here
 $T$ is the forcing period, which is approximately half the oscillation period of the wave response. These patterns appear for: (
 $m=5$)
 $1/T=10.6\ \text {Hz}$,
 $a=0.8\ \text {mm}$; (
 $m=6$)
 $1/T=11.6\ \text {Hz}$,
 $a=1.1\ \text {mm}$; (
 $m=7$)
 $1/T=12.7\ \text {Hz}$,
 $a=0.9\ \text {mm}$; (
 $m=8$),
 $1/T=13.7\ \text {Hz}$,
 $a=0.6\ \text {mm}$; (
 $m=9$)
 $1/T=14.8\ \text {Hz}$,
 $a=0.4\ \text {mm}$. These forcing amplitudes are the maximal achievable at their corresponding frequencies (see figure 8 for the associated operating points). The number of peaks is easily countable by visual inspection of two time-snapshots of the oscillating pattern extracted at
 $t=0,T$ and
 $T/2$. This provides a simple criterion for the identification of the resonant wavenumber
 $m$. See also supplementary movies 1–5 available at https://doi.org/10.1017/jfm.2023.986.

When looking at figure 10, it is worth commenting that on the left-hand sides of the marginal stability boundaries associated with modes  $m=5$ and
 $6$ we still have a little discrepancy between experiments and the model. Particularly, the experimental thresholds are slightly lower than the predicted ones. A possible explanation can be given by noticing that our experimental protocol cannot detect subcritical bifurcations and hysteresis, while such behaviour has been predicted by Douady (Reference Douady1990).
As a side comment, one must keep in mind that the Hele-Shaw approximation remains good only if the wavelength,  $2{\rm \pi} R/m$ does not become too small, i.e. comparable to the cell's gap,
 $b$. In other words, one must check that the ratio
 $m b/2{\rm \pi} R$ is of the order of the small separation-of-scale parameter,
 $\epsilon$. For the largest wavenumber observed in our experiments,
 $m=9$, the ratio
 $m b/2{\rm \pi} R$ amounts to 0.23, which is not exactly small. Yet, the Hele-Shaw approximation is seen to remain fairly good.
The frequency detuning of the Faraday tongues is one of the main results of the present modified gap-averaged analysis. Although experiments match well the predicted subharmonic tongues reported in figure 10, other concomitant effects, such as a non-flat out-of-plane capillary meniscus, can contribute to shifting the natural frequencies and, consequently, the Faraday tongues, towards lower values (Douady Reference Douady1990; Shao et al. Reference Shao, Wilson, Saylor and Bostwick2021b). The present Floquet analysis assumes the static interface to be flat, although figure 9(b) shows that the stable free surface is not flat, but rather curved in the vicinity of the wall, where the meniscus height is approximately 1.5 mm. Bongarzone et al. (Reference Bongarzone, Viola, Camarri and Gallaire2022b) highlighted how a curved static interface can lower the natural frequencies. Since this effect has been ignored in the theoretical modelling, it is important to quantify such a frequency correction in relation to the one captured by the modified complex damping coefficient. This point is carefully addressed in Appendix C, where we demonstrate how the influence of a static capillary meniscus does not significantly modify the natural frequencies of standing waves developing in the elongated (or azimuthal) direction.
4.5. Contact angle variation and thin film deposition
Before concluding, it is worth commenting on why the use of the dynamic contact angle model (2.25) is justifiable and seen to give good estimates of the Faraday thresholds.
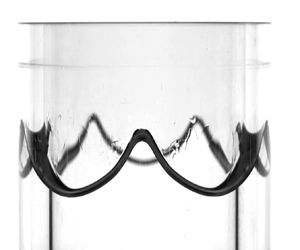
Existing laboratory experiments have revealed that liquid oscillations in Hele-Shaw cells constantly experience an up-and-down driving force with an apparent contact angle  $\theta$ constantly changing (Jiang, Perlin & Schultz Reference Jiang, Perlin and Schultz2004). Our experiments are consistent with such evidence. In figure 12, we report seven snapshots, (figure 12a–g), covering one oscillation period,
 $T$, for the container motion. These snapshots illustrate a zoom of the dynamic meniscus profile and show how the macroscopic contact angle changes in time during the second half of the advancing cycle (figure 12a–e) and the first half of the receding cycle (figure 12f–j), hence highlighting the importance of the out-of-plane meniscus curvature variations. Thus, on the basis of our observations, it seemed appropriate to introduce a contact angle model in the theory to justify this associated additional dissipation, which would be neglected by assuming
 $M=0$. The model used in this study, and already implemented by Li et al. (Reference Li, Li and Liao2019), is very simple; it assumes the cosine of the dynamic contact angle to linearly depend on the capillary number
 $Ca$ (Hamraoui et al. Reference Hamraoui, Thuresson, Nylander and Yaminsky2000). Accounting for such a model is shown, both in Li et al. (Reference Li, Li and Liao2019) and in this study, to supplement the theoretical predictions by a sufficient extra dissipation suitable to match experimental measurements.
Close up of the meniscus dynamics recorded at a driving frequency  $1/11.6\ \text {Hz}$ and amplitude
 $a=1.2\ \text {mm}$ for
 $m=6$. (a–g) Seven snapshots covering one oscillation period,
 $T$, for the container motion are illustrated. These snapshots show how the meniscus profile and the macroscopic contact angle change in time during the second half of the advancing cycle and the first half of the receding cycle, hence highlighting the importance of the out-of-plane curvature or capillary effects. See also supplementary movie 6.

This dissipation eventually reduces to a simple damping coefficient  $\sigma _{CL}$ as it is of linear nature. A unique constant value of the mobility parameter
 $M$ is sufficient to fit all our experimental measurements at once, suggesting that the meniscus dynamics is not significantly affected by the evolution of the wave in the azimuthal direction, i.e. by the wavenumber, and
 $M$ can be seen as an intrinsic property of the liquid–substrate interface.
Several studies have discussed the dependence of the system's dissipation on the substrate material (Huh & Scriven Reference Huh and Scriven1971; Dussan Reference Dussan1979; Cocciaro, Faetti & Festa Reference Cocciaro, Faetti and Festa1993; Ting & Perlin Reference Ting and Perlin1995; Eral, ’t Mannetje & Oh Reference Eral, ’t Mannetje and Oh2013; Viola, Brun & Gallaire Reference Viola, Brun and Gallaire2018; Viola & Gallaire Reference Viola and Gallaire2018; Xia & Steen Reference Xia and Steen2018). These authors, among others, have unveiled and rationalised interesting features such as solid-like friction induced by contact angle hysteresis. This strongly nonlinear contact line behaviour does not seem to be present in our experiments. This can be tentatively explained by looking at figure 13. These snapshots illustrate how the contact line constantly flows over a wetted substrate due to the presence of a stable thin film deposited and alimented at each oscillation cycle. This feature has also been recently described by Dollet, Lorenceau & Gallaire (Reference Dollet, Lorenceau and Gallaire2020), who showed that the relaxation dynamics of liquid oscillation in a U-shaped tube filled with ethanol, due to the presence of a similar thin film, obey an exponential law that can be well-fitted by introducing a simple linear damping, as done in this work.
These three snapshots correspond to snapshots (b–d) of figure 12 and show, using a different light contrast, how the contact line constantly moves over a wetted substrate due to the presence of a stable thin film deposited and alimented at each cycle.

5. Conclusions
Previous theoretical analyses for Faraday waves in Hele-Shaw cells have so far relied on the Darcy approximation, which is based on the parabolic flow profile assumption in the narrow direction and that translates into a real-valued damping coefficient  $\sigma _{BL}=12\nu /b^2$, with
 $\nu$ the fluid kinematic viscosity and
 $b$ the cell's gap size, that englobes the dissipation originated from the Stokes boundary layers over the two lateral walls. However, Darcy's model is known to be inaccurate whenever inertia is not negligible, e.g. in unsteady flows such as oscillating standing or travelling waves.
In this work, we have proposed a gap-averaged linear model that accounts for inertial effects induced by the unsteady terms in the Navier–Stokes equations, amounting to a pulsatile flow where the fluid motion reduces to a two-dimensional oscillating flow, reminiscent of the Womersley flow in cylindrical pipes. When gap-averaging the linearised Navier–Stokes equation, this results in a modified damping coefficient,  $\sigma _{BL}=\chi _n\nu /b^2$, with
 $\chi _n=\chi _{n,r}+{\rm i}\chi _{n,i}$ complex-valued, which is a function of the ratio between the Stokes boundary layer thickness and the cell's gap size, and whose value depends on the frequency of the system's response specific to each unstable parametric Faraday tongue.
After having revisited the ideal case of infinitely long rectangular Hele-Shaw cells, for which we have found a good agreement with the experiments by Li et al. (Reference Li, Li and Liao2019), we have considered the case of Faraday waves in thin annuli. Due to the periodicity condition, this annular geometry naturally filters out the additional, although small, dissipation coming from the lateral wall in the elongated direction of finite-size laboratory-scale Hele-Shaw cells. Hence, a thin annulus offers a prototype configuration that can allow one to quantify better the correction introduced by the present gap-averaged theory when compared with dedicated experiments and to the standard gap-averaged Darcy model.
A series of homemade experiments for the latter configuration has proven that Darcy's model typically underestimates the Faraday threshold, as  $\chi _{n,r}>12$, and overlooks a frequency detuning introduced by
 $\chi _{n,i}>0$, which appears essential to correctly predict the location of the Faraday tongue in the frequency spectrum. The frequency-dependent gap-averaged model proposed here successfully predicts these features and brings the Faraday thresholds estimated theoretically closer to the ones measured.
Furthermore, a close look at the experimentally observed meniscus and contact angle dynamics highlighted the importance of the out-of-plane curvature, whose contribution has been neglected so far in the literature, with the exception of Li et al. (Reference Li, Li and Liao2019). This evidence justifies the employment of a dynamical contact angle model to recover the extra contact line dissipation and close the gap with experimental measurements.
A natural extension of this work is to examine the existence of a drift instability at higher forcing amplitudes.
Supplementary movies
Supplementary movies 1–5 show the time evolution of the free surface associated with the snapshots reported in figure 11. Supplementary movie 6 provides instead a better visualisation of the meniscus and the thin film dynamics as illustrated in figures 12 and 13 of this paper.
Supplementary movies are available at https://doi.org/10.1017/jfm.2023.986.
Acknowledgements
We acknowledge S.V. Djambov for the fruitful discussion about the meniscus dynamics in the Hele-Shaw limit.
Funding
We acknowledge the Swiss National Science Foundation under grant 178971.
Declaration of interests
The authors report no conflict of interest.
Author contributions
A.B., F.V. and F.G. created the research plan. A.B. formulated analytical and numerical models. A.B. led model solution. A.B. and B.J. designed the experimental set-up. B.J. performed all experiments. A.B., F.V. and F.G. wrote the paper.
Appendix A. Convergence analysis as the truncation number $N$ varies

In § 2.1, we have briefly described the procedure employed for solving the eigenvalue problem (2.32), where the structure of matrices  $\boldsymbol {A}$ and
 $\boldsymbol {B}$ in the two cases of subharmonic and harmonic parametric resonances are given in Kumar & Tuckerman (Reference Kumar and Tuckerman1994). For each driving frequency and wavenumber, the eigenvalue problem is solved in MATLAB using the built-in function eigs. Successively, by selecting one or several smallest, real positive values of
 $f$, one can draw the marginal stability boundaries of the various parametric tongues. For instance, those boundaries are indicated in figure 14 by the black dots, each of which corresponds to an eigenvalue
 $f$ for a fixed combination
 $(k,\varOmega )$.
Same Faraday tongues of figure 3 by solving the eigenvalue problem (2.32) with  $N=10$ for three different fixed driving angular frequencies (reported above each panel) and using the modified
 $\sigma _{BL}=\chi _n\nu /b^2$. Contact line dissipation is not included, i.e.
 $M=\sigma _{CL}=0$. A much wider range of forcing acceleration,
 $f\le 50$, is shown so as to give a more comprehensive view of the linear stability map. The convergence analysis outlined in table 2 is performed for the value of
 $kb/2{\rm \pi}$ indicated by the vertical white dashed line, i.e. 0.178.

In order to ensure the numerical convergence of the results, the dependency of the eigenvalues on the truncation number  $N$ must be checked. Throughout the paper, we have used a truncation number
 $N=10$, which produces
 $2(N+1)\times 2(N+1) = 22\times 22$ matrices. For their purposes, Kumar & Tuckerman (Reference Kumar and Tuckerman1994) used
 $N=5$ or
 $N=10$, which were sufficient to guarantee a good convergence. However, as the problem presented here differs from that tackled in Kumar & Tuckerman (Reference Kumar and Tuckerman1994), whether a similar truncation number, e.g.
 $N=10$, is still sufficient needs to be verified.
A convergence analysis as  $N$ varies is reported in table 2. The analysis is carried out with respect to the results already discussed in figure 3, but for a much wider range of forcing acceleration,
 $f=a\varOmega ^2/g$, which represents the eigenvalue of problem (2.32). The values of
 $f$ reported in table 2 are computed for a driving frequency of
 $4\ \text {Hz}$ and for
 $kb/2{\rm \pi} =0.1783$, as indicated by the white dashed line in figure 14(a). Table 2 shows that a truncation number
 $N=5$ is not sufficient to achieve convergence of the eigenvalues
 $f\le 50$. Particularly, the algorithm does not succeed in finding many eigenvalues of interest as
 $N$ is too small to describe all the subharmonic and harmonic boundaries encountered at this value of
 $kb/2{\rm \pi}$ for
 $f\le 50$. Yet,
 $N=5$ already provides a very high resolution of the first two or three eigenvalues for both subharmonic (SH) and harmonic tongues (H), which are sufficient to obtain the results discussed throughout the manuscript. The accuracy increases from
 $N=5$ to
 $N=9$ and the results for
 $N=15$ or
 $20$ confirm that a satisfactory convergence of all eigenvalues
 $f\le 50$ is achieved for
 $N=10$, with a maximum relative error
 $<0.6\,\%$.
First smallest real positive eigenvalues,  $f=a\varOmega ^2/g$ (
 $\le 50$), outputted by the Floquet analysis at different truncation number
 $N$ for a fixed driving frequency of
 $4\ \text {Hz}$ and for a fixed value of
 $kb/2{\rm \pi}$, e.g. 0.178, as indicated by the vertical white dashed line in figure 14. The top half of the table reports the values computed from the calculation of subharmonic (SH) tongues, whereas the bottom half of the table reports those from the calculation of harmonic (H) tongues. The dash symbol, e.g. for
 $N=5$, is used to indicate that no other real positive eigenvalues were found.

Appendix B. Sensitivity analysis to variations of the contact line parameter $M$

Although the introduction of the mobility parameter  $M$ is not the central point of this paper, the effect of this parameter on the stability properties of Faraday waves in Hele-Shaw cells has not been fully elucidated yet. With regards to the subharmonic Faraday threshold in thin annuli discussed in §§ 3 and 4, in this appendix, we carry out a sensitivity analysis of the instability onset to variations of
 $M$.
The asymptotic approximation (3.9)
 \begin{equation} \min{f_{SH1}} \approx 2\sigma_{0,r}\sqrt{\frac{R}{g}\left(\frac{1}{m}+\frac{\gamma}{\rho g R^2}m\right)}, \end{equation}
gives us a simple analytical formula for the minimum onset acceleration  $f_{SH1}$ associated with the first subharmonic parametric instability of a generic azimuthal mode
 $m$. Specifically, (B1) helps us to rationalise the effect of interplaying restoring forces, i.e. gravity and capillarity, and dissipation sources, i.e. boundary layers and contact line, on the instability onset.
Recalling the definition of  $\sigma _{0,r}$ from (2.27a), the onset acceleration is given by the sum of two contributions
 \begin{equation} \min{f_{SH1}}\approx 2\chi_{n=0,r}\frac{\nu}{b^2}\sqrt{\frac{R}{g}\left(\frac{1}{m}+\frac{\gamma}{\rho g R^2}m\right)}+\frac{4M}{\rho b}\frac{m}{R}\sqrt{\frac{R}{g}\left(\frac{1}{m}+\frac{\gamma}{\rho g R^2}m\right)}, \end{equation}
where the deep-water approximation  $\tanh {(mh/R)}\approx 1$ has been used for simplicity.
The two contributions and their sum are plotted in figure 15(a,b), where the filled circles correspond to the azimuthal wavenumbers reported in figure 6, i.e.  $m=1,2,\ldots,15$. The parameter
 $M$ is fixed to the value used in §§ 3 and 4, i.e. 0.0485. In figure 15(a) the boundary layer damping is the one given by the Darcy theory,
 $12\nu /b^2$, whereas in figure 15(b) the modified damping coefficient
 $\chi _{n=0,r}\nu /b^2$ is used. In the absence of contact line dissipation, the onset acceleration of low
 $m$-modes progressively decreases as the threshold is dictated by the gravity term
 $\sim \sqrt {1/m}$, while capillarity only matters at larger
 $m$. On the contrary, assuming
 $M\ne 0$ introduces a correction
 $\sim \sqrt {m}$ that, depending on the value of
 $M$, may quickly dominate over
 $\sqrt {1/m}$, hence leading to a growing
 $\min f_{SH1}$ already at relatively low
 $m$. Such a trend is exacerbated by larger
 $M$. This is clearly visible in figure 15(c,d), where only the overall value min
 $f_{SH1}$ is plotted for several values of
 $M$.
(a,b) Individual contributions, i.e. boundary layer and contact line ( $M=0.0485$), to the subharmonic onset acceleration of the first 15 azimuthal modes as prescribed by (B2). (c,d) Onset acceleration of the first 15 azimuthal modes as prescribed by (B2) for several values of
 $M$. Panels (a–c) use the boundary layer damping from the Darcy theory, while panels (b–d) use the modified damping coefficient presented in this work. Note that in each subpanel, the solid lines only serve to guide the eye.

The exact same arguments apply as well to the case of rectangular Hele-Shaw cells with the only difference that  $m/R \rightarrow k$. A similar trend of min
 $f_{SH1}$ for increasing driving frequencies is indeed observable in figure 5.
Appendix C. Modification of the unforced dispersion relation due to a non-flat out-of-plane capillary meniscus
The revised gap-averaged Floquet analysis formalised in this work provides a modified damping coefficient,  $\sigma _{CL}=\chi _n\nu /b^2$ with
 $\chi _n\in \mathrm {C}$, whose imaginary part
 $\chi _{n,i}>0$ leads to a frequency detuning of the Faraday tongues. This detuning represents one of the main findings of the analysis and seems confirmed by our experimental observations.
However, there may be other concomitant effects ignored by the analysis, such as a non-flat out-of-plane capillary meniscus, that could contribute to shifting the natural frequencies and, consequently, the Faraday tongues, towards lower values, thus possibly questioning the actual improvement brought by the present theory. Bongarzone et al. (Reference Bongarzone, Viola, Camarri and Gallaire2022b) highlighted how a curved static interface lowers the resonant frequencies. Since this effect has been ignored in our theoretical model, it is important to quantify such a frequency shift in relation to the one produced by the oscillating boundary layer, so as to verify that the detuning is actually produced by the oscillating viscous boundary layers rather than by static capillary effects.
A way to disentangle the latter contribution from the former one consists of estimating the inviscid natural frequencies when a static meniscus is present. This appendix, which is inspired by the work of Monsalve et al. (Reference Monsalve, Maurel, Pagneux and Petitjeans2022), aims precisely to address this point. Specifically, some of the results reported in Monsalve et al. (Reference Monsalve, Maurel, Pagneux and Petitjeans2022) will be used in figure 16(a–c) as a validation of the numerical method employed in the following.
(a) Static meniscus measured experimentally by Monsalve et al. (Reference Monsalve, Maurel, Pagneux and Petitjeans2022) using water and a gap size  $b=22$ mm (dashed line) and computed numerically according to (C1) using a value of
 $\theta _s=75^{\circ }$. (b) Shape of the static meniscus computed numerically in our experimental set-up. (c) Black solid line, theoretical dispersion relation for the case of water, fluid depth
 $h=50$ mm and
 $b=22$ mm,
 $\omega _0^2=(1+\gamma k^2/\rho g)gk\tanh {kh}$; grey solid line, numerical dispersion relation in the case of a pinned contact line; red dotted, grey dotted and grey dashed lines give the meniscus corrections to the two dispersion relations, while the blue filled circles correspond to the experiments of Monsalve et al. (Reference Monsalve, Maurel, Pagneux and Petitjeans2022) with a pinned contact line and with the static meniscus reported in (a). A comparison of (c) to figure 8 of Monsalve et al. (Reference Monsalve, Maurel, Pagneux and Petitjeans2022) validates our numerical scheme. Their curves are not reported for the sake of clarity but perfectly overlap our curves. (d) Same as in (c), but for the condition of our experimental set-up. The blue-filled circles correspond to the driving frequency associated with the minimal onset acceleration amplitude for modes
 $m=5,6,7,8$ and
 $9$ for which
 $k=m/R$ (
 $R=44$ mm). The inset shows that the meniscus correction to the frequency, being negligible, does not explain the frequency shift of the experimental Faraday tongues. Indeed, the blue markers lie above all dispersion relations obtained by varying the static contact angle and wetting conditions.

Note that the analysis is carried out for transverse waves with wavenumber  $k$ in a rectangular channel, but it also applies to azimuthal waves with wavenumber
 $m$ in thin annular channels. Indeed, we have shown in § 3 that for small gap sizes
 $b$ the governing equations in the two cases coincide, with the only difference that
 $k$ becomes
 $m/R$ and
 $m=1,2,\ldots\,$, i.e. for a fixed radius
 $R$, the wavenumber is discrete.
The first step consists of computing the shape of the actual two-dimensional static meniscus, whose governing equation balances gravity and capillarity:
 \begin{equation} \rho g\eta_s'=\gamma\kappa'\left(\eta_s'\right)=\gamma\frac{\eta_{s,y'y'}'}{\left(1+\eta_{s,y'}'^2\right)^{3/2}},\quad \text{with}\ \left.\frac{\partial\eta_s'}{\partial y'}\right|_{y'={\pm} b/2}=\cot{\theta_s}. \end{equation}
Note that the shape of the meniscus is assumed invariant in the elongated direction  $x'$ (or
 $\varphi$) so that
 $\eta _{s,x'}'=\eta _{s,x'x'}'=0$ (
 $x'\leftrightarrow \varphi$):
 \begin{align} \kappa'\left(\eta_s'\right)=\frac{\eta_{s,x'x'}'\left(1+\eta_{s,y'}'^2\right)+\eta_{s,y'y'}'\left(1+\eta_{s,x'}'^2\right)-2\eta_{s,x'}'\eta_{s,y'}'\eta_{s,x'y'}'}{\left(1+\eta_{s,x'}'^2+\eta_{s,y'}'^2\right)^{3/2}} = \frac{\eta_{s,y'y'}'}{\left(1+\eta_{s,y}'^2\right)^{3/2}}. \end{align}
Equation (C1) is nonlinear in  $\eta _s'$ and is solved numerically in MATLAB through a Chebyshev collocation method and the Gauss–Lobatto–Chebyshev collocation grid
 $s\in [-1,1]$ is mapped into the physical space
 $y'\in [0,b/2]$ through the linear mapping
 $y'=(s+1)b/4$. Hence the solution to the nonlinear equation is obtained by means of an iterative Newton method, whose detailed steps are given in Appendix A.1 of Viola et al. (Reference Viola, Brun and Gallaire2018).
Figure 9(b) shows that the stable free surface is not flat, but rather curved in the vicinity of the wall, where the meniscus height is approximately 1.5 mm. Given the fluid properties of ethanol 70 %, we can fit the value of the static contact angle in order to retrieve the measured meniscus height. The results of this procedure are given in figure 16(b), which displays the shape of the static out-of-plane capillary meniscus corresponding to our experiments. A static angle  $\theta _s=28^{\circ }$, which coincides with the value measured by Dollet et al. (Reference Dollet, Lorenceau and Gallaire2020), is found to give the correct meniscus height at the wall.
Next, we introduce the velocity potential  $\varPhi '$ and write down the potential form of the unforced governing equations and boundary conditions introduced in § 2. Those equations are linearised around the rest state, which has now a curved static interface in the direction of the small gap size, i.e.
 $\eta _s'(y)\ne 0$. The continuity equation rewrites as the Laplacian of the velocity potential
 \begin{equation} -k^2\check{\varPhi}'+\frac{\partial^2\check{\varPhi}'}{\partial y'^2}+\frac{\partial^2\check{\varPhi}'}{\partial z'^2}=0, \end{equation}
subjected to the no-penetration condition at the solid bottoms and lateral walls  $\partial \check {\varPhi }'/\partial n'=0$, while the dynamic and kinematic conditions read
 \begin{gather} \text{i}\omega_0\check{\varPhi}'={-}g\check{\eta}'+\frac{\gamma}{\rho}\left[\frac{1}{\left(1+\eta_{s,y'}'^2\right)^{3/2}}\frac{\partial^2}{\partial y'^2}-\frac{3\eta_{s,y'y'}'\eta_{s,y'}'}{\left(1+\eta_{s,y'}'\right)^{5/2}}\frac{\partial}{\partial y'}-\frac{k^2}{\left(1+\eta_{s,y'}'^2\right)^{1/2}}\right]\check{\eta}', \end{gather}
 \begin{gather} \text{i}\omega_0\check{\eta}'=\frac{\partial\check{\varPhi}'}{\partial z'}, \end{gather}
where the following ansatzes for the infinitesimal perturbations have been introduced:
 \begin{equation} \varPhi'=\check{\varPhi}'\left(y',z'\right){\rm e}^{\text{i}\left(\omega_0 t'+k x'\right)}+{\rm c.c.},\quad \eta'=\check{\eta}'\left(y'\right){\rm e}^{\text{i}\left(\omega_0 t'+k x'\right)}+{\rm c.c.}. \end{equation}
In order to close the problem we enforced a contact line condition
 \begin{equation} \left.\frac{\partial\check{\eta}'}{\partial y'}\right|_{y'={\pm} b/2}=0\quad\text{(free)}\quad \text{or} \quad \left.\frac{\partial\check{\eta}'}{\partial t'}\right|_{y'={\pm} b/2}=0\quad \text{(pinned)}. \end{equation}
Conditions (C7) represent two diametrically opposed scenarios. The most relevant condition to be considered for our experiments is the free contact line, but the results obtained from the imposition of the pinned contact line condition are used for validation with Monsalve et al. (Reference Monsalve, Maurel, Pagneux and Petitjeans2022). Regardless of the chosen contact line condition (C7), (C3)–(C8) can be recast into the generalised eigenvalue problem
 \begin{equation} \left(\text{i}\omega_0\mathcal{B}-\mathcal{A}_k\right)\check{\boldsymbol{q}}'=0, \end{equation}
with  $\check {\boldsymbol {q}}'=\{\check {\varPhi }',\check {\eta }'\}^{\rm T}$ a natural mode of the system and
 $\omega _0$ the associated natural frequency. The expression of linear operators
 $\mathcal {B}$ and
 $\mathcal {A}_k$ is given in Viola et al. (Reference Viola, Brun and Gallaire2018). Those operators are here discretised by means of the Chebyshev collocation method, where a two-dimensional mapping is used to map the computational space to the physical space that has a curved boundary due to the static meniscus
 $\eta _s'$. The eigenvalue problem (C8) is then solved numerically in MATLAB using the built-in function eigs by providing the wavenumber
 $k$ as an input. The number of grid points in the radial and vertical direction is
 $n_y=n_z=60$, which largely ensures convergence of the results. This numerical approach has been employed and validated in a series of recent works (Bongarzone, Guido & Gallaire Reference Bongarzone, Guido and Gallaire2022a; Marcotte, Gallaire & Bongarzone Reference Marcotte, Gallaire and Bongarzone2023a,Reference Marcotte, Gallaire and Bongarzoneb), and a detailed description of its implementation can be found in Appendix A.2 of Viola et al. (Reference Viola, Brun and Gallaire2018).
The modified dispersion relation of transverse (or azimuthal) waves computed numerically by solving (C8) is displayed in figure 16(c,d). Figure 16(c) reproduces figure 8 of Monsalve et al. (Reference Monsalve, Maurel, Pagneux and Petitjeans2022) and only serves as a further validation step for our numerical method. Instead, figure 16(d) shows that our measurements (blue markers) lie above all dispersion relations obtained by varying the static contact angle and wetting conditions. In other words, the tip of the Faraday tongues are found at frequencies lower than any of those obtained by accounting for the meniscus shape and the wetting conditions, irrespective of the latter. This indicates that another mechanism accounts for this frequency shift. Since in addition, in the free contact line regime, the static contact angle does not have a perceivable effect, the entirety of the frequency shift has to be accounted for by another effect, which we show to possibly be unsteady boundary layers.
Figure 16(c,d) both show that meniscus modifications are much more pronounced, at least at low  $\theta _s$ values, when the contact line remains pinned at the lateral walls. This is somewhat intuitive as the first-order interface shape strongly depends on the
 $y'$-coordinate (see figure 5 of Monsalve et al. (Reference Monsalve, Maurel, Pagneux and Petitjeans2022)), whereas it is almost invariant in
 $y'$ if the contact line follows a free dynamics. Given that in our experiments the contact line follows a free dynamics, we can eventually justify ignoring the shape of the out-of-plane capillary meniscus. On the other hand, the actual shape of the static meniscus is important for pinned contact line conditions, as it provokes a non-negligible increase of the natural frequencies (Wilson et al. Reference Wilson, Shao, Saylor and Bostwick2022).


 Open access

