


1 Introduction
Yukikabe (1 750 m a.s.l., 43.7°N 142.9°E) is one of the perennial snow patches in the Daisetsu mountains of central Hokkaido, northern Japan. The snow patch forms as a large snowdrift on a leeward mountain slope under the northwesterly monsoon during the winter. The annual accumulation of snow is estimated to be about 15 m. Usually, the snow patch shrinks to 1 to 3×l03 m2 in area and several metres deep at the end of the ablation season, i.e. the beginning of October. Extensive glaciological research has been conducted at this snow patch since 1964 (Reference KinositaKinosita and others 1965), particularly into snow metamorphism (Reference Wakahama and NaritaWakahama and Narita 1975), yearly variation of the snow patch size (Reference Naruse, Ishimoto, Sakamoto and TakahashiNaruse and others 1972), and mass and heat balance (Reference Inoue and MatsudaInoue and Matsuda 1973).
A number of heat-balance studies have estimated the ablation of snow and ice by means of mean air temperature (e.g. Reference IshiiIshii 1959, Reference KhodakovKhodakov 1975, Reference BurbankBurbank 1982). Reference KrausKraus (1975) derived relations between ablation and air temperature using a model with the parameters of relative humidity, wind speed, and heat-transmission coefficient. The effect of various meteorological parameters on the ablation of glaciers has also been examined (Reference Emelyanov and KonovalovEmelyanov and Konovalov 1975). Reference Arai and SekineArai and Sekine (1973) have discussed the correlation between ablation and degree day index in connection with the formation of perennial snow patches in Japan.
The present paper gives the heat-balance characteristics of the Yukikabe snow patch on the basis of long-term observations of ablation and meteorological conditions. We also attempt to clarify the physical mechanism for such a linear relation between ablation and air temperature.
2 Field Observations
Snow melt
There are several devices to record snow depth; however, most of them either require mains electric power or are not suitable for use in a remote mountain area. A snow depth meter which we have developed records the sinking snow surface of the snow patch, and is based on the snow depth recorder of Reference Takahashi and AburakawaTakahashi and Aburakawa (1976), The meter consists of 120 optical glass fibres of 0.5 mm diameter contained in a 12 m-long reinforced rubber tube 25 mm in diameter, and an 8 mm camera with a battery-operated timer for hourly recording (Reference Sato, Takahashi, Naruse and WakahamaSato and others 1981). The tube is buried vertically in the snow patch. Over 10 m of snow-melt was recorded during the observation period from 4 July to 5 October 1978 (Fig.1). Snow-melt in centimetres of water equivalent (MW) were obtained from the depth of snow-melt (MD) and the density profile of the firn obtained by coring (Reference SatoSato and others 1978).
The observed daily snow melt in depth MD, daily snow melt in water equivalent MW, mean daily air temperature, sunshine duration, and lapse rate at the Yukikabe snow patch during July and August 1978.

Air temperature
Air temperature was measured every three hours by thermistor. Daily mean temperatures are shown in Figure 1. The lapse rate (altitudinal gradient of temperature) is estimated to be 6.8°C km−1 from the daily mean temperatures at Yukikabe and the Asahikawa meteorological observatory (113 m a.s.l.), 45 km to the west of the snow patch. This lapse rate was used to estimate the air temperature of Yuklkabe for missing periods of observation.
Sunshine duration
An 8 mm cine camera photographed the Yukikabe snow patch once an hour, allowing sunshine duration and the weather to be estimated. The average sunshine duration during July and August, shown in Figure 1, was 6.5 h d−1. Since this duration is about one half of the time from sunrise to sunset, the cloud cover n is assumed to be 0.5.
Area and volume of the snow patch
The area of the snow patch was measured by simple optical survey, and the volume was calculated from the surface and bedrock topography. The area in 1978 was 4.8×10³ m2 (on 5 July) and 1.1×10³ m2 (5 October). The volume was 35×103 m3 (5 July) and 3.4×10³ m3 (5 October).
3 Correlation Between Ablation and Degree Day Index
Ablation of snow 1s expressed as water equivalent, H of snow of density M. Degree day Index ΣT is the cumulative positive values of mean daily air temperature. For the three months of observation, a linear relation was found between Σ T and H and H. The proportional coefficient k or kw, with degree day factor, has the following values:


Although Reference Naruse, Ishimoto, Sakamoto and TakahashiNaruse and others (1972) previously demonstrated that the volume of the Yukikabe snow patch could be described by a cubic relation of ΣT, the values for the coefficients were not determined.
The ablation rate of a snow patch (volume decrease) is:
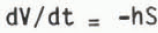
where V is the volume (m3), S the horizontally projected surface area (m2), and h the vertical melt rate (m d−1). Basal melt rate was about 0.5 mm d−1 in northern Hokkaido (Reference KojimaKojima 1982). Here basal melting as well as densification of snow are ignored. Assuming the relation between S and V to be

we obtain from Equation (3)

where the coefficient f and index n, which are determined by the shape of the snow patch, are assumed to be unchanged through the ablation season. H is total snow-melt in metres until the t-th day of the ablation season, and Vmax is the initial volume at the start of the ablation season.
For the obtained values of S and V for the Yukikabe snow patch from 1972 to 1979 (Reference SatoSato and others 1977, Reference Sato, Takahashi, Naruse and Wakahama1981), Equation (4) holds well with n=2/3, and for most years f=4.5. By Equations (1) and (5) we get:

where ΣT refers to the t-th day of the ablation season. In Figure 2, this relation is shown by several curves of different values of Vmax. While the volume measurements of the Yukikabe snow patch have been conducted every year since 1964, there are several years with more than two measurements per year. The volumes of 1965 and 1978 are shown in Figure 2, for example. In a few other years f has varying values in Equation (4), so that curves of varying gradient can be drawn for those years in this figure.
Calculated volume changes with degree day index for the Yukikabe snow patch from the beginning of an ablation season. Open circles indicate values measured in 1965, solid circles in 1978.

Using this model a single observation of V and S in an ablation season can provide the values f and Vmax, and the volume change of the Yukikabe snow patch can be estimated from air temperature.
4 Evaluation of Heat Sources
There are five heat sources on the melting snow surface: sensible heat flux QA, latent heat flux QE, flux of net long-wave radiation QRL, flux of net short-wave radiation QRS, and heat flux of rainfall QP Therefore, the total heat flux QM is:

Incoming heat fluxes are taken as positive. Each heat source QA, QE, and QRL is evaluated using empirical equations.
Sensible heat flux (Reference Naruse, Oura and KojimaNaruse and others 1970) is:

where U and T are the wind speed (m s−1) and air temperature (°C) at 1 m height above the snow surface (1 ly = 41.9 kJ m−2). In Figure 3, QA is presented as a function of temperature, where U is taken to be 4 m s−1, based on previous observations (Reference Takahashi, Fujii and IshidaTakahashi and others 1973).
The relation between air temperature and heat balance terms: QA (sensible heat), QE(latent heat), and QRL (net long-wave radiation). R.H. denotes relative humidity, n cloud amount. 1 ly = 41.9 kJ m−2.

Latent heat flux QE is given by Reference KojimaKojima (1969) as

where e is vapour pressure (mbar) at 1 m height. If wind speed and relative humidity are assumed to be constant during the ablation season, QE can be estimated from the air temperature only by using the above equation. The calculated curves for QE are shown in Figure 3 with U = 4 m s−1, for the cases of 60, 80, and 100% relative humidity (R.H.). Positive values of QE indicate vapour condensation, and negative values, evaporation.
A good correlation between vapour pressure and air temperature is observed in Asahikawa from July through to September, and there was little change in R.H. from around 80% (Reference Sato, Takahashi, Naruse and WakahamaTakahashi and others 1981). R.H. is therefore assumed to be constant at 80% in the following discussion.
The net long-wave radiation QRL is (Reference KondoKondo 1967):

where σ is the Stefan-Boltzman constant, and C a parameter determined by type and amount of the cloud cover n. Figure 3 shows results for the case of low cloud and n = 0.0, 0.5, and 1.0. QRL is seen to increase with air temperature.
Absorbed short-wave radiation is :
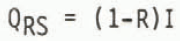
where I is solar radiation (ly d−1) and R is the albedo of the snow surface. I shows a large diurnal variation and has a poor correlation with air temperature. R was measured to be 0.55 in May and 0.45 in August at the snow patches in the Daisetsu mountains (Reference Kubota, Fukami, Ohmae, Kaneda and YamadaKubota and others 1978). From the observation of I in Asahikawa, the mean value of QRS at the Yukikabe snow patch in summer is assumed to be 200 ly d−1.
Heat flux from rainfall Qp is estimated to be only 3% of QA for 10 mm d−1 of precipitation (the monthly average precipitation seldom exceeds this value in Hokkaido). Qp can therefore be neglected for the long period under consideration.
5 Calculation of Degree Day Factor
In the previous discussion, each heat source for ablation is expressed as a function of air temperature, except short-wave radiation QRS. Here a coefficient K 1s discussed, which is determined from Qm = KT for the mean monthly values. Therefore, K is equivalent to Lkw (L is the latent heat of fusion). K is calculated from QM estimated previously, and is shown as a function of T in Figure 4, with the parameter QRS. The circles indicate the calculated K from QM and T for each month in the case of the Yukikabe snow patch.
The change of coefficient K (defined as K = QM/T) with mean monthly air temperature T and short-wave radiation QRS. Circles show the estimated K for the Yukikabe snow patch (numbers denote month, i.e. 6 = June, 7 = July, and so on).

At temperatures lower than about 10°C, K changes considerably with QRS. This means that the correlation between ablation and temperature becomes poor, except for a certain value of QRS (about 200 ly d−1). However, above 10°C the coefficient K tends to be more stable. This is thought to be the case for most snow patches in Japan, for which the air temperature rises relatively high in summer.
The explanation for the good correlation between ablation of snow and temperature for the Yukikabe snow patch is as follows: (i) sensible heat, latent heat and long-wave radiation have positive correlations with air temperature, (ii) short-wave radiation QRS remains in proportion to other heat sources. It is not necessary for sensible heat to dominate in order to maintain a good correlation between ablation and temperature.
6 Contribution of Heat-Balance Terms
The contributions of the three main heat terms QA, QE, and QR (=QRS + QRL) to the total QM of theYukikabe snow patch are calculated and shown in triangular diagrams. In the diagrams each term is expressed as a fraction of QM (= QA+ QE + QR), i.e. QA/QM, QE/QM, and QR/QM. The curves in Figure 5 express these ratios as a function of temperature as well as of QRS. They are calculated using the values found for the Yukikabe snow patch (U = 4 m s−1, R.H. = 80% and n = 0.5). For higher temperatures the relative contribution of increases and that of QRS decreases, whereas at low temperatures has less effect and the contribution of QR varies considerably depending on QRS.
A triangular diagram of heat-balance contribution with parameters QRSand T. Each corner indicates 100% of QA, QE, or QR as a proportion of the total heat QM. Open circles indicate the ratios for the Yukikabe snow patch from June (6) to September (9); triangles represent Tsurugisawa snow patch, and solid circles for other glaciers and ice caps.

In the diagram, open circles indicate the estimated values for the Yukikabe snow patch (the numbers refer to the month: 6 = June, 7 = July, and so on), solid triangles refer to the Tsurugisawa snow patch (36.5° N 137.6°E) in central Honshu (Hikaku Hyoga Kenkyu-kai 1973). Solid circles indicate values obtained during the ablation season from glaciers and ice caps elsewhere in the world listed by Reference PatersonPaterson (1969).
In Figure 6 the curves are shown as a function of temperature and relative humidity, calculated with the values U = 4 m s−1, QRS = 200 ly d−1, and n = 0.5. For higher air temperatures, the curves tend to a single line with a nearly constant ratio of QR to QA.
A triangular diagram of heat-balance contribution with parameters T and R.H. (relative humidity). Symbols are the same as those in Figure 5.

7 Conclusion
The results obtained in this study for the Yukikabe snow patch are summarized as follows:
-
(a). The proportional coefficient k between snow melt and degree day index ΣT is found to be constant over the three months of the ablation season.
-
(b). Using the constant value of k, the ablation (volume decrease) of the Yukikabe snow patch is described by a function of ΣT. This model shows good agreement with the observed ablation.
-
(c). Each heat-balance term is found to increase as a function of temperature, except for the absorptive short-wave radiation term QRS. For a certain value of QRS, the total of the heat terms shows a good cor relation with air temperature, and the coefficient k becomes constant for a wide temperature range. Yukikabe snow patch fits in with this case.
-
(d). Using triangular diagrams the contributions of sensible heat flux QA, latent heat flux QE, and net radiation flux QR can be examined by changing the temperature, QRS, and relative humidity.
-
(e). It is shown that snow patches in Japan have a much larger contribution of QA, QE compared with other glaciers. This could result from higher air temperatures in Japan than elsewhere in summer.
The authors would like to thank many graduate students in the Institute of Low Temperature Science for their contribution to the field observations. Drs E Akitaya and T Yamada helped with the development of the instruments. Acknowledgment is also due to Professor R L Brown and Mr E E Adams of Montana State University for kind assistance in preparing the manuscript.



