


Recently published results from a cluster-randomized, crossover trial at 9 hospitals in the United States demonstrate that the use of ultraviolet C (UV-C) in terminal cleaning of a patient room significantly reduces the transmission of common hospital pathogens from one patient to the next patient in the same room.Reference Anderson, Chen and Weber 1 Previous studies have shown that a UV-C reflective coating on the walls of a hospital room can either decrease the time required to disinfect the room, or, for a device with a fixed cycle time, significantly improve the log10 reduction of both MRSA and C. difficile.Reference Rutala, Gergen, Tande and Weber 2 , Reference Rutala, Gergen, Tande and Weber 3
The purpose of this study was to increase our understanding of the behavior of UV light in a hospital room. We are particularly interested in characterizing the UV intensity on various surfaces that may become contaminated. Because a hospital room contains many touchable surfaces in various locations and orientations relative to the UV device, it is critical that we understand how much UV light is illuminating these surfaces and how that affects the degree of disinfection. To accomplish this, we used radiometry to measure UV intensity, and we correlated these values to log10 reduction of MRSA and Clostridium difficile. Furthermore, we evaluated a novel computer simulation tool to predict UV intensity, an approach that could be used to optimize disinfection protocols.
Methods
We utilized a UV-C device (V-360+, UltraViolet Devices, Valencia, CA) in 2 patient rooms of the Clinical Translational Research Center at the University of North Carolina Medical Center. Microbiological measurements were performed using C. difficile spores and a clinical isolate of MRSA using methods described previously.Reference Rutala, Gergen, Tande and Weber 2 , Reference Rutala, Gergen, Tande and Weber 3 The device cycle times were set at 5 minutes for MRSA and 10 minutes for C. difficile spores, based on the manufacturer’s recommendations. This study was conducted in both a control room containing traditional UV-absorbing paint and an identical study room containing UV-reflecting paint (Lumacept, Grand Forks, ND). A total of 10 surfaces, identified previously,Reference Rutala, Gergen, Tande and Weber 2 were studied and included both directly and indirectly illuminated locations in both rooms.
Ultraviolet irradiance (energy per area per time, typically expressed as microWatts per square centimeter, µW/cm2) was measured using an ILT1700 Research Radiometer (International Light Technologies, Peabody, MA) and a calibrated, NIST-traceable UV-C detector with a filter and diffuser (SED240/NS254/W, International Light Technologies). Ultraviolet intensity simulations were performed with customized software that uses physics-based illumination algorithms to predict the distribution of UV-C light in a room. Three-dimensional computer models of both rooms were created, and the reflective properties of the surfaces in the room were specified based on previous measurements. The only difference between the control room and study room was the reflectivity value for the walls. A light source was then defined, and the software calculated a predicted intensity for all surfaces of interest.
Results
Figure 1 illustrates the effect of UV intensity on the log10 reduction of both MRSA and C. difficile. Surfaces were categorized as either direct or indirect based on whether the surface was in line of sight of the device, determined using a laser pointer. For the control room, the indirect surfaces received, on average, a UV intensity of roughly 3 µW/cm2, while direct surfaces received an average intensity of ~1800 µW/cm2. The differences in intensity were strongly correlated with disinfection performance. The average log10 reduction increased from 2.7 (indirect) to 4.1 (direct) for MRSA and from 1.8 (indirect) to 3.4 (direct) for C. difficile in the control room.
Log reduction in Clostridium difficile and methicillin-resistant Staphylococcus aureus (MRSA) as a function of the average ultraviolet (UV) irradiance (µW/cm2). Note the large differences in intensity between directly and indirectly illuminated surfaces.
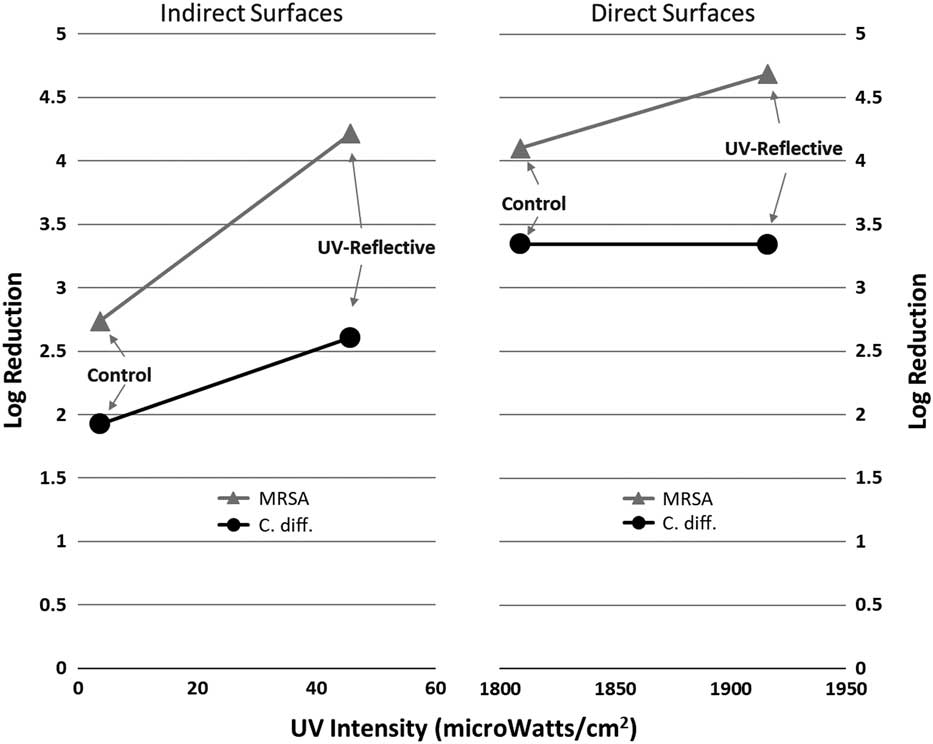
As expected, the reflective coating had a relatively lower impact on direct surfaces than on indirect surfaces, primarily because direct light is significantly more intense than indirect (scattered) light. For indirect surfaces, the reflective coating increased the UV intensity by more than an order of magnitude, to 45 µW/cm2, resulting in an improved log10 reduction of 4.2 for MRSA and 2.6 for C. difficile spores. This difference is statistically significant at a confidence level of 95%, as reported previously.Reference Rutala, Gergen, Tande and Weber 3 These results are generally consistent with previous measurements and simulations, which demonstrates that the effect of reflective wall coatings were more substantial for indirectly illuminated surfaces.Reference Rutala, Gergen, Tande and Weber 3 , Reference Krishnamoorthy and Tande 4 Notably, UV intensity, as shown in Figure 1 in units of µW/cm2, is not the same as the accumulated UV energy (in units of µW*s/cm2), which would be calculated by taking the intensity multiplied times the exposure time in seconds. For example, a UV intensity of 3 µW/cm2 for a 10-minute cycle time would deliver an accumulated UV dose of 1800 µW*s/cm2.
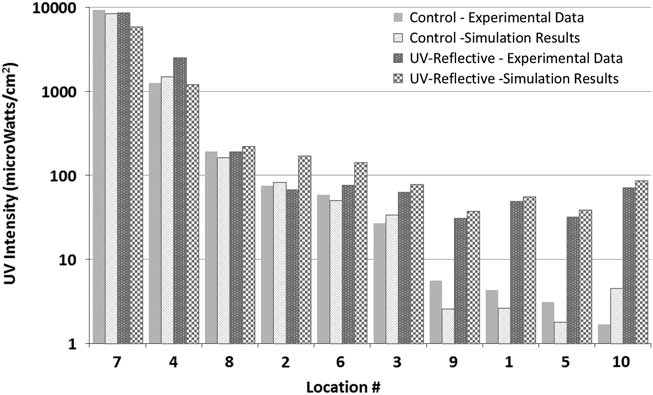
Figure 2 shows a comparison of measured UV intensity data to that predicted by computer simulations for all 10 surfaces used in this study, ordered from highest to lowest intensity. In general, good agreement can be seen across several orders of magnitude. The computer simulations accurately represent the significant differences in intensity between direct and indirect surfaces as well as the effect of the UV reflective wall paint.
Comparison of measured ultraviolet (UV) intensity values (log scale) to simulation results for both the control and the UV-reflective room. Numbers indicate the following locations: (1) the far side of the bedside table facing the wall; (2) the top of the bed; (3) the top of the toilet seat; (4) the closet door; (5) the bathroom wall above the toilet; (6) the floor on the right side of the bed; (7) the foot of the bed facing the door; (8) the back of the chair; (9) the side of the sink facing the bedside table; (10) the back of the computer facing the wall. Locations 1, 5, 9, and 10 are indirect surfaces, while the others are direct.
Discussion
The UV intensity values clearly demonstrated how the UV dose received by surfaces in a single room can differ by orders of magnitude, with some surfaces receiving very little UV light. The use of UV reflective paint led to greater uniformity in the intensity because significantly more light reaches indirect surfaces. Microbiological results confirmed, as expected, that higher UV intensity led to better surface disinfection.
As healthcare facilities continue to consider the role of portable UV disinfection devices as part of their terminal cleaning protocol, it is important that infection control staff have a basic understanding of the behavior of UV light in a hospital room. The location of the device, the length of time the device is on, and the reflectivity of the surfaces in the room all have important implications on the level of disinfection. While it is impractical to repeat this study in every hospital room, a simulation-based approach, like the one described here, could potentially be used to understand and optimize the use of these devices in specific rooms.
Acknowledgments
We thank Ultraviolet Devices for loaning University of North Carolina Health Care the ultraviolet-C device used in these experiments and Dr Emily E. Sickbert-Bennett for statistical assistance.
Financial support
The reflective paint was provided by Lumacept. No other financial or technical support was received by University of North Carolina (UNC) Health Care, and Ultraviolet Devices had no involvement in writing or reviewing this article. We acknowledge the use of rooms in the UNC Clinical Translational Research Center (National Institutes of Health grant no. 1ULRR025747–01).
Potential conflicts of interest
B.M.T. and T.A.P. report that they are the coinventors of the patented reflective coating and co-owners of Lumacept, which makes the reflective coating. W.A.R. reports that he is a consultant to Advanced Sterilization Products and Professional Disposables International, Inc. (PDI). D.J.W. reports that he is a consultant to PDI. No other authors report conflicts of interest relevant to this article.



