Introduction
Nitrogen (N) level is an important factor for determining the yield of rice (Oryza sativa L.). It is also the most frequently controlled and most influential environmental factor for crop growth (Mae, Reference Mae1997; Hou et al., Reference Hou, Xue, Li, Khan, Yan, Ren, Cong and Lu2019; Zhang et al., Reference Zhang, Gao and Chu2020).
One of the outstanding problems in the sustainable development of agriculture is resource waste and the deterioration of the environment caused by the low utilization rate of fertilizers. N that is not used by crops pollutes the surrounding air and water, such as eutrophication of rivers and lakes. It destroys the normal growth conditions of aquatic organisms and crops and poses a risk to human health (Peng et al., Reference Peng, Buresh, Huang, Yang, Zou, Zhong, Wang and Zhang2006; Chen et al., Reference Chen, Cui, Vitousek, Cassman, Matson, Bai, Meng, Hou, Yue, Römheld and Zhang2011; Yu et al., Reference Yu, Huang, Chen, Godfray, Wright, Hall, Gong, Ni, Qiao, Huang, Xiao, Zhang, Feng, Ju, Ciais, Stenseth, Hessen, Sun, Yu, Cai, Fu, Huang, Zhang, Liu and Taylor2019).
N uptake capacity of rice mainly depends on the variety, and the interaction between different rice genotypes and the environment results in significant differences in N uptake and utilization efficiency and composition, which are heritable (Zhang et al., Reference Zhang, Fan, Wang and Shen2009; Zhang and Chu, Reference Zhang and Chu2020). Therefore, fully exploiting the genetic potential of rice and using the genetic characteristics of low N tolerance has potential to improve rice varieties in terms of quality, yield and N use efficiency (NUE) (Ali et al., Reference Ali, Jewel, Mahender, Anandan, Hernandez and Li2018; Nguyen and Kant, Reference Nguyen and Kant2018; Jewel et al., Reference Jewel, Ali, Pang, Mahender, Acero, Hernandez, Xu and Li2019).
Previous studies have investigated breeding rice genotypes with high N efficiency by differences in NUE (De Datta and Broadbent, Reference De Datta and Broadbent1990; Fageria and Baligar, Reference Fageria and Baligar2003; Fageria et al., Reference Fageria, De Morais and Dos Santos2010; Wu et al., Reference Wu, Yuan, Huang, Sun, Zhu, Li, Fahad, Peng and Wang2016) and main evaluation, utilization indices (Singh et al., Reference Singh, Ladha, Castillo, Punzalan, Tirol-Padre and Duqueza1998; Xu et al., Reference Xu, Xiong, Xie, Zhang, Zhu, Guo, Yang, Zhou and Liu2009), screening and genetic improvement of genotypes with different N efficiency (Samonte et al., Reference Samonte, Wilson, Medley, Pinson, McClung and Lales2006; Haefele et al., Reference Haefele, Jabbar, Siopongco, Tirol-Padre, Amarante, Sta Cruz and Cosico2008; Huang et al., Reference Huang, Li, Lu, Wan, Long, Wang, Tang and Fan2015), root morphology (Cheng et al., Reference Cheng, Dai, Jing, Jiang, Pan and Cao2007; Zhang et al., Reference Zhang, Xu, Chen, Ji, Zhang and Wang2015; Sharma et al., Reference Sharma, Sinha, Gupta, Rajpal, Kuchi, Sitaramam, Parsad and Raghuram2018) and characteristics of dry matter production and accumulation (Wei et al., Reference Wei, Zhang, Dai, Huo, Xu, Hang, Ma, Zhang, Zhang and Liu2007; Artacho et al., Reference Artacho, Bonomelli and Meza2009; Namai et al., Reference Namai, Toriyama and Fukuta2009), physiological and biochemical characteristics (Krapp et al., Reference Krapp, Saliba-Colombani and Daniel-Vedele2005; Ruan et al., Reference Ruan, Shi and Luo2012; Vijayalakshmi et al., Reference Vijayalakshmi, Vishnukiran, Kumari, Srikanth, Rao, Swamy, Surekha, Sailaja, Subbarao, Rao, Subrahmanyam, Neeraja and Voleti2015), and the effects of field N management (Cassman et al., Reference Cassman, Peng, Olk, Ladha, Reichardt, Dobermann and Singh1998; Peng et al., Reference Peng, Buresh, Huang, Yang, Zou, Zhong, Wang and Zhang2006; Zhao et al., Reference Zhao, Miao, Wang, Su, Fan, Zhang, Jiang, Zhang, Liu, Liu and Ma2013; Zhou et al., Reference Zhou, Yang, Wang, Fu, Chen, Hu, Yamagishi and Ren2019). Although there has been progress, evaluation methods of NUE in previous studies have not been uniform because different studies have used different regions, test materials and evaluation indices. There are difficulties in effectively applying the relevant N efficient genotype identification indices during field breeding and production, and the improvement of yield and NUE has not been solved. Therefore, it is particularly important to screen and identify rice varieties suitable for local ecological and agricultural conditions (Xu et al., Reference Xu, Xiong, Xie, Zhang, Zhu, Guo, Yang, Zhou and Liu2009).
Herein, we investigated N efficiency levels of different varieties (lines) of rice subspecies Oryza sativa L. subsp. japonica Kato (O. s. japonica) in Xinjiang, which could provide a basis for screening and identification of N efficient rice varieties. It is also helpful to cultivate N efficient varieties through genetic improvement to improve NUE, reduce N fertilizer application and N waste, increase agricultural profits, and improve the ecological environment for ensuring food security and maintaining sustainable development.
Materials and methods
General situation of test materials and test sites
The tested materials were O. s. japonica varieties (lines), including 11 main cultivars (numbering: 1–11), 12 introduced and approved cultivars (numbering: 12–23), eight selected lines (numbering: 24–31), and seven high-generation materials (numbering: 32–38), totalling 38, which were collected and preserved by the Institute of Nuclear Technology and Biotechnology, Xinjiang Academy of Agricultural Sciences (Table 1). The experiment was conducted at Wensu rice test station of the academy (41°16′N, 80°12′E). Soil properties: pH 8.0, total salt 7.4 g/kg, total N 1.25 g/kg, hydrolytic N 119.4 mg/kg, available potassium (K) 220.0 mg/kg, available phosphorus (P) 48.8 mg/kg and organic matter 17.7 g/kg in the experimental field.
Basic information for test materials

A: Xinjiang Academy of Agricultural Sciences, Institute of Nuclear Technology and Biotechnology, Xinjiang, China; B: Xinjiang Academy of Agricultural Sciences, Institute of Food Crops, Xinjiang, China; C: Xinjiang Academy of Agricultural Sciences, Rice Experiment Station in Wensu, Xinjiang, China; D: Agricultural Test Ground in Akita Prefecture, Hokkaido, Japan; E: Institute of Rice in Wuchang, Heilongjiang, China; F: Shenyang Agricultural University, Liaoning, China.
Test design and scheme
In the whole growth period, basal fertilizer: tiller fertilizer: booting fertilizer (branch differentiation stage) was 3:3:4 and was used as the index of N application. Four levels of N application were set. When 0, 15, 30, and 45 kg/666.67 m2 of urea were applied, the conversion rate of pure N in urea was 46%, i.e. 0, 104, 207 and 311 kg/hm2 of pure N, respectively, which were reported as N0 (control), N104 (low), N207 (medium) and N311 (high), respectively. Split plot design was used with varieties in the main plots and N treatments in the sub-plots, 120 m2 per experimental plot, including 38 varieties, each covering an area of 3 m2, single transplanted and randomly arranged of each variety, with the row-plant spacing of 25 cm × 15 cm, the walkway in the middle, repeated three times and there were 12 experimental plots in total. A waterproof partition board was used to isolate the experimental plots to prevent water and fertilizer from crossing. Calcium superphosphate 90 kg⋅hm−2 (P2O5 ≥ 13.5%) and potassium chloride 180 kg/hm2 (K2O ≥ 52.0%) were applied as base fertilizer, and tiller fertilizer was applied 7 d after transplantation. The experiment was carried out on 2 April 2018 and transplantation occurred on 8 May. Disease and pest control, field weeding and water management followed the cultivation and management methods commonly used in the test station.
Measuring
After maturation, edge rows were eliminated in each experimental plot. Five randomly sampled plants in the plot were investigated for agronomic traits: plant height, growth period, effective tillering number and total leaf area, which was measured by a handheld leaf area meter (YMJ-B, Top Instrument Co., Ltd, Zhejiang, China). After harvesting, drying and threshing, the water content of grains was measured by a hand-held rapid moisture analyzer (LDS-1H, Top Instrument) and weighed to convert the yield per mu (15% moisture). Yield traits measured in the laboratory were: panicle length, panicle number per plant, total grain number per panicle, seed setting rate and 1000-grain weight. Rice processing quality was determined as a percentage of whole rice using a milled rice machine (LTJM-2099, Top Instrument). Nutritional quality, including amylose content, protein content and taste value were determined by a rice taste meter (RCTA-11A, Satake Manufacturing Co., Ltd, Suzhou, China). Chlorophyll content was determined through SPAD value by analysing the middle of functional leaves of healthy and identical growing plants using a chlorophyll content analyzer (SPAD-502Plus, Top Instrument) at maturity. The values were repeated 10 times per plot and averaged.
Calculations
 $${\hbox{Relative value of each trait}}\,\left( \% \right) = \displaystyle{\matrix{{\hbox{measured value under }}\cr{\hbox{different N application levels for each trait}}} \over {\hbox{controlled value for each trait}}} \times 100 $$
 $$\eqalign{&{\hbox{Setting rate}}\,\left( \% \right) \cr &= \left( {\displaystyle{{\hbox{mature number of grains per panicle}} \over {\hbox{total number of grains per panicle}}}} \right) \times 100 $$
 $${\hbox{Leaf area index}}\,\left( {{\rm LAI}} \right) = \displaystyle{{\hbox{total leaf area}} \over {\hbox{land area}}}$$
 $${\hbox{Agronomic utilization rate of N fertilizer (kg/kg}}) = \left( {\displaystyle{\matrix{{{\hbox{grain yield in N application area}}}\cr{-{\hbox{grain yield in non}}-{\hbox{N application area}}}} \over {\hbox{application amount of N fertilizer}}}} \right)$$
 $$\eqalign{&{\hbox{Partial productivity of N fertilizer (kg\,/kg)}}\cr & = \displaystyle{{\hbox{grain yield in N application area}} \over {\hbox{application amount of N fertilizer}}}}$$
 $${\hbox{Subordinate function values}}\left( {u_j} \right) = \displaystyle{{X_j-X_{\min }} \over {X_{\max }-X_{\min }}}$$
Xj is the measured value of the index (j = 1, 2, …, n), and X max and X min are the maximum and minimum values of the j th (corresponding to the j value, j = 1, 2, …, n) index, respectively.
 $${\rm Weight}\left( {W_j} \right) = \displaystyle{{P_j} \over {\sum _{\,j = 1}^n P_j}}$$
Pj is the contribution rate of the j th comprehensive index.
 $$P = \displaystyle{{\sum _{\,j = 1}^n u_iW_j} \over 2}$$
uj is the membership function of the j th comprehensive index, and Wj is the weight of the j th.
Data processing and analysis
SPSS 20.0 statistical programs package (IBM, Armonk, New York, USA) was used for descriptive statistical analysis (the least significant difference (LSD) used for comparative analysis after variance analysis), and factor analysis (principal component factor obtained by orthogonal rotation using maximum variance method). R software (version 3.6.3; http://www.Rproject.org) and package like GGEBiplotGUI (version 1.0-9) (Frutos et al., Reference Frutos, Galindo and Leiva2014) were used for genotype main effects and genotype–environment interaction effects (GGE) biplot analysis. Heml software (version 1.0.3.7) (Deng et al., Reference Deng, Wang, Liu, Cheng and Xue2014) was used for heatmap and clustering analysis (hierarchical method). OriginPro 2019b (OriginLab, Northampton, Massachusetts, USA) was used for 3D scatter plot.
Results
Effect and which won where/what analysis of relative yield and NUE indices on O. s. japonica varieties under different N application levels
All varieties were planted under different N treatments, and their relative yields, NUE indices (agronomic utilization rate and partial productivity of N fertilizer) were measured, converted and collected, the differences among them were great (online Supplementary Fig. S1). The relative yield ranged 95.07–169.81% (mean 124.68%) under N104, 97.15–164.66% (mean 129.67%) under N207, and 87.53–163.69% (mean 121.82%) under N311. There were significant differences (P < 0.05) under different N treatments. The agronomic utilization rate of N fertilizer ranged −1.09 to 17.75 kg/kg (mean 8.25 kg/kg) under N104, −0.61 to 11.26 kg/kg (mean 4.95 kg/kg) under N207, and −1.25 to 6.75 kg/kg (mean 2.37 kg/kg) under N311. There were extremely significant differences (P < 0.01) under different N treatments. The partial productivity of N fertilizer ranged 28.45–55.89 kg/kg (mean 42.74 kg/kg) under N104, 15.01–28.68 kg/kg (mean 22.18 kg/kg) under N207, and 10.01–18.31 kg/kg (mean 13.87 kg/kg) under N311. There were extremely significant differences (P < 0.01) under different N treatments. It indicated that with the increase of N application, the yield was greatly affected by the genotype of the variety, and NUE indices showed a downward trend.
The function map of which won where/what in the GGEbiplot can assess the suitable cultivation area of the tested varieties. Its role is to group different test points according to the mutual relationship between varieties and environment, and to screen out the best varieties in the group. The relative yield was invoked as the target, No. 26 was the most suitable variety under N104, No. 17 was the most suitable variety under N207, and No. 21 was the most suitable variety under N311 (Fig. 1a). The agronomic utilization rate of N fertilizer was used as the goal, No. 26 was the most suitable variety under N104, No. 9 was the most suitable variety under N207, and No. 21 was the most suitable variety under N311 (Fig. 1b). The partial productivity of N fertilizer was used as the objective, No. 4 was the most suitable variety under N104, No. 17 was the most suitable variety under N207 and No. 13 was the most suitable variety under N311 (Fig. 1c).
Which won where/what view of the GGEbiplot. The varieties farthest from the origin in the same direction are connected in turn to form a polygon. The vertical line is drawn from the origin to each side of the polygon to form many different sectors. Varieties distributed in the same sector belong to the same environmental combination. In each sector, the varieties located in polygons are the best environmental combination.

Ideal variety and mean versus stability of O. s. japonica varieties under different N application levels
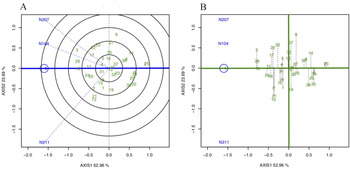
The ideal variety refers to the variety with high and stable yield in the test area. Under N104, the ideal variety was No. 28. Under N207, the ideal variety was No. 3. Under N311, the ideal variety was No. 24. Under all N application levels, the ideal variety was No. 10 (Fig. 2a). Mean versus stability analysis showed that the top four varieties with the best yield stability of the tested varieties were No. 10, 5, 11 and 12. Meanwhile, the last four varieties with the lowest yield stability were No. 27, 21, 13 and 9. The top four varieties with the strongest high yield ability of the tested varieties were No. 3, 28, 10 and 24. Meantime, the last four varieties with the worst high yield ability were No. 6, 34, 7 and 25. The comprehensive analysis showed that No. 10 had both high and stable yield ability (Fig. 2b).
Ideal variety and mean versus stability view of the GGEbiplot. (a) Ideal variety. Draw concentric circles at the point where the arrow is located. Varieties close to the arrow indicate a high ideal index. (b) Mean versus stability. The straight line marked with an arrow represents the average environmental axis, and the closer to the positive direction indicated by the arrow, the higher the high yield ability. The vertical line from the point of the variety to the environmental axis represents the yield stability of the variety. The shorter the vertical line, the better the yield stability.

Descriptive statistics of indices under different N application levels
The coefficient of variation (CV) can be used to measure the degree of variation of each index of different O. s. japonica varieties, with a high CV indicating a high degree of variation. Under different N application levels, the indices of different O. s. japonica varieties varied, with differences in CV (online Supplementary Table S1). The CV ranged 1.18–39.99 under N104, 1.07–31.58 under N207, and 1.23–34.47 under N311. For all N application levels, CV was the smallest for relative growth period (X2) and the largest for relative SPAD value (X14). At the same time, the CV of X14 ranged 31.58–39.99, and the CV of relative panicle number per plant (X6) ranged 26.22–27.15 under all N application levels, which indicated that these two indices could well show the differences among different O. s. japonica varieties (lines). The CVs of relative effective tiller number (X3), and relative LAI (X4) ranged 18.42–22.99, 16.53–18.02 under all N application levels, respectively, suggesting that these two indices could better show the differences among different O. s. japonica varieties. The CVs of the other 10 indices were below 10.00, which indicated that they could not effectively highlight their differences.
Under all N application levels, X4 and X14 were highly significantly different (P < 0.01), and X3 was significantly different (P < 0.05). Relative protein content (X11) was significantly different from the other two N levels (P < 0.05) under N104. X3 was highly significantly different from the other two N levels (P < 0.01) and X6 and relative total grains per panicle (X7) were significantly different from the other two N levels (P < 0.05) under N311.
Discrimitiveness and representativeness analysis of indices of O. s. japonica varieties under different N application levels
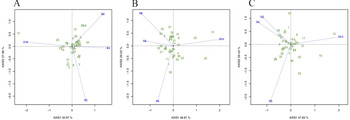
Discrimitiveness and representativeness analysis was conducted between indices (X3, X4, X6 and X14, among which CVs ranged 16.53–47.85, and can effectively highlight their differences) and varieties under different N application levels. Under N104, there was a positive correlation between X3 and X4, and between X4 and X6, respectively, and there was a negative correlation between X3 and X6, between X3 and X14, between X4 and X14, and between X6 and X14, respectively (Fig. 3a). Under N207, there was a positive correlation between X3 and X4, and between X3 and X6, respectively, and there was a negative correlation between X4 and X6, between X4 and X14, between X3 and X14, and between X6 and X14, respectively (Fig. 3b). Under N311, there was a positive correlation between X3 and X4, and there was a negative correlation between X3 and X6, between X4 and X6, between X3 and X14, between X4 and X14, and between X6 and X14, respectively (Fig. 3c). X4 was the most representative index under N104, X3 was the most representative index under N207, and X14 was the most representative index under N311. The vector lengths of indices were relatively close, which means that the discriminating abilities were close, indicating that the performances between different indices and varieties were also relatively close under all N treatments.
Discrimitiveness and representativeness view of the GGEbiplot. The dashed line connecting the position of each index and the origin is called the vector. Acute angle between the vectors means positive correlation, and obtuse angle between the vectors means negative correlation. The cosine of the angle between the vectors approximates the correlation coefficient between the two indices. The length of the vector reflects the ability of different indices to distinguish between varieties. The angle between each vector and the average processing axis reflects the representativeness (the performance of each variety under the same index reached the maximum) of each index. The small angle indicates strong representativeness.

Factor analysis of indices of O. s. japonica varieties under different N application levels
Because the above indices have different representative capacities under different N application levels, and their discriminative power is very similar, factor analysis to reduce the dimension and convert to a few latent variables for further expound is needed. Under N104, the variance contribution rates (VCR) of the first three principal components with eigen values (EV) greater than one were 33.18, 29.93 and 19.76%, and the cumulative contribution rate (CCR) of the first three principal components was 82.87%. Under N207, the VCR of the first three principal components with EV greater than one were 34.62, 27.28 and 19.88%, and the CCR of the first three principal components was 81.77%. Under N311, the VCR of the first three principal components with EV greater than one were 37.79, 22.78 and 20.53%, and the CCR of the first three principal components was 81.10% (online Supplementary Table S2). The critical value of the cumulative proportion of EV was 80% under three N application levels, and most indices were sufficiently summarized. The factor load between the first three principal components and all indices reflected the correlations among them. The factor loads of X6 and X14 were higher in the corresponding eigenvectors of the first three principal components, which mainly reflected the relationship between leaf growth and panicle development, and the dynamic changes in yield components. These results indicate that X6 and X14 can best represent the response to N efficiency of different O. s. japonica varieties under different N application levels.
Heat mapping and cluster analysis of O. s. japonica varieties under different N application levels
According to the descriptive statistics (CVs), discrimitiveness and representativeness (vector lengths and angles), and factor analysis (factor loads) results of indices, X6 and X14 were determined as the evaluation indices of N efficiency types of different O. s. japonica varieties at maturity. By analysing the relative values of X6 and X14 of different O. s. japonica varieties under different N application levels, the variation of X6 and X14 ranged 0.87–1.83 and 0.70–1.73, and the mean values were 1.27 and 1.20 under N104, respectively, 0.77–1.88 and 0.78–1.96, and the mean values were 1.26 and 1.24 under N207, respectively, and 0.74–1.89 and 0.76–2.01, and the mean values were 1.34 and 1.30 under N311, respectively. At the same time, the same indices of the same varieties were significantly analysed under different N application levels, and the same indices under the same N application levels were significant analysed among different varieties (online Supplementary Table S3).
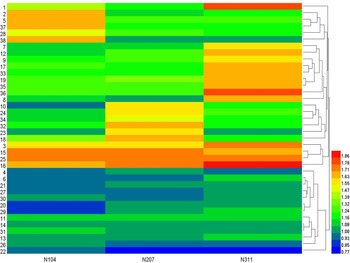
The average value of X6 and X14 was used as the identification index. All varieties under different N application levels were plotted on a heatmap, which could be visually displayed by colour, and the differences in the data can be quickly assessed based on different colour shades (Fig. 4). Under N104, ranged 0.91–1.74, among which, No. 20 was the smallest and No. 25 was the largest. Under N207, ranged 0.77–1.75, among which, No. 22 was the smallest and No. 16 was the largest. Under N311, ranged 0.80–1.94, among which, No. 22 was the smallest and No. 16 was the largest.
Heatmap and hierarchical clustering analysis of O. s. japonica varieties under different N application levels.

Through hierarchical clustering based on squared Euclidean distance, and different O. s. japonica varieties were divided into three groups. The first group contained four varieties, i.e. average values were higher under N104, N207 and N311, (No. 3, 15, 16 and 25). The second group contained 13 varieties, i.e. average values were lower under N104, N207 and N311 (No. 4, 6, 11, 13, 14, 20, 21, 22, 26, 27, 29, 30 and 31). The third group contained the remaining 21 varieties, i.e. average values were the highest under a certain N application level but were lower under other N application levels.
P analysis of O. s. japonica varieties under different N application levels
The uj of X6 and X14 of different O. s. japonica varieties under different N application levels were calculated by formula (6) and the Wj by formula (7) according to the VCR, and the P can be calculated with formula (8) to evaluate the N efficiency (online Supplementary Table S4).
Under N104, P ranged 0.05–0.37 with the mean was 0.17, among which, No. 20, 22 and 29 were the smallest and No. 25 was the largest. Under N207, ranged 0.01–0.35 with the mean was 0.17, among which, No. 22 was the smallest and No. 16, and 25 were the largest. Under N311, ranged 0.02–0.42 with the mean was 0.20, among which, No. 22 was the smallest and No. 16 was the largest.
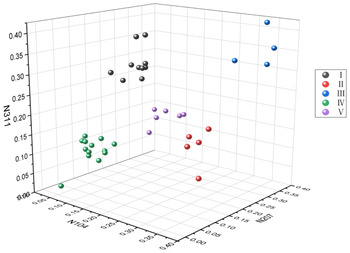
Draw a 3D scatter plot based on P, and different O. s. japonica varieties were divided into five groups (Fig. 5). The group I (high N efficiency under high N application level) contained 10 varieties, i.e. P was the highest under N311 but was lower under N104 and N207 (No. 1, 7, 8, 9, 12, 17, 19, 33, 35 and 36), accounting for 26.32%. The group II (high N efficiency under low N application level) contained five varieties, i.e. P was the highest under N104 but was lower under N207 and N311 (No. 2, 5, 28, 37 and 38), accounting for 13.16%. The group III (high N efficiency under three N application levels) contained four varieties, i.e. P was higher under N104, N207 and N311 (No. 3, 15, 16 and 25), accounting for 10.53%. The group IV (low N efficiency under three N application levels) contained 13 varieties, i.e. P was lower under N104, N207 and N311 (No. 4, 6, 11, 13, 14, 20, 21, 22, 26, 27, 29, 30 and 31), accounting for 34.21%. The group V (high N efficiency under medium N application level) contained six varieties, i.e. P was the highest under N207 but was lower under N104 and N311 (No. 10, 18, 23, 24, 32 and 34), accounting for 15.79%.
3D scatter plot of O. s. japonica varieties under different N application levels. I: High N efficiency under high N application level; II: High N efficiency under low N application level; III: High N efficiency under three N application level; IV: Low N efficiency under three N application level; V: High N efficiency under medium N application level.

Discussion
The difficulties faced by grain production and the significance of breeding rice varieties with high N efficiency
With continuing economic development and social progress, the collision between human demand for food and arable land reduction and resource shortages will become ever more prominent. By 2030, China's rice production must increase by 20% compared with the current level to meet expected levels of grain demand (Peng et al., Reference Peng, Tang and Zou2008; Fan et al., Reference Fan, Shen, Yuan, Jiang, Chen, Davies and Zhang2012). However, the ratio between the increase in rice yield and the increase in chemical fertilizer input in China is inconsistent. From 2000 to 2007, the annual increase rate of rice yield was 0.50%. There is a long way to go to improve rice yield continuously by efficiently utilizing limited resources (Galloway et al., Reference Galloway, Townsend, Erisman, Bekunda, Cai, Freney, Martinelli, Seitzinger and Sutton2008; Normile, Reference Normile2008; Zhang et al., Reference Zhang, Chen and Peter2013; Lu et al., Reference Lu, Song, Jiang, Chen, Wang and Zhou2019). Under the premise of guaranteeing yield per unit area, the cultivation of green and environmentally friendly rice varieties with high N efficiency can reduce N application levels, consequently reducing eutrophication of nearby water bodies as well as providing effective sustainable agricultural production. Therefore, it is imperative to cultivate rice varieties with high N efficiency.
Key indices and categories for screening N efficient genotypes
At present, there is no unified and recognized evaluation system for screening N efficient genotypes. They mainly focus on two aspects: physiological and biochemical and morphological indices. In terms of physiology and biochemistry, the predecessors have done a lot of research. Ruan et al. (Reference Ruan, Shi and Luo2012) suggested that nitrate reductase activity, phosphoenolpyruvate carboxylase activity and protein content were the main physiological manifestations leading to the difference in NUE among varieties. Zhang et al. (Reference Zhang, Xu, Chen, Ji, Zhang and Wang2015) showed that, under low NH4+ conditions, the higher NH4+ inflow in the root meristematic zone of rice varieties with high N efficiency was related to their higher NH4+ uptake and utilization capacity. Sun et al. (Reference Sun, Sun, Yan, Yang, Xu, Li, Wang and Ma2017) suggested that the reasons for high yield and high NUE in N efficient varieties were strong photosynthetic carbon assimilation, synergistic absorption, transport of N and carbon (C), and N metabolism after anthesis, which can meet photosynthate demand during the grain filling period, compared with those in N inefficient cultivars. C/N ratio can be used as an evaluation index for simultaneous improvement of yield and efficiency of N fertilizer in rice. Our research showed that SPAD value (represents the relative content of chlorophyll) can be used as a key physiological index for evaluating high N efficiency of different O. s. japonica varieties at maturity, and consistent with the SPAD value as an important factor in the diagnosis and regulation of N nutrition and plays an important role in the management of N fertilizer in the field and the improvement of NUE in rice (Peng et al., Reference Peng, Garcia, Laza, Sanico, Visperas and Cassman1996; Yang et al., Reference Yang, Yang, Lv and He2014).
In terms of morphological indices, the previous researches focused differently. Cheng et al. (Reference Cheng, Dai, Jing, Jiang, Pan and Cao2007) confirmed that higher root density, total root uptake area and aboveground N content in the jointing stage could be used as reliable indices for efficient N management and genetic improvement of rice. Wei et al. (Reference Wei, Zhang, Dai, Huo, Xu, Hang, Ma, Zhang, Zhang and Liu2007) showed that the tillering and panicle-forming rate of N efficient rice was higher, and it had the characteristics of ‘pre-stable, medium-small, and post-high’ in photosynthetic potential, leaf area, population growth rate and dry matter accumulation. Xu et al. (Reference Xu, Xiong, Xie, Zhang, Zhu, Guo, Yang, Zhou and Liu2009) suggested that the screening indices should focus on seed setting rate, 1000-grain weight, biological yield and harvest index. Chen et al. (Reference Chen, Gong, Zhang, Xu and Gao2016) suggested that the biomass of the whole plant, stem and leaf, and the root system, and N accumulation of stem and leaf could be used as comprehensive evaluation indices of high N efficiency in the rice seedling stage. Our research showed that the panicle number per plant can be used as a key morphological index for evaluating high N efficiency of different O. s. japonica varieties at maturity, which similar to the results of Li et al. (Reference Li, Wan, Huang, Cao, Chen and Han2011) suggested that the number of panicles per plant, seed setting rate and grain weight per plant could be used as morphological screening indices at low N level and Huang et al. (Reference Huang, Li, Lu, Wan, Long, Wang, Tang and Fan2015) showed that there was a significant or highly significant positive correlation between effective panicle number per plant, yield and seed setting rate, grain number per panicle, biomass N uptake and NUE.
In this study, 38 O. s. japonica varieties were divided into five different types (high N efficiency under either all, low, medium, or high application level and low N efficiency under all application levels). The four varieties with high N efficiency under all N application levels were No. 3, 15, 16 and 25, accounting for 10.53% of the total number of tested varieties. For comparison, the results of 55 tested rice varieties were divided into three categories: high, medium and low N efficiency due to difference in absorption and accumulation of N under nutrient solution cultivation method (Chen et al., Reference Chen, Gong, Zhang, Xu and Gao2016), and 45 rice germplasms were divided into four N efficiency types based on grain yield under two field N rates: efficient-efficient, inefficient-efficient, inefficient-inefficient and efficient-inefficient (Huang et al., Reference Huang, Li, Lu, Wan, Long, Wang, Tang and Fan2015), the results of our study were more precise and rigorous in the classification criteria and categories based on the superiority of varieties and conditions, index selection, N application level and analytical methods.
The advantages and disadvantages of the conditions and methods to select N efficient genotypes in this study
The present study was concerned with the screening and comprehensive evaluation of O. s. japonica germplasm resources with different N efficiency in Xinjiang. The aim is to understand the genotype differences of N uptake in rice, which has great practical significance for breeding and identification of rice varieties, field production and improving NUE (Ali et al., Reference Ali, Jewel, Mahender, Anandan, Hernandez and Li2018; Nguyen and Kant, Reference Nguyen and Kant2018; Jewel et al., Reference Jewel, Ali, Pang, Mahender, Acero, Hernandez, Xu and Li2019). In the selection of N efficient genotypes, we chose traditional field tests close to agricultural and natural conditions. In addition to three N application levels that were established, 14 indices were selected, and a variety of statistical methods was used for comprehensive analysis to avoid high error levels caused by only a single index, method and one or two N levels. However, there were some drawbacks compared with pot simulation test methods, which cannot be directly applied in the field. The main drawbacks were long growth cycle, many environmental impact factors, complex and uncontrollable test conditions, and inability to carry out a large number of rapid and accurate screenings (Haefele et al., Reference Haefele, Jabbar, Siopongco, Tirol-Padre, Amarante, Sta Cruz and Cosico2008; Sun et al., Reference Sun, Ma, Sun, Xu, Yang, Liu, Jia and Zheng2012). During the screening period of N efficient genotypes, the N uptake ratio from transplanting to the heading stage was only 24–32% of the total growth period, and the NUE in the seedling stage was only part of the NUE in all growth stages. However, NUE is closely related to crop growth period, NUE increases with the extension of the growth period and was significantly or highly significantly positively correlated with yield (Yin et al., Reference Yin, Zhang, Wei, Zhang, Dai, Huo, Xu, Ma, Hang and Zhang2010; Guo et al., Reference Guo, Yang, Gao, Lu, Guo, Sun, Kong, Ling, Shen and Guo2019). In this study, therefore, based on the selection from heading to yield formation, the yield is the most intuitive index for screening at maturity and compared with seedling screening, the results were more reliable. However, the shortcomings include the large investment of human and material resources, long cycle and interaction between genotype and environment (Almu et al., Reference Almu, Rafii, Sulaiman, Ismail, Harun, Ramli A and Halidu2019; Kekulandara et al., Reference Kekulandara, Sirisena, Bandaranayake, Samarasinghe, Wissuwa and Suriyagoda2019). In terms of screening conditions and periods, the combination of initial screening in the seedling period and validation in the field growth period can be used to further screen N efficient genotypes.
In this research, descriptive statistics, GGEbiplot, factor, heatmap and clustering, and P analysis were used to evaluate suitable varieties, compare the stable and high yield capabilities of different varieties, find the ideal variety, describe the correlation, discrimination and representativeness of the indices, select key indices for evaluation and identification, and divide all varieties into different types under different N application levels. The analytical methods were comprehensive and representative, and obtained identification indices and excellent varieties can provide a theoretical basis for the study of genetic characteristics of high N efficiency and the breeding of high N efficiency varieties. We preliminarily screened, identified and evaluated the germplasm resources of O. s. japonica with different N efficiency in Xinjiang. Our findings are both theoretically informative and practically significant and can work toward saving resources, protecting the environment and sustainably developing agriculture. However, N uptake and utilization in rice is complex and occurs at different growth stages with different levels of efficiency. The influence of the test area, methods, sample size and genotype difference on the results means that further research is necessary to ascertain whether the high N efficiency indices and the different variety types classified in our study are suitable for screening other varieties, stages and the whole growth period.
Conclusions
The relative yield was invoked as the target that most suitable variety and N treatment combinations were No. 26 under N104, No. 17 under N207 and No. 21 under N311. The agronomic utilization rate of N fertilizer was used as the goal that most suitable variety and N treatment combinations were No. 26 under N104, No. 9 under N207 and No. 21 under N311. The partial productivity of N fertilizer was used as the objective that most suitable variety and N treatment combinations were No. 4 under N104, No. 17 under N207 and No. 13 under N311. The top four varieties with the best yield stability of the tested varieties were No. 10, 5, 11 and 12. The top four varieties with the strongest high yield ability of the tested varieties were No. 3, 28, 10 and 24. Under all N application levels, the ideal variety was No. 10. The panicle number per plant and SPAD value can be used as key indices for evaluating high N efficiency of different O. s. japonica varieties at maturity. 38 O. s. japonica varieties were divided into five different types. The four varieties with high N efficiency under all N application levels were No. 3, 15, 16 and 25, accounting for 10.53% of the total number of tested varieties.
Supplementary material
To view supplementary material for this article, please visit https://doi.org/10.1017/S1479262120000118.
Acknowledgements
This work was supported by The Youth Science Foundation Project of Xinjiang Uygur Autonomous Region (No.2018D01B27).