Implications
Beef fatty acid profiles are important not only for meat quality and palatability but also for human health concern. Previous studies have provided evidence of genetic control over the fatty acid content of meat, implying that it may be possible to genetically improve fatty acid compositions for healthier beef production. Our study revealed substantial genetic variation in a Korean Hanwoo cattle population, which could be exploited through genetic selection to improve the fatty acid content of beef. Furthermore, the absence of severe antagonism between fatty acids and six important carcass and meat-quality traits suggests that these traits could be improved simultaneously.
Introduction
Beef fatty acid compositions have been studied for decades due to their implications for meat quality, sensory properties, nutritional value and associated roles in human health (Wood et al., Reference Wood, Enser, Fisher, Nute, Sheard, Richardson, Hughes and Whittington2008). The amount and type of intramuscular fat and fatty acids in beef largely influence eating quality, sensory properties (e.g. taste, tenderness and flavour) as well as meat colour, shelf life and firmness of fat (Wood et al., Reference Wood, Richardson, Nute, Fisher, Campo, Kasapidou, Sheard and Enser2004; Webb and O’Neill, Reference Webb and O’Neill2008). For example, oleic acid (C18:1n-9) correlates positively with characteristic flavours of cooked beef, while the ratio of monounsaturated to saturated fatty acids (MUFA : SFA) influences the texture and taste of beef (Garmyn et al., Reference Garmyn, Hilton, Mateescu, Morgan, Reecy, Tait, Beitz, Duan, Schoonmaker, Mayes, Drewnoski, Liu and Van Overbeke2011). Similar to other quantitative traits, the fatty acid profiles of meat vary with genetic (breed, sex and genotype) and non-genetic (feeding regimen, age and fatness) factors (Malau-Aduli et al., Reference Malau-Aduli, Edriss, Siebert, Bottema and Pitchford2000; De Smet et al., Reference De Smet, Raes and Demeyer2004). Therefore, it is worthwhile to know how the contents of beneficial fatty acids can be manipulated through the selection of genetically superior cattle. In the Korean beef industry, marbling score (MS) is considered the single most important trait for determining beef grade and carcass value. Traditionally, Korean consumers prefer highly marbled meat compared with leaner grades (Hwang et al., Reference Hwang, Kim, Jeong, Hur and Joo2010), and the fatty acid composition defines the characteristic patterns of marbling (Scollan et al., Reference Scollan, Hocquette, Nuernberg, Dannenberger, Richardson and Moloney2006). Recently, consumer demands for healthier beef without compromising eating quality have also increased. Effective breeding programmes to improve beef fatty acid compositions and address consumer demands depend largely on estimates of genetic parameters.
Several studies, mostly on taurine breeds, have reported differences in beef fatty acid profiles, estimates of heritability (h 2) and genetic correlations among fatty acids, as well as their possible genetic relationships with carcass and meat-quality traits (Inoue et al., Reference Inoue, Kobayashi, Shoji and Kato2011; Ekine-Dzivenu et al., Reference Ekine-Dzivenu, Chen, Vinsky, Aldai, Dugan, McAllister, Wang, Okine and Li2014; Buchanan et al., Reference Buchanan, Reecy, Garrick, Duan, Beitz and Mateescu2015). Although some studies have reported intramuscular fatty acid contents in Hanwoo populations (Cho et al., Reference Cho, Park, Kim, Hwang, Kim and Lee2005; Jung et al., Reference Jung, Nam, Lee, Kim and Jo2013; Choi et al., Reference Choi, Kwon, Kim, Yang, Lee and Park2016), none have reported estimates of genetic parameters, which are prerequisites for genetic evaluations of animals. Therefore, we estimated h 2 and genetic and phenotypic correlations among individual and fatty acid classes in the longissimus dorsi (LD) muscle of Korean Hanwoo cattle. The genetic relationships between fatty acid compositions and selected carcass and meat-quality traits were also investigated.
Material and methods
Animals
This study included data on carcass and meat-quality traits and intramuscular fatty acid compositions from 1000 Hanwoo steers, which were the progeny of 85 Korean proven bulls and unrelated dams (6 to 20 progeny per sire) from the Daegwallyeong Hanwoo Company, Gangwon province, South Korea. Prior approval was obtained from the Animal Care and Use Committee of the National Institute of Animal Science (NIAS), RDA, South Korea, and set guidelines for animal health and welfare were followed. Feeding and management practises were generally uniform, particularly the grain-based finisher, steers were fed twice a day (0800 and 1600 h) in feedlot for fattening and all of the animals were slaughtered at 30 months of age.
Carcass and meat-quality traits
Phenotype data on carcass traits including carcass weight (CWT), back fat thickness (BFT), eye muscle area (EMA) and marbling score (MS) were investigated. Carcass weight was measured after a 24 h chill. Back fat thickness, EMA and MS were obtained from cross-sectional measurements in between 12th and 13th rib junction. Marbling score was assessed on a point scale from 1 to 9 according to Korean Beef Marbling Standard adopted by the Animal Product Grading Service in South Korea. Meat samples (1.5 kg) were collected from LD muscle to measure intramuscular fat content (IMF) and Warner–Bratzler shear force (WBSF). The WBSFs of cooked LD-muscle steaks were measured following the method outlined by Wheeler et al. (Reference Wheeler, Shackelford and Koohmaraie2000). The IMF of LD muscle samples was measured using a microwave solvent-extraction method of AOAC (1996). The summary statistics and h 2 estimates for the carcass and meat-quality traits studied in our previous studies are also presented in Supplementary Material Tables S1 and S2, respectively.
Fatty acid analysis
Total lipids were extracted from 200 mg LD muscle samples using methods that were previously described (Folch et al., Reference Folch, Lees and Sloane-Stanley1957). After extraction of total lipids, the individual triglyceride and phospholipid classes were separated by thin-layer chromatography using Silica Gel H (Merck, Darmstdt, Germany), with chloroform : methanol : water (45 : 35 : 10, v/v/v) as the developing solvent system. Fatty acid analyses were performed using a gas-liquid chromatography (model 437, Chrompack, South Raritan, NJ, USA), with a Packard Chrompack equipped with a stainless steel column (3 mm×10 ml) packed with chromasorb WAW 80/100 (Supelco, Inc., Bellefonte, PA, USA). Injector and detector temperatures were 225°C and 215°C, respectively. The carrier gas (nitrogen) flow rate was 22 ml/min. Lauric acid (C12:0) standard methyl ester was added as an internal standard. Fatty acid peaks were converted into amounts of fatty acids following calculations described by Solver and Lanza (Reference Solver and Lanza1979) and concentrations were expressed in percentage of the total fatty acid analysed. The individual fatty acids included C14:0, C16:0, C16:1n-7, C18:0, C18:1n-9, C18:2n-6, C18:3n-6, C18:3n-3, C20:1n-9 and C20:4n-6. Total SFA, MUFA and PUFA were calculated by combining appropriate components. Furthermore, DI and EI were calculated as per Pitchford et al. (Reference Pitchford, Deland, Siebert, Malau-Aduli and Bottema2002) and Nogi et al. (Reference Nogi, Honda, Mukai, Okagaki and Oyama2011):
 $$\eqalignno{ & {\rm SFA}\,{\equals}\,{\rm C}14\colon\!0{\plus}{\rm C}16\colon\!0{\plus}{\rm C}18\colon\!0; \cr & {\rm MUFA}\,{\equals}\,{\rm C}16\colon\!1{\rm n\,{\minus}}\,7{\plus}{\rm C}18\colon\!1{\rm n{\minus}}9{\plus}{\rm C}20\colon\!1{\rm n{\minus}}9;\,\cr & {\rm PUFA}\,{\equals}\,{\rm C}18\colon\!2{\rm n\:{\minus}\:}6{\plus}{\rm C}18\colon\!3{\rm n{\minus}}6{\plus}{\rm C}18\colon\!3{\rm n\:{\minus\:}}3{\plus}{\rm C}20\colon\!4{\rm n{\minus}}6;\cr & {\rm DI}\,{\equals}\,\left( {{\rm C}16\colon\!1{\plus}{\rm C}18\colon\!1{\rm n{\minus}}9} \right)/ \cr \quad \,\left\cr \ \ ( {{\rm C}16\colon\!0{\plus}{\rm C}16\colon\!1{\plus}{\rm C}18\colon\!0{\plus}{\rm C}18\colon\!1{\rm n\,{\minus}}\,9} \right){\rm \ and} \cr & {\rm EI}\,{\equals}\,\left( {{\rm C}18\colon\!0{\plus}{\rm C}18\colon\!1{\rm n\,{\minus}}\,9} \right)/ \cr \ \ \,\ \ \,\left( {{\rm C}16\colon\!0{\plus}{\rm C}16\colon\!1{\plus}{\rm C}18\colon\!0{\plus}{\rm C}18\colon\!1{\rm n{\minus}}9} \right). $$
Statistical analyses
Phenotypic data (i.e. fatty acid compositions of LD muscle and carcass and meat-quality traits), from a total of 1000 Hanwoo steers, were analysed using an animal model in ASReml 4.0 (Gilmour et al., Reference Gilmour, Gogel, Cullis, Welham and Thompson2015). The pedigree file included a total of 5328 animals over seven generations. The animal model included fixed effects as growing sites (three regions, 21 farms), year (three levels) and season (10 levels) of birth and slaughter group (20 levels). Slaughter age was fitted as a linear covariate in this model. The variance components as well as h 2 estimates for carcass, meat quality and fatty acid traits were estimated using single trait animal model. In addition, genetic and phenotypic (co)variances were estimated using pairwise bivariate animal model implemented in ASReml 4.0. In matrix notation, we used the following animal model equation:
 $$y=Xb+Zu+e$$
with
 $${\rm Var}\left[ {\matrix{ u \cr e \cr } } \right]{\equals}\left[ {\matrix{ {A\sigma _{A}^{2} } & 0 \cr 0 & {I\sigma _{E}^{2} } \cr } } \right]$$
where X is an incidence matrix for observations y related to contemporary group fixed effects and linear covariates such as age; b is the vector of fixed effects for each trait; Z is an incidence matrix related to random animal effects; u is the vector of random additive genetic effects for all animals; e represents random residual effects; A is a numerator relationship matrix for all animals using seven pedigree generations; I is an identity matrix; σ 2 A is the additive genetic variance; and σ 2 E is the residual error variance. The bivariate animal model was computed as
 $$\left[ {\matrix{ {y_{1} } \cr {y_{2} } \cr } } \right]{\equals}\left[ {\matrix{ {X_{{\rm 1}} } \cr {\rm 0} \cr } } \right.{\rm }\left. {\matrix{ {\rm 0} \cr {X_{{\rm 2}} } \cr } } \right]\left[ {\matrix{ {b_{{\rm 1}} } \cr {b_{{\rm 2}} } \cr } } \right]{\plus}\left[ {\matrix{ {Z_{{\rm 1}} } \cr {\rm 0} \cr } } \right.\left. {\matrix{ {\rm 0} \cr {Z_{{\rm 2}} } \cr } } \right]\left[ {\matrix{ {u_{{\rm 1}} } \cr {u_{{\rm 2}} } \cr } } \right]{\plus}\left[ {\matrix{ {e_{1} } \cr {e_{2} } \cr } } \right]$$
with expectation
 $$E\left[ {\matrix{ {y_{1} } \cr {y_{2} } \cr } } \right]{\equals}\left[ {\matrix{ {X_{{\rm 1}} } \cr {\rm 0} \cr } } \right.\left. {\matrix{ {\rm 0} \cr {X_{{\rm 2}} } \cr } } \right]\left[ {\matrix{ {b_{{\rm 1}} } \cr {b_{{\rm 2}} } \cr } } \right]$$
and variance
 $$E\left[ {\matrix{ {u_{{\rm 1}} } \cr {u_{{\rm 2}} } \cr {e_{1} } \cr {e_{2} } \cr } } \right]{\equals}\left[ {\matrix{ {A\sigma _{{A1}}^{2} } \cr {A\sigma _{{2,1}} } \cr 0 \cr 0 \cr } } \right.\matrix{ {A\sigma _{{1,2}} } \cr {A\sigma _{{A2}}^{2} } \cr 0 \cr 0 \cr } \matrix{ 0 \cr 0 \cr {I\sigma _{{E1}}^{2} } \cr {I\sigma _{{2,1}} } \cr } \left. {\matrix{ 0 \cr 0 \cr {I\sigma _{{1,2}} } \cr {I\sigma _{{E2}}^{2} } \cr } } \right]$$
where y 1 and y 2 are observations, Aσ A1,A2 is the additive genetic covariance between y 1 and y 2, and Iσ E1,E2 is the residual covariance between y 1 and y 2.
Results and discussion
Descriptive statistics of fatty acid compositions
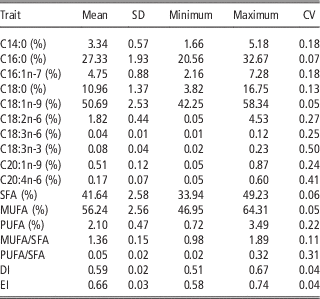
The mean, SD and CV for fatty acids and fatty acid classes and indices are listed in Table 1. Three major fatty acids, C16:0, C18:0 and C18:1n-9, accounted for 88.98% of fatty acids in intramuscular fat; two major saturated fatty acids (SFAs), C16:0 and C18:0, accounted for 27.33% and 10.96%, respectively. Similarly, Cho et al. (Reference Cho, Park, Kim, Hwang, Kim and Lee2005) and Jung et al. (Reference Jung, Nam, Lee, Kim and Jo2013) reported C16:0 and C18:0 contents in LD muscles of Hanwoo cattle of 24.94% to 29.00% and 9.6% to 11.66%, respectively. Tait et al. (Reference Tait, Zhang, Knight, Strohbehn, Beitz and Reecy2008) and Sakuma et al. (Reference Sakuma, Saito, Kohira, Ohhashi, Shoji and Uemoto2017) also reported similar results for C16:0 and C18:0 in Angus and Japanese Black cattle. In our study, the most abundant fatty acid was C18:1n-9 (50.69%). Similar concentrations were reported by Cho et al. (Reference Cho, Park, Kim, Hwang, Kim and Lee2005) in Hanwoo cattle (49.88%), and by Nogi et al. (Reference Nogi, Honda, Mukai, Okagaki and Oyama2011) in Japanese Black cattle (51.0%). However, lower estimates (39.50% to 41.34%) were reported by Buchanan et al. (Reference Buchanan, Reecy, Garrick, Duan, Beitz and Mateescu2015) in Angus cattle, and by Ekine-Dzivenu et al. (Reference Ekine-Dzivenu, Chen, Vinsky, Aldai, Dugan, McAllister, Wang, Okine and Li2014) in Canadian crossbred beef cattle. In contrast, higher C18:1n-9 contents were reported by Cecchinato et al. (Reference Cecchinato, Marchi, Penasa, Casellas, Schiavon and Bittante2012) in young Piedmontese bulls (56.6%), as measured with near-infrared spectroscopy.
Descriptive statistics for fatty acid compositions in Hanwoo cattle (n=1000)

C14:0=myristic acid; C16:0=palmitic acid; C16:1n-7=palmitoleic acid; C18:0=stearic acid; C18:1n-9=oleic acid; C18:2n-6=linoleic acid; C18:3n-6=γ-linoleic acid; C18:3n-3=linolenic acid; C20:1n-9=eicosenoic acid; C20:4n-6=arachidonic acid; SFA (sum of saturated fatty acid)=C14:0+C16:0+C18:0; MUFA (sum of monounsaturated fatty acid)=C16:1n-7+C18:1n-9+C20:1n-9; PUFA (sum of polyunsaturated fatty acid)=C18:2n-6+C18:3n-6+C18:3n-3+C20:4n-6; DI (desaturation index)=(C16:1+C18:1n-9)/(C16:0+C16:1+C18:0+C18:1n-9), EI (elongation index)=(C18:0+C18:1n-9)/(C16:0+C16:1+C18:0+C18:1n-9).
Differences within and/or between cattle populations, and in the number of samples, fatty acid assessment methods, and uptake of exogenous fatty acids have been found to influence the results of analyses of the fatty acid compositions of beef (De Smet et al., Reference De Smet, Raes and Demeyer2004). The concentration of linoleic acid (C18:2n-6) was the highest (1.82%) among the polyunsaturated fatty acids (PUFAs), and was similar to the concentrations in LD muscles of Hanwoo cattle (1.96%) reported by Cho et al. (Reference Cho, Park, Kim, Hwang, Kim and Lee2005). However, γ-linoleic acid (C18:3n-6) had the lowest proportion (0.04%) among all of the fatty acids analysed in this study.
The proportions of SFAs, MUFAs and PUFAs were 41.64%, 56.24% and 2.10%, respectively, similar to those reported by Cho et al. (Reference Cho, Park, Kim, Hwang, Kim and Lee2005) and Choi et al. (Reference Choi, Kwon, Kim, Yang, Lee and Park2016) from the longissimus muscle (LM) of Hanwoo steers (42.83% to 43.36%, 53.67% to 54.02% and 2.62% to 3.39%, respectively). Jung et al. (Reference Jung, Nam, Lee, Kim and Jo2013) also reported similar SFA (40.61%) and MUFA (54.25%) contents in LD muscles of Hanwoo steers, but found twice the PUFA content reported here (5.13%); higher C18:2n-6 content (3.39%) in that population may account for this discrepancy. Our results are similar to those reported by Buchanan et al. (Reference Buchanan, Reecy, Garrick, Duan, Beitz and Mateescu2015) and Sakuma et al. (Reference Sakuma, Saito, Kohira, Ohhashi, Shoji and Uemoto2017), who found that MUFAs were most abundant (51.57% to 57.74%) in beef breeds, followed by SFAs (40.50% to 45.81%) and PUFAs (2.40% to 2.62%). However, Lemos et al. (Reference Lemos, Chiaia, Berton, Feitosa, Aboujaoud, Camargo, Pereira, Albuquerque, Ferrinho, Mueller, de Oliveira, Duckett, Aguilar and Baldi2016) reported different concentrations for MUFAs (37.88%) and PUFAs (13.42%) in Nellore cattle. This may be due to differences between indicine and taurine beef breeds and feedlot conditions. The MUFA/SFA ratio of this study was 1.36, similar to that reported by Choi et al. (Reference Choi, Kwon, Kim, Yang, Lee and Park2016) in Hanwoo steers (1.26±0.12). The PUFA/SFA ratio in this study was 0.05, similar to that reported by De Smet et al. (Reference De Smet, Raes and Demeyer2004) and Cho et al. (Reference Cho, Park, Kim, Hwang, Kim and Lee2005). In general, beef from pasture-fed animals contains more PUFAs than that from grain-fed animals because the major contributor of PUFAs, C18:2n-6, is mainly derived from forage sources and is not synthesised by desaturation processes in animal tissues (Smith et al., Reference Smith, Gill, Lunt and Brooks2009). The estimated DI and EI were 59.0% and 66.0%, respectively, similar to values reported in Japanese Black cattle by Nogi et al. (Reference Nogi, Honda, Mukai, Okagaki and Oyama2011). However, Pitchford et al. (Reference Pitchford, Deland, Siebert, Malau-Aduli and Bottema2002) reported a higher DI value (74.1%) in crossbred beef cattle. DI reflects desaturation activity of stearic acid to produce MUFAs. The C18:1n-9 content is largely depended on the availability of C18:0 and the activity of stearoyl-CoA desaturase (SCD) enzyme. Stearoyl-CoA desaturase, also known as Δ9-desaturase, is primarily responsible for fatty acid metabolism, particularly from C18:0 to MUFAs in mammalian adipocytes. Grain-based rations stimulate Δ9-desaturase activity for MUFA biosynthesis, and genetic variation in the SCD gene is associated with MUFA contents in cattle (Taniguchi et al., Reference Taniguchi, Utsugi, Oyama, Mannen, Kobayashi, Tanabe, Ogino and Tsuji2004). The ratio of the conversion from 16 to 18 carbon atoms (palmitic to stearic acid) is expressed as EI, and our findings are consistent with those of Pitchford et al. (Reference Pitchford, Deland, Siebert, Malau-Aduli and Bottema2002), who reported the value of 64.8%. The CVs of individual SFAs and UFAs were 7.0% to 18.0% and 5.0% to 50.0%, respectively; low concentrations of PUFAs contributed to higher CV values. These results are consistent with those of Krag et al. (Reference Krag, Poulsen, Larsen, Larsen, Janss and Buitenhuis2013), who found CVs of DI and EI values for fatty acids of 4.6% to 28.6% and 3.9% to 4.2%, respectively.
Heritability estimates
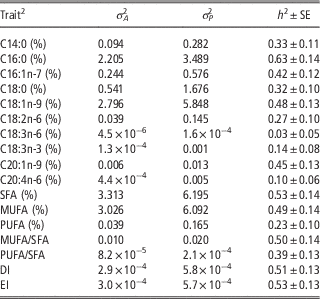
Variance components, h 2 estimates, and their standard errors for fatty acids are presented in Table 2. Our h 2 estimates were 0.03 to 0.63 with standard errors of 0.05 to 0.14. The h 2 estimates were moderate to high in SFAs (0.32±0.10 to 0.63±0.14) and MUFAs (0.42±0.12 to 0.48±0.13), while low to moderate h 2 estimates (0.03±0.05 to 0.45±0.13) were observed in PUFAs. Our results are similar to those of Buchanan et al. (Reference Buchanan, Reecy, Garrick, Duan, Beitz and Mateescu2015), who reported h 2 estimates for SFAs from 0.43±0.08 to 0.58±0.03 in Angus cattle. Relatively higher h 2 estimates of 0.56±0.17 to 0.84±0.18 have been reported for C14:0, C16:0, C18:0 and SFAs in Japanese Black cattle (Inoue et al., Reference Inoue, Kobayashi, Shoji and Kato2011; Nogi et al., Reference Nogi, Honda, Mukai, Okagaki and Oyama2011). However, estimates of 0.12 to 0.27 for C14:0, C16:0, C18:0 and total SFAs have also been reported in other cattle breeds (Pitchford et al., Reference Pitchford, Deland, Siebert, Malau-Aduli and Bottema2002; Ekine-Dzivenu et al., Reference Ekine-Dzivenu, Chen, Vinsky, Aldai, Dugan, McAllister, Wang, Okine and Li2014). These differences may be due to breed, fatty acid determination methods and the statistical models used for variance component estimations. Above all, moderate to high h 2 estimates of SFAs suggest the existence of substantial genetic variation in the studied population and the possibility of manipulating SFA compositions through selection.
Estimates of variance components and heritability estimates for fatty acid compositions in Hanwoo cattleFootnote 1 (n=1000)

1 Descriptive statistics and heritability estimates of carcass and meat quality traits are listed in Supplementary Material Tables S1 and S2, respectively.
2 See Table 1 for trait abbreviations.
In our study, the h 2 estimates of MUFAs and C18:1n-9 were 0.49±0.14 and 0.48±0.13, respectively. Buchanan et al. (Reference Buchanan, Reecy, Garrick, Duan, Beitz and Mateescu2015) also reported high h 2 estimates for MUFAs (0.46±0.08) and moderate ones for C18:1n-9 (0.33±0.08) using the LM of Angus cattle. However, relatively low h 2 estimates for these two traits were reported by Malau-Aduli et al. (Reference Malau-Aduli, Edriss, Siebert, Bottema and Pitchford2000) in several beef breeds (0.14±0.01 and 0.05±0.07, respectively) and by Cecchinato et al. (Reference Cecchinato, Marchi, Penasa, Casellas, Schiavon and Bittante2012) in Piedmontese bulls (0.20 and 0.21, respectively). In contrast, the present h 2 estimates for MUFAs and C18:1n-9 are lower than those reported by Inoue et al. (Reference Inoue, Kobayashi, Shoji and Kato2011) and Sakuma et al. (Reference Sakuma, Saito, Kohira, Ohhashi, Shoji and Uemoto2017), which varied between 0.57±0.18 and 0.78±0.09. Notably, to obtain better marbling, grain-based feeding, which influences higher expression of the SCD gene responsible for MUFA synthesis, has a long history in Japan and South Korea (Taniguchi et al., Reference Taniguchi, Utsugi, Oyama, Mannen, Kobayashi, Tanabe, Ogino and Tsuji2004; Smith et al., Reference Smith, Gill, Lunt and Brooks2009). Overall, high h 2 estimates for MUFAs reflect the existence of considerable genetic variation in the Hanwoo population, which could be used to improve the genetics of this trait through selection.
The h 2 estimates for C18:2n-6 (the most abundant PUFA) and total PUFA contents were 0.27±0.10 and 0.23±0.10, respectively (Table 2). Our results are similar to those of Tait et al. (Reference Tait, Zhang, Knight, Bormann, Strohbehn, Beitz and Reecy2007), who reported h 2 estimates of 0.23±0.10 for C18:2n-6 in Angus cattle. Relatively low h 2 estimates for C18:2n-6 and total PUFA contents were also reported by Cecchinato et al. (Reference Cecchinato, Marchi, Penasa, Casellas, Schiavon and Bittante2012) and Buchanan et al. (Reference Buchanan, Reecy, Garrick, Duan, Beitz and Mateescu2015) in different beef cattle breeds (0.11±0.10 to 0.17±0.13). However, Nogi et al. (Reference Nogi, Honda, Mukai, Okagaki and Oyama2011) reported h 2 estimates for these two traits of 0.58±0.09 and 0.47±0.08, respectively, in Japanese Black cattle. High h 2 estimates, particularly in this breed, may indicate a strong genetic influence and the resulting effects of selection efforts in which fatty acid compositions have not been the target (Ekine-Dzivenu et al., Reference Ekine-Dzivenu, Chen, Vinsky, Aldai, Dugan, McAllister, Wang, Okine and Li2014). Lower estimates of h 2 for other PUFAs (i.e. C18:3n-6, C18:3n-3 and C20:4n-6) reflect insignificant influences of additive gene actions and stronger effects of environmental factors (rumen environment and type of feed) on their concentrations in the LD muscle. Therefore, molecular-marker-assisted selection may be effective for genetic improvement of these traits.
The h 2 estimates of MUFA/SFA and PUFA/SFA were 0.50±0.14 and 0.39±0.13, respectively. A similar estimate for MUFA/SFA (0.48±0.17) was reported by Sakuma et al. (Reference Sakuma, Saito, Kohira, Ohhashi, Shoji and Uemoto2017), while Tait et al. (Reference Tait, Zhang, Knight, Bormann, Strohbehn, Beitz and Reecy2007) reported a slightly lower estimate (0.41±0.13). High estimates of MUFA/SFA and PUFA/SFA (0.63±0.09 to 0.75±0.10) were reported by Nogi et al. (Reference Nogi, Honda, Mukai, Okagaki and Oyama2011). In our study, the h 2 estimates of DI and EI were 0.51±0.13 and 0.53±0.13, respectively, which are much higher than those previously reported in the LMs of different cattle breeds and crossbreeds (0.10±0.08 to 0.19±0.02; Malau-Aduli et al., Reference Malau-Aduli, Edriss, Siebert, Bottema and Pitchford2000; Pitchford et al., Reference Pitchford, Deland, Siebert, Malau-Aduli and Bottema2002). Tait et al. (Reference Tait, Zhang, Knight, Bormann, Strohbehn, Beitz and Reecy2007) reported moderate estimates of h 2 for DI (0.41±0.13) and EI (0.29±0.11), whereas Nogi et al. (Reference Nogi, Honda, Mukai, Okagaki and Oyama2011) and Inoue et al. (Reference Inoue, Kobayashi, Shoji and Kato2011) reported higher values for those traits (0.67±0.09 to 0.80±0.09) in Japanese Black cattle.
Generally, h 2 estimates for fatty acid compositions vary across studies, particularly among the types of tissues and breeds. This may be due to differences in the genetic mechanisms of fatty acid biosynthesis in various tissues or differences in the genetics of beef cattle breeds or populations (Smith et al., Reference Smith, Gill, Lunt and Brooks2009; Ekine-Dzivenu et al. Reference Ekine-Dzivenu, Chen, Vinsky, Aldai, Dugan, McAllister, Wang, Okine and Li2014). In addition, some other non-genetic factors such as amount and type of fat in feed, foraging, microbial fermentation in the rumen, de novo synthesis rate, desaturation and elongation of fatty acids may greatly influence the variation in fatty acid compositions (De Smet et al., Reference De Smet, Raes and Demeyer2004; Webb and O’Neill, Reference Webb and O’Neill2008). Most previous studies have reported low to moderate estimates of h 2 for fatty acid compositions, except those that have investigated Japanese Black cattle, where moderate to high estimates have been reported. The h 2 estimates of this study suggest that additive gene actions may be useful for further genetic improvements of traits related to fatty acids in Hanwoo cattle.
Correlations among fatty acids
The genetic and phenotypic correlations among individuals and fatty acid groups are shown in Table 3. The genetic correlation between C14:0 and C16:0 was positive and high (0.67) but weak and negative between C14:0 and C18:0 (−0.06), and between C16:0 and C18:0 (−0.06). Similarly, Buchanan et al. (Reference Buchanan, Reecy, Garrick, Duan, Beitz and Mateescu2015) reported a strong, positive genetic correlation between C14:0 and C16:0 (0.64) and relatively weak, negative correlations between C14:0 and C18:0 (−0.30), and between C16:0 and C18:0 (−0.19) in Angus cattle. Inoue et al. (Reference Inoue, Kobayashi, Shoji and Kato2011) reported strong, positive genetic (0.70) and phenotypic (0.68) correlations between C14:0 and C16:0; however, they reported weak, positive genetic correlations among the SFAs (C14:0, C16:0 and C18:0) that varied from 0.16 to 0.28. A strong, positive genetic correlation between C14:0 and C16:0 suggests shared de novo synthesis that is regulated by similar or closely linked genes and may also originate from the same source of carbohydrate and volatile fatty acid precursors in animal tissues and organs (Mapiye et al., Reference Mapiye, Aldai, Turner, Aalhus, Rolland, Kramer and Dugan2012). Strong, positive phenotypic correlations also indicate similar environmental influences on these two traits. The negative genetic correlations of C18:0 with C14:0 and C16:0 suggest that host genes regulating elongation processes may affect de novo synthesis of C14:0 and C16:0, and therefore, elongation may reduce the concentrations of short-chain fatty acids (Ekine-Dzivenu et al., Reference Ekine-Dzivenu, Chen, Vinsky, Aldai, Dugan, McAllister, Wang, Okine and Li2014). On the other hand, C18:0 synthesis also takes place in the rumen through bio-hydrogenation of 18:2n-6 and 18:3n-3. Discrepancies with previous studies may be due to differences in genotypes and associated genes responsible for de novo synthesis of long-chain SFAs among cattle populations.
Estimates of genetic and phenotypic correlation with SE between fatty acids in Hanwoo cattleFootnote 1

Values in the parentheses indicate SE of respective trait.
1 Genetic correlations are in the above diagonal and phenotypic correlations are in the below diagonal.
2 See Table 1 for trait abbreviations.
C18:1n-9 had strong, negative correlations with C14:0, C16:0 and total SFAs at both the genetic (−0.76 to −0.92) and phenotypic levels (−0.73 to −0.87), whereas the genetic and phenotypic correlations between C18:1n-9 and C18:0 were relatively weak and negative (−18.0 and −23.0, respectively). This is consistent with the findings of Inoue et al. (Reference Inoue, Kobayashi, Shoji and Kato2011) and Buchanan et al. (Reference Buchanan, Reecy, Garrick, Duan, Beitz and Mateescu2015). Malau-Aduli et al. (Reference Malau-Aduli, Edriss, Siebert, Bottema and Pitchford2000) also reported strong, negative genetic correlations between C18:1n-9 and C16:0 (−1.00) and between C18:1n-9 and C18:0 (−0.81). The favourable (negative) correlations that we found suggest that selection for C18:1n-9 may decrease the amount of SFAs proportionally in Hanwoo beef and also suggest the involvement of a distinct set of host genes for their synthesis. Furthermore, two PUFAs, C18:2n-6 and C18:3n-3, had strong, positive genetic correlations with each other (0.78) and with C18:1n-9 (0.50 and 0.28, respectively). In contrast, their correlations with SFAs were moderate to strong and negative, except that between C18:3n-3 and C18:0 (0.54). The latter correlation may be linked with the bio-hydrogenation process in which C18:3n-3 is converted into C18:0 by rumen microflora. Overall, we found antagonistic relationship between SFAs and UFAs. This results suggest that the amount of MUFAs and PUFAs in beef could be improved further through selection without increasing the contents of SFAs. Although the concentration of C18:0 increases proportionally with SFAs, it is considered a neutral fatty acid and not detrimental to human health (Webb and O’Neill, Reference Webb and O’Neill2008).
The genetic and phenotypic correlations between SFAs and MUFAs were strong and negative (−0.98 and −0.97, respectively), and those between SFAs and PUFAs were low to moderate and negative (−0.64 and −0.17, respectively). Moreover, total MUFAs and PUFAs had favourable, moderate to strong, positive genetic correlations with individual MUFAs and PUFAs (Table 3). Similar significant, negative correlations between those traits were found by Malau-Aduli et al. (Reference Malau-Aduli, Edriss, Siebert, Bottema and Pitchford2000) and Buchanan et al. (Reference Buchanan, Reecy, Garrick, Duan, Beitz and Mateescu2015). The antagonistic correlations of SFAs with MUFAs and PUFAs suggest distinct underlying genetic pathways in de novo lipid synthesis or in saturation or desaturation processes. Therefore, selection against SFAs may increase MUFA contents proportionally in subsequent generations, but the effect on PUFAs remains because of the major non-genetic influences between SFAs and PUFAs.
Monounsaturated fatty acids and PUFAs had a moderate, positive genetic correlation (0.53; Table 3) but the absence of a phenotypic correlation between them suggests potential non-genetic influence and there would be moderate improvement in PUFA contents when selecting for increased MUFA in beef. The PUFA contents in beef adipose and muscle tissues are related to the amounts in feed (forage) rather than genetic factors (Wood et al., Reference Wood, Enser, Fisher, Nute, Sheard, Richardson, Hughes and Whittington2008; Smith et al., Reference Smith, Gill, Lunt and Brooks2009). The genetic and phenotypic correlations between MUFAs and DI (0.99 and 0.96, respectively) and between MUFAs and EI (0.77 and 0.69, respectively) were strong and favourable. Our result is almost similar to the genetic and phenotypic correlations between MUFA and EI (0.67 and 0.57, respectively), reported by Inoue et al. (Reference Inoue, Kobayashi, Shoji and Kato2011). The results of this and previous studies suggest that these traits are influenced by the same gene or set of genes, in which the SCD gene plays a significant role in the desaturation process for MUFA synthesis in Japanese Black cattle (Taniguchi et al., Reference Taniguchi, Utsugi, Oyama, Mannen, Kobayashi, Tanabe, Ogino and Tsuji2004; Nogi et al., Reference Nogi, Honda, Mukai, Okagaki and Oyama2011) as well as in Korean Hanwoo cattle (Oh et al., Reference Oh, Lee and Yeo2011). As expected, SFAs had strong, negative genetic and phenotypic correlations with DI (−0.99 and −0.98, respectively) and EI (−0.77 and −0.72, respectively). These results reflect distinct genetic pathways for saturation and desaturation processes. Furthermore, PUFAs had moderate genetic correlations with DI (0.59) and EI (0.57). The genetic correlation between DI and EI was also strong and positive (0.75), supported by the findings of Malau-Aduli et al. (Reference Malau-Aduli, Edriss, Siebert, Bottema and Pitchford2000).
Correlations between carcass traits including meat quality and fatty acid compositions
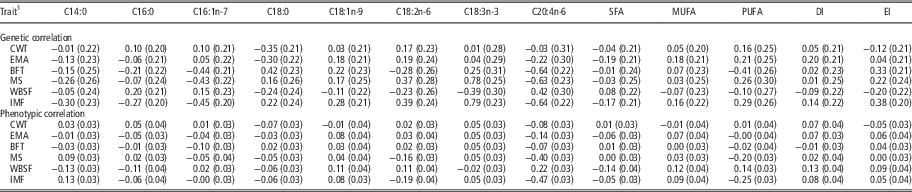
The genetic and phenotypic correlations between carcass traits including meat quality and fatty acid compositions are shown in Table 4. The genetic correlations of C14:0 and C16:0 with carcass and meat-quality traits (CWT, EMA, BFT, MS, WBSF and IMF) were weak and mostly negative (−0.01 to −0.30). On the other hand, C18:0 had negative, moderate genetic correlations with CWT (−0.35), EMA (−0.23) and WBSF (−0.24), and moderate, positive correlations with BFT (0.42), MS (0.16) and IMF (0.22). Moreover, total SFAs had weak to moderate, negative genetic correlations (−0.01 to −0.19) with all of the carcass and meat-quality traits except WBSF (0.08). Our results are somewhat consistent with the findings of Tait et al. (Reference Tait, Zhang, Knight, Strohbehn, Beitz and Reecy2008) and Nogi et al. (Reference Nogi, Honda, Mukai, Okagaki and Oyama2011), who reported that three SFAs (C14:0, C16:0 and C18:0) had weak to moderate but negative genetic correlations with CWT and EMA (−0.01 to −0.50). Feitosa et al. (Reference Feitosa, Olivieri, Aboujaoude, Pereira, de Lemos, Chiaia, Espigolan, Tonussi, Silva, Gordo, Magalhães, Aguilar and Baldi2016) found a moderate, positive genetic correlation between WBSF and SFA (0.29) in Brazilian Nellore cattle, which is higher than what we observed. These differences may be due to muscle fibre diameter, intramuscular fat distribution and types of muscle samples used between indicine and taurine breeds. Our findings are in agreement with the low to moderate, negative genetic correlations between MS and SFAs (−0.04 to −0.35) reported by Nogi et al. (Reference Nogi, Honda, Mukai, Okagaki and Oyama2011). However, Buchanan et al. (Reference Buchanan, Reecy, Garrick, Duan, Beitz and Mateescu2015) reported that MS had weak, positive genetic correlations with C14:0 and C16:0 (0.06 to 0.08) and a negative genetic correlation with C18:0 (−0.31). Overall, the lack of associations among carcass, meat quality and fatty acid composition revealed distinct host genetic contribution for those traits. The large standard error potentially attributed with relatively small sample size in this study. The low to moderate, negative genetic and low phenotypic correlations between carcass and meat-quality traits and SFAs suggest that selecting for increased carcass and meat-quality traits would have minimal effects on SFA concentrations.
Estimates of genetic and phenotypic correlation with SE between carcass and meat quality traits and fatty acid compositions in Hanwoo cattle

CWT=carcass weight; EMA=eye muscle area; BFT=back fat thickness; MS=marbling score; WBSF=Warner–Bratzler shear force; IMF=Intramuscular fat content.
Values in the parentheses indicate SE of respective trait.
1 See Table 1 for abbreviations of fatty acids.
The genetic correlations of C18:1n-9 with CWT, EMA, BFT and MS were 0.03, 0.18, 0.22 and 0.17, respectively (Table 4). Consequently, MUFAs also had low and positive genetic correlations with these four carcass traits (0.03 to 0.18). Our results are similar to those of Nogi et al. (Reference Nogi, Honda, Mukai, Okagaki and Oyama2011) and Sakuma et al. (Reference Sakuma, Saito, Kohira, Ohhashi, Shoji and Uemoto2017), who reported values of −0.02 to 0.27 for genetic correlations of C18:1n-9 and MUFAs with CWT, EMA, BFT in Japanese Black cattle. In addition, Buchanan et al. (Reference Buchanan, Reecy, Garrick, Duan, Beitz and Mateescu2015) reported weak genetic correlations between carcass traits (EMA and MS) and MUFAs (C18:1n-9 and total MUFAs; 0.05 to 0.19); our results are similar. Pitchford et al. (Reference Pitchford, Deland, Siebert, Malau-Aduli and Bottema2002) reported that MUFAs had low but favourable genetic correlations with CWT and IMF (0.04 to 0.08); our results are in agreement. However, Feitosa et al. (Reference Feitosa, Olivieri, Aboujaoude, Pereira, de Lemos, Chiaia, Espigolan, Tonussi, Silva, Gordo, Magalhães, Aguilar and Baldi2016) reported a significantly higher correlation between MUFAs and IMF (0.90) in Nellore cattle. Therefore, selection for increased C18:1n-9 and MUFA contents may have little influence on carcass and meat-quality traits, as suggested by their low correlations in this study.
PUFAs had moderate, positive genetic correlations with CWT, EMA, MS and IMF (0.16, 0.21, 0.26 and 0.29, respectively) and moderate, negative correlations with BFT (−0.41) and WBSF (−0.10). Nogi et al. (Reference Nogi, Honda, Mukai, Okagaki and Oyama2011) found moderate and positive genetic correlations between PUFA and carcass traits (CWT, EMA and BFT; 0.32 to 0.37) but a very weak correlation between MS and PUFA (0.02). These results suggest that Hanwoo and Japanese Black cattle have similar patterns of PUFA deposition among carcass traits. Buchanan et al. (Reference Buchanan, Reecy, Garrick, Duan, Beitz and Mateescu2015) reported that MS had negative genetic and phenotypic correlations with PUFAs (−0.20 and −0.07, respectively). Our results are inconsistent and may highlight differences between Hanwoo and Angus cattle in the rate at which PUFAs are deposited as muscle phospholipids. In ruminants, PUFAs are increasingly deposited as muscle phospholipids as fat deposition increases (Wood et al., Reference Wood, Enser, Fisher, Nute, Sheard, Richardson, Hughes and Whittington2008); our results support this notion and are similar to Feitosa et al. (Reference Feitosa, Olivieri, Aboujaoude, Pereira, de Lemos, Chiaia, Espigolan, Tonussi, Silva, Gordo, Magalhães, Aguilar and Baldi2016), who reported correlations between WBSF and MUFAs (−0.06) and between WBSF and PUFAs (−0.04). Overall, our results suggest that selection for greater EMA or MS would increase the PUFA contents without compromising BFT, which would simultaneously improve meat tenderness because C18:2n-6, C18:3n-3 and total PUFA contents were negatively correlated with WBSF (−0.23 to −0.39).
In this study, DI and EI had low to moderate, positive genetic correlations with EMA, BFT, MS and IMF (0.01 to 0.38), and both correlated negatively with WBSF (−0.09 and −0.20, respectively). The genetic correlation between DI and CWT was 0.05 but EI had a negative genetic correlation with CWT (−0.12). Pitchford et al. (Reference Pitchford, Deland, Siebert, Malau-Aduli and Bottema2002) reported that DI had positive genetic correlations with CWT and IMF (0.09 to 0.12). Although our results are similar, they also found that EI had very weak correlations with these two traits (−0.04 to 0.02). Our results regarding genetic correlations of DI and EI with EMA, BFT and MS (0.01 to 0.25) are close to those of Nogi et al. (Reference Nogi, Honda, Mukai, Okagaki and Oyama2011). In general, the genetic correlations between fatty acid traits and carcass and meat-quality traits are low and inconsistent among studies, which may, in some cases, reflect distinct genetic contributions of host genes for controlling those traits. Notably, phenotypic correlations between carcass and fatty acid-related traits were low or near zero in both this and previous studies, suggesting potential non-additive gene actions (i.e. interactions between host genes and environmental factors minimise existing genetic associations).
In conclusion, our results reveal considerable genetic variation among fatty acids in LD muscles of Korean Hanwoo cattle. Moderate to high h 2 estimates of SFAs and MUFAs indicate the potential of additive genetic effects, which could be exploited through selection. However, lower h 2 estimates of some PUFAs limit that scope; improving those traits could be achieved through feed manipulation and molecular-marker-assisted selection of breeding animals. The strong genetic correlations among fatty acids suggest that similar sets of genes or linked genes are involved in their biosynthesis pathways and that it may be possible to improve correlated traits simultaneously. Furthermore, the genetic relationships between fatty acids and carcass and meat-quality traits were generally low and there was no evidence of severe antagonism among them, suggesting that these traits can be improved simultaneously. It is worth mentioning that, to date, several previous studies across different beef cattle breeds have estimated h 2 and genetic correlations among fatty acids in beef; our results are the first reported for Hanwoo cattle. Nonetheless, our findings provide a foundation for future studies and offer critical genetic information that could be used in Hanwoo cattle breeding schemes to improve fatty acid profiles in beef.
Acknowledgements
This study was supported by awards from the AGENDA project (Grant No. PJ01029102) and the Molecular Breeding Program (PJ0118422017) of the Next Generation BIOGREEN21 project of the National Institute of Animal Science, Rural Development Administration, South Korea.
Supplementary material
To view supplementary material for this article, please visit https://doi.org/10.1017/S1751731117001872