


INTRODUCTION
Given its symbolic and utilitarian value, obsidian was perhaps the most significant material in the Mesoamerican cultural suite. The production and trade of obsidian may have even been one of the key factors in the economic and sociopolitical power at Teotihuacan, Tula, and Tenochtitlan, for example, due to the associated transport costs and the skill required in the production of quality blades (Sanders and Santley Reference Sanders, Santley, Vogt and Levanthal1983). As is evident there and elsewhere, the study of obsidian can be a critical resource for understanding cultures across Mesoamerica. To these ends, archaeologists have expended great effort in the study of obsidian and there is no shortage of inquiry into its usage, production, and distribution.
Indeed, obsidian is found at nearly every Mesoamerican site. Natural obsidian outcrops are abundant in many parts of Mesoamerica, but especially in West Mexico. Most sites in the Maya highlands, for example, feature one or all of three obsidian sources in variable amounts from El Chayal, Ixtepeque, and San Martín Jilotepeque (Braswell Reference Braswell, Smith and Berdan2003, Reference Braswell2013; Daniels and Braswell Reference Daniels and Braswell2013; Haines and Glascock Reference Haines and Michael D.2012; Harbottle et al. Reference Harbottle, Neff, Bishop, Willey, Leventhal, Demerest and Fash1999; Moholy-Nagy et al. Reference Moholy-Nagy, Asaro and Stross1984), while the vast majority of obsidian found in the lowland Maya region is from El Chayal (Silva de la Mora Reference Silva de la Mora2018). In central Mexico, Sierra de Pachuca and Otumba obsidians were the most common sources exploited and constituted a significant portion of the market economy (Aoyama Reference Aoyama, Levine and Carballo2015; Carballo et al. Reference Carballo, Carballo and Neff2007; Johnson Reference Johnson2016; Levine Reference Levine2015b; Moholy-Nagy et al. Reference Moholy-Nagy, James Meierhoff and Kestle2013; Santley Reference Santley and Hirth1984; Silva de la Mora Reference Silva de la Mora2018; Spence Reference Spence1981, Reference Spence1996; Sharer Reference Sharer and Miller1983). Elsewhere, the Ucarero-Zinapécuaro source dominated the region of Michoacán (Healan Reference Healan1997; Hernández and Healan Reference Hernández and Healan2008; Pollard Reference Pollard1972, Reference Pollard1993; Pollard et al. Reference Pollard, Hirshman, Neff, Glascock, Williams and Weigand2001; Rebnegger Reference Rebnegger2010). Yet, in regards to the Aztatlan tradition further to the west, there have been comparatively fewer studies. There, high-quality obsidian conducive to blade making is readily available at many sources (Glascock et al. Reference Glascock, Weigand, Esparza-López, Ohnersorgen, Ambriz, Mountjoy, Andrew Darling, Kuzmin and Glascock2010). Nonetheless, we know obsidian to have been traded extensively, even to settlements that had access to nearby sources. As such, by studying the ubiquitous obsidian consumption and its patterns of use, we can better understand the cultural dynamics of Western Mexico and subsequently compare these patterns to broader Mesoamerica.
In an exceptionally exhaustive study, Stark et al. (Reference Stark, Boxt, Gasco, González Lauck, Hedgepeth Balkin, Joyce, King, Knight, Robert Kruge, Levine, Lesure, Mendelsohn, Navarro-Castillo, Neff, Ohnersorgen, Pool, Mark Raab, Rosenswig, Venter, Voorhies, Williams and Workinger2016) recently reviewed obsidian usage across the entirety of Mesoamerica. Their study included 68 sites stretching from Nayarit to Guatemala, with dates ranging from the Initial Formative (2000–1500 b.c.) to the Late Postclassic (a.d. 1350–1521). They identified trends in obsidian usage that were generally similar from one site to the next. These patterns include an increase in blade importation and more widespread distribution within sites as costs were reduced through more efficient reduction techniques over time and the advent of broader trade networks. They also identified some variation, however, between sites large enough to warrant further study. Though their exhaustive work did well to summarize obsidian usage for Mesoamerica, there is yet much to learn. West Mexico (and the coastal plain in particular) was on the periphery of Mesoamerica, and people there had less interaction with the cultural centers in central Mexico where prototypical Mesoamerican cultural traits were widespread. In these peripheral regions, should we expect patterns of obsidian use and consumption similar to those noted by Stark et al. (Reference Stark, Boxt, Gasco, González Lauck, Hedgepeth Balkin, Joyce, King, Knight, Robert Kruge, Levine, Lesure, Mendelsohn, Navarro-Castillo, Neff, Ohnersorgen, Pool, Mark Raab, Rosenswig, Venter, Voorhies, Williams and Workinger2016) elsewhere? Given the widespread market economy of the Postclassic Aztatlan tradition, a regional study of obsidian use along the coastal plain can not only compare this peripheral region to the heart of Mesoamerica, but can also provide a better understanding of West Mexican obsidian use at a multiscalar level.
The necessity of specialized craftspeople (Clark Reference Clark1982, Reference Clark and Hirth2003a, Reference Clark2007; Titmus and Clark Reference Titmus, Clark and Hirth2003) for blade production and their possible absence at specific sites may have played a role in the necessary trade of prismatic blades in the past. But other factors likely also affected obsidian distribution, including the tasks for which a particular source was utilized, transport cost, rarity, the social and economic relationships facilitated through its exchange, and the symbolic power of a particular source (Hayden Reference Hayden1998; Pierce Reference Pierce2017b; Quinn Reference Quinn, Goodale and Andrefsky2015; Saunders Reference Saunders2001, Reference Saunders, Boivin and Owoc2004; see Levine and Carballo's [Reference Aoyama, Levine and Carballo2015] volume for particular focus on this topic). While we do have some indication which sources were used in Western Mexico based upon previous studies (Darling Reference Darling1993; Darras Reference Darras and Desrosiers2012; Liot Reference Liot, Reveles and Schondube2006, Reference Liot, Ramirez, Reveles, Melgarejo and Faugére2007; Pierce Reference Pierce2015a, Reference Pierce2017a, Reference Pierce2017b; Reveles Reference Reveles, Valdez, Schondube and Emphoux2005; Soto de Arachevaleta Reference Soto de Arachevaleta1982; Spence et al. Reference Spence, Weigand, de Arechavaleta, Hirth and Andrews2002; Weigand and Spence Reference Weigand and Spence1982), a comprehensive study comprised of an array of sites along the coastal plain can be particularly informative in better understanding how Western Mexico obsidian use compares to broader Mesoamerican trends.
In this study, over 12,000 obsidian artifacts have been analyzed from numerous sites along the coastal plain, 3,867 of which were previously sourced by Ohnersorgen et al. (Reference Ohnersorgen, Glascock, Mountjoy and Ambriz2012). These analyses contribute to the identification of patterns in source usage through time and across space within a regional context. The total collection includes assemblages from five major Aztatlan sites that peaked in the Early/Middle Postclassic (a.d. 900–1350): San Felipe Aztatan, Coamiles, Chacallila, Amapa, and Peñitas. The focus is on determining the source of these artifacts including formal tools, blades, and debitage and identifying synchronic and diachronic variation in use. Using portable X-ray fluorescence (pXRF), provenance was established for nearly all of the specimens. From these results, site-specific and regional diachronic and synchronic patterns in obsidian usage were then identified. Subsequently, obsidian usage by the Aztatlan culture during this crucial period of West Mexican prehistory is clarified.
BACKGROUND
Obsidian in Ancient Mesoamerica
Throughout much of Mesoamerica, obsidian was the material of choice for stone tool production due to its functional advantages over other flaked stone materials such as chert. Its unique genesis results in a general lack of inclusions (Shackley Reference Shackley2005), which facilitates easy and predictable crack propagation. These characteristics make it an ideal raw material for producing most kinds of flaked stone tools. Obsidian is typically black in color with hints of secondary hues dependent upon the chemistry. Most famously, the well-known green obsidian of Sierra de Pachuca (also referred to as Sierra de las Navajas) is commonly found throughout Mesoamerica and was highly sought after due to its excellent quality and unique color (Levine Reference Levine, Levine and Carballo2015a; Miller and Taube Reference Miller and Taube1993; Ponomarenko Reference Ponomarenko2004; Santley Reference Santley and Hirth1984; Spence Reference Spence1981). Studies have indicated that the slight variation in hues, opacity, and textures can often be visible indicators of the precise volcanic source from which the artifact originated, with enough familiarity of the researcher (Braswell et al. Reference Braswell, Gunn, del Rosario, Carrasco, Folan, Fletcher, Lopez, Glascock, Demarest, Rice and Rice2004; Carpio Rezzio Reference Carpio Rezzio, Bove, Medrano, Lou and Arroyo1993; McKillop Reference McKillop, Guderjan and Garber1995; Pierce Reference Pierce2015a, Reference Pierce2017b; Rebnegger Reference Rebnegger2010; Sánchez Polo Reference Sánchez Polo1991). As such, pre-contact users of obsidian may have been cognizant of its place of origin based upon appearance alone.
Though a variety of types of obsidian artifacts exist, the focus of this study is prismatic blades, formal tools, and the resulting debris from the manufacture of both. Prismatic blades are a hallmark of Mesoamerican archaeology. They are unparalleled in their sharpness and can be efficiently created with minimal waste once the core is prepared (Healan Reference Healan2009). The knowledge and skill required to produce them, however, is greater than is needed for the percussive techniques of generalized reduction for bifacial tool production (Love Reference Love, Grove and Joyce1999). For this reason, prismatic blade production would have most likely required trained specialists (Anderson and Hirth Reference Anderson and Hirth2009; Boksenbaum et al. Reference Boksenbaum, Tolstoy, Harbottle, Kimberlin and Nievens1987; Clark Reference Clark, Johnson and Morrow1987; Jackson and Love Reference Jackson and Love1991; Love and Jackson Reference Love, Jackson and Schieber de Lavarreda1998; Tabares et al. Reference Tabares, Love, Speakman, Neff, Glascock, Speakman and Neff2005). These unifacial blades are produced using a pressure flaking technology that is highly efficient in terms of raw material use and results in an exhausted core with minimal waste (Flenniken and Hirth Reference Flenniken, Hirth and Hirth2003). Toribio de Benavente Motolinía, sixteenth-century Spanish missoinary, left a first-hand account of prismatic blade production that he had witnessed: “First they get out a knife stone (obsidian core) which is black like jet and 20 cm or slightly less in length, and they make it cylindrical and as thick as the calf of the leg, and they place the stone between the feet, and with a stick apply force to the edges of the stone, and at every push they give, a little knife springs off with its edges like those of a razor” (Motolinía Reference Motolinía and Audros Foster1950:79). Based on these descriptions, many have attempted to understand and replicate traditional prismatic blade production techniques (Clark Reference Clark1982, Reference Clark1985; Crabtree Reference Crabtree1968; Hester et al. Reference Hester, Jack and Heizer1971; Hirth Reference Hirth and Hirth2003; Taube Reference Taube1991), resulting in a thorough understanding of Mesoamerican blade production by modern scholars.
The plate tectonics produced by the convergence of the Sierra Madre Occidental and the Trans Mexican Volcanic Belt have created an active volcanic zone across southeastern Nayarit, northwestern Jalisco, and southern Zacatecas resulting in an abundance of obsidian sources in the region. To date, at least 26 geochemically distinct obsidian sources have been identified there. Glascock et al. (Reference Glascock, Weigand, Esparza-López, Ohnersorgen, Ambriz, Mountjoy, Andrew Darling, Kuzmin and Glascock2010) have commented on the relative quality of these West Mexican obsidian sources and have noted that 13 of these sources are of excellent quality for tool making. These quality obsidian sources are widely dispersed and provided West Mexican populations with a variety of high-quality sources from which to choose for lithic production (Spence Reference Spence1996). Archaeologically, most recent research has focused on the source areas of northwestern Jalisco and Durango (Darling Reference Darling1993, Reference Darling1998; Darling and Hayashida Reference Darling and Hayashida1995; Esparza-López Reference Esparza-López, Weigand, Beekman and Esparza2008; Jiminez and Darling Reference Betts, Peter, Andrew Darling, Foster and Gorenstein2000; Tenorio et al. Reference Tenorio, Jiménez-Reyes, Esperaza-López, Calligaro and Grave-Tirado2015; Trombold et al. Reference Trombold, Luhr, Hasenaka and Glascock1993; Weigand Reference Weigand, Gaxiola and Clark1989; Weigand and Spence Reference Weigand and Spence1982), but scant research has considered the relationship between these sources and distribution of obsidian artifacts on the coastal plain. Similarly, few studies have focused upon the Nayarit sources (cf. Pierce Reference Pierce2016).
The Aztatlan Tradition: A Brief Overview
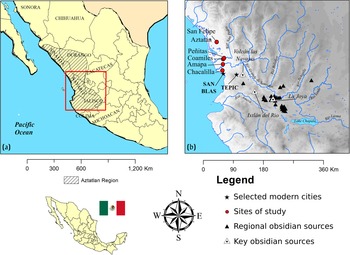
The occupation of the western coast of Nayarit and Jalisco had begun by at least the Late Archaic period (ca. 2500–1200 b.c.), and continued uninterrupted until the Spanish entrada (Mountjoy Reference Mountjoy, Foster and Gorenstein2000; Scott and Foster Reference Scott, Foster, Foster and Gorenstein2000). By the Early and Middle Postclassic (a.d. 900–1350), the Pacific coast of Nayarit, Jalisco, and southern Sinaloa emerged as the core of the far-reaching Aztatlan tradition encompassing most of northwestern Mexico, including parts of modern Guerrero, Colima, Jalisco, Nayarit, Sinaloa, Zacatecas, Durango, Sonora, Michoacán, and Chihuahua (Figure 1; Evans Reference Evans2004). Trade became one of the defining characteristics of Aztatlan culture as items were traded as far north as the southwestern United States (Foster Reference Foster, Schaafsma and Riley1999; Kelley Reference Kelley and Reyman1995; Mathien and McGuire Reference Mathien and McGuire1986; Mountjoy Reference Mountjoy, Evans and Webster2001; VanPool et al. Reference VanPool, VanPool, Rakita and Nielsen2008). While interaction with central Mexico (e.g., Teotihuacan) is evident as early as a.d. 200 (Beekman Reference Beekman2010; Jiminez Betts Reference Jiminez Betts2018; Nicholson and Quinones-Keber Reference Nicholson and Quinones Keber1994; Pierce Reference Pierce2017b; Smith and Heath-Smith Reference Smith and Heath-Smith1980), the increasing interaction led to the spread of many diagnostic Mesoamerican traits, including mound and plaza construction, into West Mexico by the Early Postclassic (Carpenter Reference Carpenter1996; Meighan Reference Meighan1976). Aztatlan pottery reflects stylistic elements that parallel the Postclassic International Style (also called the Mixteca-Puebla style), examples of which are found throughout Mesoamerica after spreading from Cholula and the Valley of Mexico (Nicholson and Quinones-Keber Reference Nicholson and Quinones Keber1994; Smith and Heath-Smith Reference Smith and Heath-Smith1980). The notable concurrent increase in other Mesoamerican traits such as ballcourts, codex-style ceramics, and feathered serpent iconography (Carpenter Reference Carpenter1996; Mathiowetz Reference Mathiowetz2018a) is a further indication of the great population movement of the Epiclassic and Early Postclassic (Jiminez Betts Reference Jiminez Betts2018) coinciding with the decline of Teotihuacan.
(a) Map of Aztatlan core region (hash lines) including study area (outlined). (b) Location of the five Aztatlan sites discussed in relation to West Mexican obsidian sources. Maps by the author.

At the heart of the Aztatlan tradition, several important regional centers arose during the Early and Middle Postclassic periods along the coastal plain, including Amapa (Grosscup Reference Grosscup1964, Reference Grosscup1976; Meighan Reference Meighan1976), Chacalilla (Ohnersorgen Reference Ohnersorgen2004, Reference Ohnersorgen2007), Coamiles (Duverger Reference Duverger1998; Garduño Ambriz Reference Garduño Ambriz2006, Reference Garduño Ambriz2013), and San Felipe Aztatan (Gamez Eternod and Garduño Ambriz Reference Gamez and Ambriz2003; Garduño Ambriz Reference Garduño Ambriz2007; Garduño Ambriz and Gamez Eternod Reference Garduño Ambriz and Eternod2005; Pierce Reference Pierce2015a), as well as several secondary sites (Mountjoy Reference Mountjoy, Foster and Gorenstein2000). This region features a rich and diverse ecosystem of abundant marine and terrestrial resources that supported large populations at numerous sites and allowed for effective agriculture (Beekman Reference Beekman2010; Beltran Reference Beltran Medina2000). Material culture at these sites typically includes common pottery types (e.g., Tuxpan Red-on-Buff, Botadero Incised, and polychromes of the Cerritos, Mangos, and Iguanas types), flat Mazapan-style figurines, clay pipes, incised spindle whorls, cylindrical stamps, shell jewelry, copper goods, urn burials, and countless obsidian tools and debitage (Ekholm Reference Ekholm1942; Foster Reference Foster, Evans and Webster2001; Glassow Reference Glassow1967; Kelly Reference Kelly1938; Mathiowetz Reference Mathiowetz2011; Mountjoy Reference Mountjoy, Foster and Gorenstein2000, Reference Mountjoy, Evans and Webster2001; Publ Reference Clark1985, Reference Publ1990). Sites also commonly contain many mounds, platforms, plazas, and ballcourts, as well as stone architectural features in some instances.
Most research in Postclassic West Mexico has sought to succinctly characterize the Aztatlan complex culturally, place it temporally and/or spatially, and account for its widespread occurrence (Bell Reference Bell, Elkholm and Bernal1971; Carpenter Reference Carpenter1996; Ekholm Reference Ekholm1942; Foster Reference Foster, Mathien and McGuire1986, Reference Foster, Schaafsma and Riley1999; Grosscup Reference Grosscup1964; Kelley Reference Kelley and Reyman1995, Reference Kelley, Foster and Gorenstein2000; Kelly Reference Kelly1938, Reference Kelly1939, Reference Kelly1945; Mountjoy Reference Mountjoy and Miranda1990, Reference Mountjoy, Foster and Gorenstein2000, Reference Mountjoy, Evans and Webster2001; Sauer and Brand Reference Sauer and Brand1932; Scott and Foster Reference Scott, Foster, Foster and Gorenstein2000). One of the chief conclusions is that there is considerable variation among sites in their manifestations of Aztatlan traits. This supposition may be a product of the very nature of how we define the Aztatlan. Unlike other Mesoamerican traditions, the Aztatlan tradition served as a “veneer,” which simply supplemented rather than supplanted existing local cultural traditions with an overlay of common Aztatlan traits (Foster Reference Foster, Schaafsma and Riley1999:156; Kelley Reference Kelley, Foster and Gorenstein2000). In other words, this tradition was not politically or economically centralized as a monolith, but was instead a loose conglomerate of locales that shared an array of cultural characteristics to a varying degree (Blanton et al. Reference Blanton, Feinman, Kowaleski and Peregrine1996; Jiminez Betts Reference Jiminez Betts2018; Lekson Reference Lekson1999; Mountjoy Reference Mountjoy, Foster and Gorenstein2000; Publ Reference Publ1986; VanPool et al. Reference VanPool, VanPool, Rakita and Nielsen2008; Wallerstein Reference Wallerstein1974). Trade is one method in which these “mutually understood ideological concepts and a common symbolic grammar” (Spence Reference Spence, Foster and Gorenstein2000:259) could have spread throughout the region. Like with linguistic grammar, cultural grammar is the shared traits which enable individuals to understand and interact within a particular social environment (Holliday Reference Holliday2018; Keesing Reference Keesing1974; Wierzbicka Reference Wierzbicka1996). Thus, understanding the material culture and the trade thereof is critical to the characterization of the Aztatlan tradition.
Sites Under Study
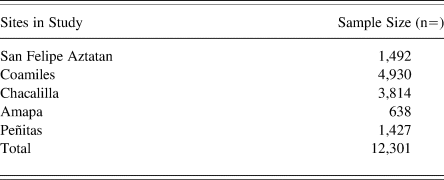
This study includes the analysis of the obsidian assemblages from five distinct Aztatlan sites located on the coastal plain of Nayarit (Figure 1). The sites have vastly different assemblage sizes (Table 1), but all assemblages are sufficiently large for statistical sampling. All differences in sample size are a direct result of the extensiveness of excavation at each site. Complete assemblages were analyzed in all cases.
Assemblages included in this study.

San Felipe Aztatan
San Felipe Aztatan was one of the largest Aztatlan regional centers and a possible production locale for obsidian artifacts (Garduño Ambriz and Gamez Eternod Reference Garduño Ambriz and Eternod2005). Large waterways connected this area to many key locations further inland. Historically, these waterways were central corridors of transportation, trade, and communication that connected the coastal plains to the highlands of Jalisco, and were similarly used to facilitate trade in pre-Columbian times (Cárdenas Reference Cárdenas, Williams and Weigand1996, Reference Cárdenas1999; Kelley Reference Kelley, Foster and Gorenstein2000; Sánchez and Marmolejo Reference Sánchez, Marmolejo and de Méndez1990; Tenorio et. al Reference Tenorio, Jiménez-Reyes, Esperaza-López, Calligaro and Grave-Tirado2015). The population of San Felipe Aztatan reached its zenith during the Cerritos (ca. a.d. 900–1100) and Ixquintla/Taste-Mazatlan phases (ca. a.d. 1100–1350), though moundfill also contains ceramics from earlier phases. The ceramic-rich collections indicate a long history of occupation reaching back to at least the Late Formative. Nonetheless, the temporally diagnostic artifacts suggest that the majority of the obsidian collected corresponds to the Classic and Postclassic periods.
Within San Felipe Aztatan, over 100 mounds and structures have been identified thus far (Garduño Ambriz Reference Garduño Ambriz2007; Sauer and Brand Reference Sauer and Brand1932; Zepeda and Fajardo Reference Zepeda and Fajardo1999), the largest of which stands at least nine meters in height (Garduño Ambriz Reference Garduño Ambriz2007; Garduño and Gamez Eternod Reference Garduño Ambriz and Eternod2005; Perez et al. Reference Perez, Gamez and Ambriz2000). Despite speculation that this site may represent the remains of the ethnohistorically documented capital town of the Aztatlan province (Anguiano Reference Anguiano1992), little is known of its cultural past. Rather, excavations have been mostly limited to salvage projects by the Instituto Nacional de Antropología e Historia (INAH) in response to modern development (Gamez Eternod and Garduño Ambriz Reference Gamez and Ambriz2003; Garduño Ambriz Reference Garduño Ambriz2007; Garduño Ambriz and Gamez Eternod Reference Garduño Ambriz and Eternod2005).
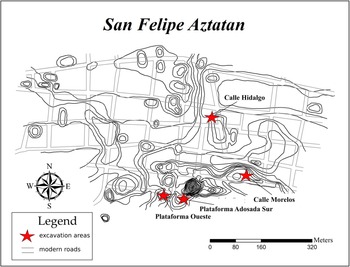
Excavations at San Felipe Aztatan were conducted in November and December of 2002 under the direction of INAH archaeologists Mauricio Garduño Ambriz and Lorena Gamez Eternod. Four distinct areas were excavated: (1) Frente Calle Morelos, (2) Frente Calle Hidalgo, (3) Plataforma Adosado Sur, and (4) Plataforma Oeste (Figure 2). These areas were selected nonrandomly based upon the threat of modern destruction and the likelihood of intact subsurface cultural deposits. The lack of continuous units prevented the use of consistent excavation levels among the areas. Rather, levels for each excavation unit were defined using natural stratigraphic breaks and obvious changes in material culture. In instances where little natural or cultural change could be observed, levels were typically excavated using arbitrary 10–20 cm levels. Beyond relative dating of strata, the use of diagnostic ceramic artifacts allows for general dating of strata for sitewide comparisons to address diachronic patterns.
Site map of San Felipe Aztatan. Map redrawn after Pierce (Reference Pierce2017a).

Coamiles
First documented by the École des Hautes Étudies en Sciences Sociales (EHESS/Paris) during surveys in the 1980s, Coamiles is a large site left relatively undisturbed by modern development (Duverger and Levine Reference Duverger and Levine1993). Architecture here appears to be formally planned into groups of buildings with a well-designed organization. The site is located on the stepped slopes of Cerro de Coamiles and is split into four general areas. Certain areas were likely ceremonially focused while others were relegated to household use. Approximately 60 kilometers northwest from the modern city Tepic, this large site features lush vegetation and abundant faunal resources. It has direct access to two main rivers, the San Pedro Mezquital to the north and the Río Grande Santiago to the south. The proximity to these two rivers provides abundantly fertile farmland due to periodic flooding episodes. Its optimal location has even prompted some to speculate that the community may have controlled the main Aztatlan trade route to the northwest, as well as the flow of population and goods across the plain (Garduño Ambriz Reference Garduño Ambriz2013).
During the EHESS surveys, an assortment of ceramic vessels and sherds were collected for the purpose of developing a seriation-based chronology to be compared to sequences in other areas. These vessels are embellished with elaborate designs as well as the human form in the Mixteca-Puebla style (Garduño Ambriz Reference Garduño Ambriz2013) in some cases. A collection of copper artifacts dating to the Early Postclassic Cerritos phase (a.d. 900–1100) was also collected. Based on the material culture, Coamiles was occupied continuously from at least the Early Classic Gavilan phase (a.d. 250–500) to the Middle Postclassic Ixcuintla phase (a.d. 1100–1350) and beyond. The bulk of the site's construction, however, took place during the Aztatlan horizon in the Cerritos and Ixcuintla phases (a.d. 900–1350; Duverger and Levine Reference Duverger and Levine1993). The obsidian sample analyzed here is a product of the 2005–2009 excavations conducted by INAH Nayarit. These excavations were intended to focus on the ceramic distribution using typological cross dating to determine the timing of various construction events and occupational histories at the site (Garduño Ambriz Reference Garduño Ambriz2013). Other artifacts, however, such as large amounts of obsidian, were similarly collected through these non-random stratified excavations.
Chacalilla
Chacalilla is located approximately 10 kilometers north of San Blas, on the coastal plain of Nayarit covering nearly an entire 2.4 km2 volcanic hilltop. Of the large Aztatlan regional centers, Chacalilla sits at the southern extent, near the Río Zauta where it has nearby access to the southern extension of the Marismas Nacionales. As with other Aztatlan sites, resources were plentiful due to its proximity to periodically inundated and fertile lowland fields and abundant estuary and marine resources. Today, the area supports the modern ejido community of the same name, though it is primarily used for shrimp farming and the commercial growing of fruits (Ohnersorgen Reference Ohnersorgen2007).
Chacalilla was first identified by Mountjoy (Reference Mountjoy1970), though not mapped until 1981 (Guevara López Reference Guevara López1981). These early reports noted many features, including dozens of mounds, a civic ceremonial zone consisting of three open plazas, sunken patio compounds, and an I-shaped ballcourt. Artifacts recovered from the site include large quantities of obsidian, pottery, copper, Mazapan-style figurines, shell, and bone (Ohnersorgen Reference Ohnersorgen2004, Reference Ohnersorgen2007). Although obsidian, including blades, formal tools, and reduction debris, is widespread, Mountjoy's (Reference Mountjoy1970) survey at Chacalilla specifically noted the complete absence of any obsidian cores. Subsequent surveys similarly failed to identify any cores. Though the exact dates are yet unknown, Chacalilla seems to have peaked with the general Aztatlan tradition as strata associated with the Early and Middle Postclassic are the most artifact rich (Michael Ohnersorgen, personal communication 2008).
Between 2004 and 2008, Ohnersorgen undertook a large survey project at Chacalilla in which the entire site was surveyed through pedestrian transects. During this reconnaissance, his team identified 253 distinct features including 63 mounds, 153 rock alignments, 26 artifact concentrations, and 12 petroglyphs (Ohnersorgen Reference Ohnersorgen2007). The abundance of features and tens of thousands of artifacts recovered during these surveys is a testament to the large pre-Columbian population of Chacalilla. He also recognized a clear difference in architecture across the site indicating what presumably amounts to socioeconomic inequality in some form. Today, the modern community of Chacalilla sits directly on the center of the hilltop and likely covers a substantial portion of the site, including much of the ceremonial center. Beyond this area, the site radiates to the east, west, and south.
Amapa
Amapa is perhaps the most well know of the Aztatlan sites due to the work of Clement Meighan and his team from the University of California, Los Angeles (UCLA) in 1959 (Meighan Reference Meighan1976). Located approximately five kilometers from the Río Grande Santiago and 19 kilometers from the Pacific coast, Amapa sits on another resource rich fertile flood plain. The first evidence of permanent habitation in the area dates back as far as 2,000 years ago (Grosscup Reference Grosscup1964). But based on diagnostic ceramics, Amapa was more generally occupied from the Gavilan phase until the Late Postclassic Santiago phase. As elsewhere along the coastal plain, Amapa's peak size and population was reached during the Early Postclassic Cerritos phase (Meighan Reference Meighan1976). This crest was followed by an eventual decline in the century directly preceding Spanish contact.
As well as six main mound groups, the site also features a cemetery containing over 150 burials, mortuary offerings, and numerous caches of artifacts (Bell Reference Bell1961; Bordaz Reference Bordaz1964; Meighan Reference Meighan1976). Upon excavation, over 200 anthropomorphic and zoomorphic figurines of various types including Mazapan-style figurines were recovered (Grosscup Reference Grosscup1961). Other ceramic artifacts include beads, whistles, ear spools, spindle whorls, and pipes (Meighan Reference Meighan1976). Copper artifacts are also found in relative abundance, including 99 copper bells found as mortuary offerings. At Amapa, stone artifacts were found in particular abundance. Various types of ground stone artifacts as well as flaking debris and tools of obsidian, chert, and chalcedony are all common. Unfortunately, during Meighan's excavation, debitage was rarely collected, as was standard practice at the time (Levine Reference Levine, Levine and Carballo2015a). The small amount of obsidian that Meighan did collect (n = 347) was largely in the form of formal bifacially flaked tools, many of which are included in this study (n = 114). In 2013, a small amount of lithic debitage and tools were collected by INAH (n = 459) during the excavation of two wells on the site. Additionally, 17 Amapa polyhedral cores, curated at the Amapa Municipal Museum (n = 11) and the Sentispec Municipal Museum (n = 6), can inform us about general blade production at Amapa (Pierce Reference Pierce2015b, Reference Pierce2015c). These cores have been donated by local residents, so their precise in situ context has been lost. Despite the fact that few blades were ever collected at the site, these cores can still provide essential clues about which sources were preferred for blade making at the site. All three of these obsidian collections (Meighan's collection, the INAH collection, and the Amapa cores) are included in this study. Because of the spurious sampling and collection strategies, however, any conclusions regarding the spatial or temporal distribution of obsidian are limited. Broad generalizations about what sources were utilized at Amapa may yet be appropriate, however.
Peñitas
Just 10 km north of Amapa and less than five kilometers from Coamiles is the site of Peñitas. Peñitas is split into two general areas (Peñitas A and Peñitas B). Located on the northern side of the Río San Pedro, Peñitas A features a number of mounds ranging in height from 30 cm to 3 m (Bordaz Reference Bordaz1964). Notwithstanding these mounds, the area is generally flat and is ideal for farming. Peñitas B is located 2 km to the southeast, on the southern banks of the Río San Pedro and is similarly riddled with mounds.
In Bordaz's (Reference Bordaz1964) dissertation, he detailed a ceramic chronology for the site based upon the excavations of various mound structures. His work illustrates a similar developmental trajectory for Peñitas as has been observed at other Aztatlan sites (Bordaz Reference Bordaz1964). Through a ceramic seriation, Bordaz identified diachronic shifts in ceramic consumption while revealing evidence for the development of political complexity coincident with a demographic and cultural boom that signaled the rise of the Aztatlan tradition throughout the region (Grosscup Reference Grosscup1961).
The obsidian analyzed in the current study was mostly collected from Mound 1 of Peñitas A, with smaller amounts from House Mound 1 of Peñitas B for comparison. At Mound 1 of Peñitas A, 23 isolated burials were identified below the ceremonial structures. However, due to an environment that promotes rapid decomposition, typically these burials are little more than streaks of white matter, random teeth, or an occasional long bone or calvarium (Bordaz Reference Bordaz1964). Often these burials were accompanied by grave goods including engraved and painted “Mitlan” ceramics as well as coarser painted “Chala” wares (Bell Reference Bell1958). Though Peñitas A obsidian may be associated with ritual, communal, or burial contexts, obsidian from Peñitas B is more likely to have originated from a household context.
MATERIALS AND METHODS
The artifacts from San Felipe Aztatan, Coamiles, and the majority of the Amapa collection are permanently curated at the INAH museum in Tepic, Nayarit. The remaining Amapa artifacts and the Peñitas assemblages are held as part of the Fowler collection at UCLA. The Chacalilla assemblage, on the other hand, has been reinterred at the site due to a lack of an available curation facility and is unavailable for further analysis. Finally, two small collections of polyhedral cores originally found at Amapa and used in this study are curated in the Amapa and Sentispac Municipal Museums. All analyses were completed over the course of six years between 2011 and 2016, with some analyses performed in Nayarit Mexico, and others at the University of Missouri Research Reactor (MURR).
Macroscopic Analysis
In all cases, the obsidian was originally grouped with its respective excavation level and separated into different bags. After assigning each artifact a unique analytical identification number, key morphological attributes were then recorded: (1) provenience, (2) artifact form, and (3) artifact weight, length, width, cortex coverage, and type. This data organization allowed for a statistical approach aimed at detecting differences among excavation levels and units and observing general trends as an aggregate analysis, as opposed to attempting to focus on the technological or functional significance of individual artifacts.
General artifact morphology was recorded using a simple three-type categorization system. More detailed and comprehensive systems such as those used by Clark (Reference Clark1985), Clark and Bryant (Reference Clark and Bryant1997), and Santley et al. (Reference Santley, Kerley, Kneebone and Isaac1986), were deemed unnecessary for the goals of this study and would instead only complicate the statistical analyses given that such schemes would produce many categories with few (or no) members. Furthermore, the finer detailed separation could increase the likelihood of inter-observer error (Andrefsky Reference Andrefsky2005; Railey and Gonzales Reference Railey, Gonzalez and Shott2014), making replicability difficult. Instead, an analytically straightforward system of only three categories was used: (1) finished prismatic blades; (2) flakes, including byproducts related to blade, core, and tool production, angular shatter and other miscellaneous utilized or unutilized debitage; and (3) tools, including unifacially and bifacially flaked items such as projectile points, and scrapers, as well as worked and/or notched blades. When appropriate, further distinctions in debitage types or formal tool categories were made, such as at Amapa where a larger quantity of formal tools were analyzed. Other variables were also measured for the sake of completeness as recommended by Odell (Reference Odell2004) and Andrefsky (Reference Andrefsky2005) and to provide data for future analyses, including length, width, weight, and amount of cortex.
Energy Dispersive X-Ray Fluorescence (EDXRF) Spectrometry
Fortunately, in addition to the relative success in visual sourcing (Aoyama Reference Aoyama, Nakamura, Aoyama and Uratsuji1991; Braswell et al. Reference Braswell, Clark, Aoyama, McKillop and Glascock2000; McKillop Reference McKillop, Guderjan and Garber1995; Pierce Reference Pierce2015a, Reference Pierce2017a, Reference Pierce2017b; Rebnegger Reference Rebnegger2010; Sánchez Polo Reference Sánchez Polo1991), obsidian can be easily sourced using geochemistry for more precise results when equipment is available (Braswell et al. Reference Braswell, Wyllys Andrews V. and Glascock1994; Moholy-Nagy and Nelson Reference Moholy-Nagy and Nelson1990). Using methods such as neutron activation analysis (NAA), X-ray fluorescence (XRF), and inductively coupled plasma mass spectrometry (ICP-MS), an analyst can compare an artifact to known source samples to find compositional similarities to indicate origin. The provenance of obsidian in particular can be easily determined using these archaeometric methods, as it is inclusion free (Shackley Reference Shackley2005) and sources are limited in nature (Price and Burton Reference Price and Burton2012). Each volcanic source has a unique chemistry which can be reliably matched to an artifact in most cases. For this reason, obsidian is an ideal material to analyze in adherence with the provenance postulate (Weigand et al. Reference Weigand, Harbottle, Sayre, Earle and Ericson1977).
Due to the reinterment of the artifacts in the years following the surveys, the analysis of the Chacalilla collection uses data provided in summaries by Ohnersorgen et al. (Reference Ohnersorgen, Glascock, Mountjoy and Ambriz2012). In their analysis, they relied heavily upon visual sourcing to determine the provenance of obsidian artifacts. Their study, however, verified the efficacy of visual sorting through XRF and NAA (approximately 92 percent accurate). This same method was tested in previous works by Pierce (Reference Pierce2015a, Reference Pierce2017b; 93 percent accurate) and was again found to be effective and sufficient to source obsidian when geochemical methods are unavailable, even in an area with a great source diversity such as West Mexico. Nonetheless, the provenance determinations at the other sites in this study were generated entirely through pXRF to ensure the highest level of accuracy. For this analysis, a portable Bruker Tracer III-SD X-ray fluorescence spectrometer was used. This particular instrument contained a rhodium-based X-ray tube operated at 40 kV and a thermoelectrically cooled silicon-drift detector. Calibration utilized a set of 37 well-characterized obsidian sources with data from previous ICP, XRF, and NAA measurements. Each sample was counted for 30 seconds to measure certain minor and trace elements present. The elements measured include but are not limited to rubidium (Rb), strontium (Sr), ytterbium (Y), zircon (Zr), iron (Fe), and niobium (Nb). After data collection, elemental concentration data were tabulated in parts per million for statistical analysis resulting in compositional group assignments that could be compared to source reference samples to reflect provenance. Curated at the MURR facility, source samples from 26 known obsidian sources in Western Mexico (Glascock et al. Reference Glascock, Weigand, Esparza-López, Ohnersorgen, Ambriz, Mountjoy, Andrew Darling, Kuzmin and Glascock2010) and the well-known Sierra de Pachuca source in Hidalgo were considered. New data were collected from these samples at the time of analysis to mitigate the potential for inter-instrument errors. For most sources, data from six sample specimens were collected to establish compositional reference groups. In total, ppm geochemical data from 181 source samples were collected and compared to artifact data to determine source. Comparison to source groups and subsequent source assignments were then completed through principal component analyses, visual inspection of bivariate plots, Mahalanobis distance calculations, and discriminant analyses using MURR's in-house GAUSS software. All geochemical data produced in this study are publically available on MURR's website (https://archaeometry.missouri.edu/datasets/datasets.html).
RESULTS
Given the nature of the assemblage (i.e., more blades from specific sources), raw counts of artifacts per source may misrepresent true usage to a degree. Household production and percussive flaking will produce more flakes than preformed polyhedral cores. While one core may produce many prismatic blades, a cobble may produce far fewer useful flakes through percussive techniques (Stark et al. Reference Stark, Boxt, Gasco, González Lauck, Hedgepeth Balkin, Joyce, King, Knight, Robert Kruge, Levine, Lesure, Mendelsohn, Navarro-Castillo, Neff, Ohnersorgen, Pool, Mark Raab, Rosenswig, Venter, Voorhies, Williams and Workinger2016).
San Felipe Aztatan
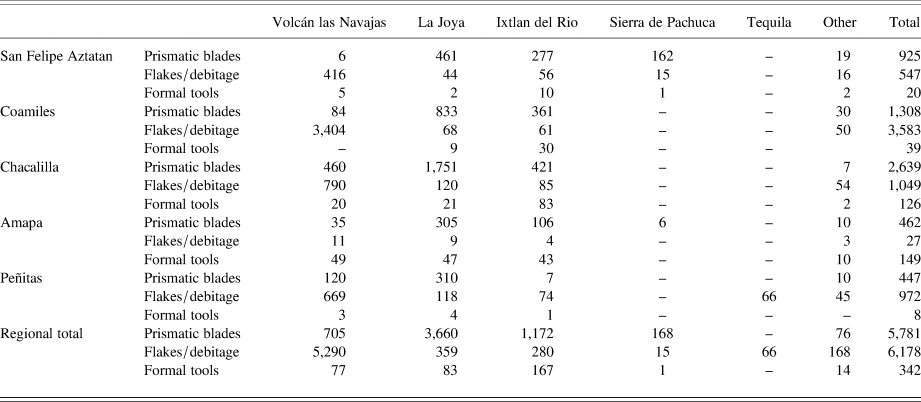
For detailed discussion of obsidian analysis at San Felipe Aztatan, see Pierce (Reference Pierce2015a). Here, a brief summary is offered. In total, 1,492 artifacts were analyzed. Of them, four sources make up the vast majority: Volcán las Navajas, which is the closest source (n = 427, 29 percent of the assemblage); La Joya (n = 507, 34 percent); Ixtlan del Río (n = 343, 23 percent); and Sierra de Pachuca (n = 178, 12 percent). Of the polyhedral cores analyzed, 15 of 18 (83 percent) were sourced to La Joya. Overall, there is a clear pattern in how sources were used (Table 2). The general preponderance of the debitage from Volcán las Navajas suggests local reduction and the production of non-blade flaked stone artifacts. The minimal debitage from the other sources suggests that this material could have arrived at the site as already produced prismatic blades. On the other hand, while some debitage is noted from blade rich sources such as La Joya, the vast majority of these blades are third series blades. These blades are produced later in the reduction process. As a result, they are void of dorsal scars and are generally thinner, longer, and more regular than first and second series flakes (Clark Reference Clark1997; Clark and Bryant Reference Clark and Bryant1997). The debitage from La Joya that has been identified is largely in the form of core maintenance debris. With few early stage flakes, this makes on-site blade production from pre-made cores more likely when blades were not imported outright (Hirth Reference Hirth, Hirth and Andrews2002).
Frequency of artifact types by source. Statistically significant values in bold.

A temporal pattern is observable as the frequency of blades increased over time, along with a greater diversity of sources. In contrast, in deeper strata, Volcán las Navajas obsidian and general reduction appears to be the standard for obsidian use until the trade networks developed nearing the Postclassic. Spatially, an interesting pattern has also emerged as nearly all of the Sierra de Pachuca obsidian is found in a single excavation area (Calle Hidalgo), perhaps indicating socioeconomic differences through resource access (Pierce Reference Pierce2017a, Reference Pierce2017b).
Coamiles
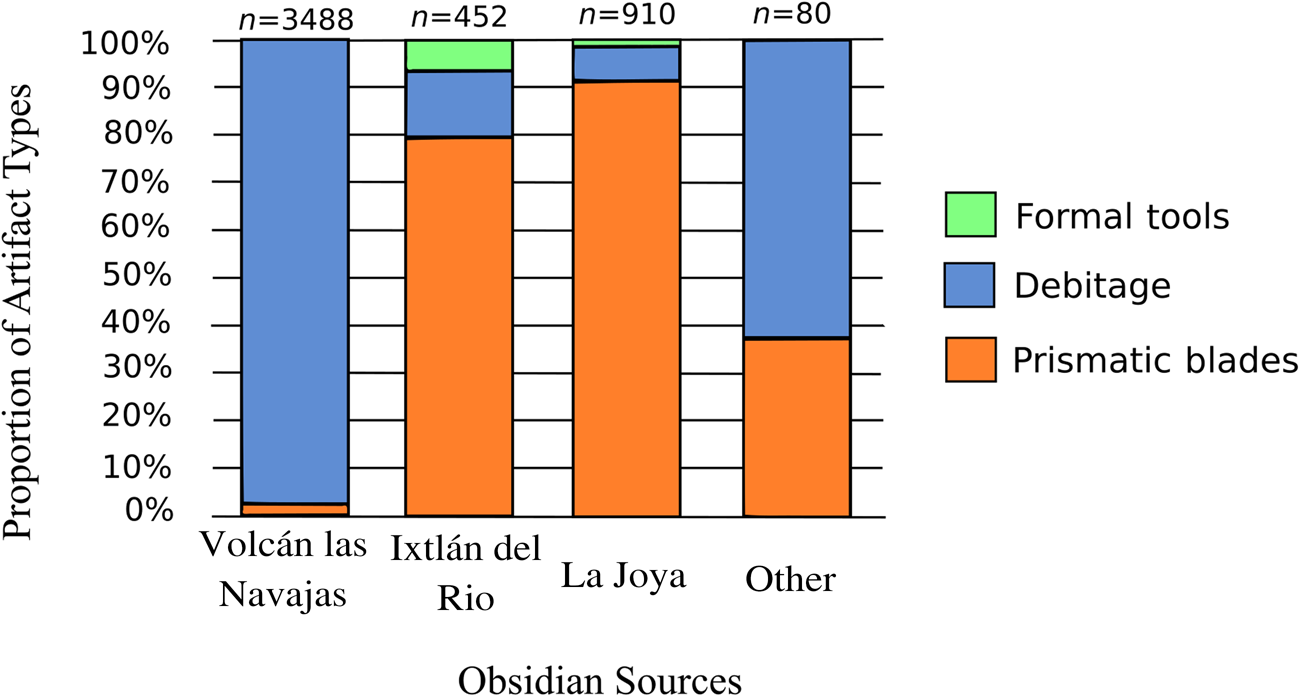
At Coamiles, the large sample (n = 4,930) is comprised of primarily three sources: Volcán las Navajas (n = 3,488, 70.8 percent), La Joya (n = 910, 18.5 percent), and Ixtlan del Río (n = 452, 9.2 percent). Despite the great disparity between sources used, however, the same statistically significant pattern exists regarding how each source was used (χ2 = 3975.93, df = 6, α = .05). Here, as at San Felipe Aztatan, general reduction debitage is mostly represented with Volcán las Navajas obsidian. Blades, on the other hand, typically come from La Joya. Obsidian from Ixtlan del Río includes blades, formal tools, and debitage (Figure 3). Notably, no Sierra de Pachuca obsidian has been recovered here.
Distribution of artifact type by source at Coamiles. Image by the author.

A similar temporal pattern is also observable. Volcán las Navajas, and thus generalized debitage, is most common in deeper strata. The frequency of blades, as well as the diversity of sources increased over time. There appears to be a notable synchronic variation as Platform 5 and Platform 4 differ in statistically significant ways (χ2 = 113.97, df = 3, α = .05). At Platform 5, arguably the heart of the ceremonial center, there is a higher proportion of blades and La Joya obsidian. Platform 4 (a seemingly less focal point yet still considered the ceremonial center; Duverger and Levine Reference Duverger and Levine1993; Garduño Ambriz Reference Garduño Ambriz2013), contains fewer blades and La Joya obsidian. But given the greater density of key civic ceremonial features in proximity to Platform 5, the spatial patterns of obsidian use is perhaps indicative of differences in activities at the two platforms. It is also worth noting, however, that excavations were limited to this central area of the site, so it is unclear what sources may have been recovered from household contexts.
Chacalilla
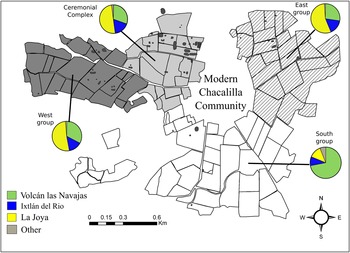
Of the sites in this study, only Chacalilla relied upon visual sourcing, though the efficacy of the method at Chacalilla was demonstrated in subsequent analyses (Ohnersorgen Reference Ohnersorgen2007; Ohnersorgen et al. Reference Ohnersorgen, Glascock, Mountjoy and Ambriz2012). Here, the same three sources (Volcán las Navajas, La Joya, and Ixtlan del Río) are most common and they have again been used in the same ways. As an exception, there is a notable amount of blades from Volcán las Navajas. Unfortunately, no assessment of temporal patterns is possible due to the assemblage being a product of pedestrian survey. Obsidian is spatially patterned at Chacalilla, however, with Volcán las Navajas obsidian dominating the southern portion of the site and La Joya obsidian being the most common source elsewhere (Figure 4). This pattern could again illustrate differences in value (assuming distance as a proxy for relative cost; Plourde Reference Plourde2008; Renfrew Reference Renfrew, Earle and Ericson1977; Sidrys Reference Sidrys, Earle and Ericson1977) and represent differential access to more distant obsidians and blades.
Spatial distribution of obsidian sources at Chacalilla. Image by the author.

Amapa
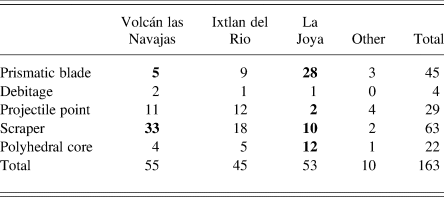
Compared to the previously mentioned sites, the assemblage from Amapa should be viewed in a slightly different light. Due to sampling strategies from original excavators, it is not possible to get a full understanding of what sources were used and for what purposes. As mentioned above, debitage and/or blades were rarely collected at the site during original excavations. But in a limited assemblage more recently collected by INAH (n = 459), both debitage and blades were collected. The same three sources are most common in this collection. Of the artifacts analyzed from Amapa, most blades and over half (55 percent) of the polyhedral cores, including 14 of the 17 cores currently curated at the Sentispec and Amapa museums (Pierce Reference Pierce2015b, Reference Pierce2015c) are from La Joya. This is despite the fact that La Joya obsidian makes up approximately one third of the total assemblage. In regards to the formal tools from Meighan's collection, scrapers are most commonly made from Volcán las Navajas obsidian (Table 3). Due to the nonrandom sampling, diachronic and synchronic patterns could not be assessed.
Frequency of artifact type by source (Meighan's Amapa Collection; χ2 = 49.2; df = 12; α = .05). Bold values are statistically significant.

Peñitas
At Peñitas (n = 1,427), Volcán las Navajas and La Joya make up approximately 85 percent of all obsidian analyzed (n = 792 and 432, respectively). Ixtlan del Río, though common at other coastal plain sites, comprises only six percent (n = 82) while the Tequila source makes up an additional five percent (n = 66). Like La Joya, the Tequila source is located in the Jalisco highlands, but it is found strictly as debitage at Peñitas. Blades at Peñitas are again typically found to be from La Joya. As compared to the overall regional pattern, Volcán las Navajas blades are comparatively more common here, at 15 percent of the obsidian from this source.
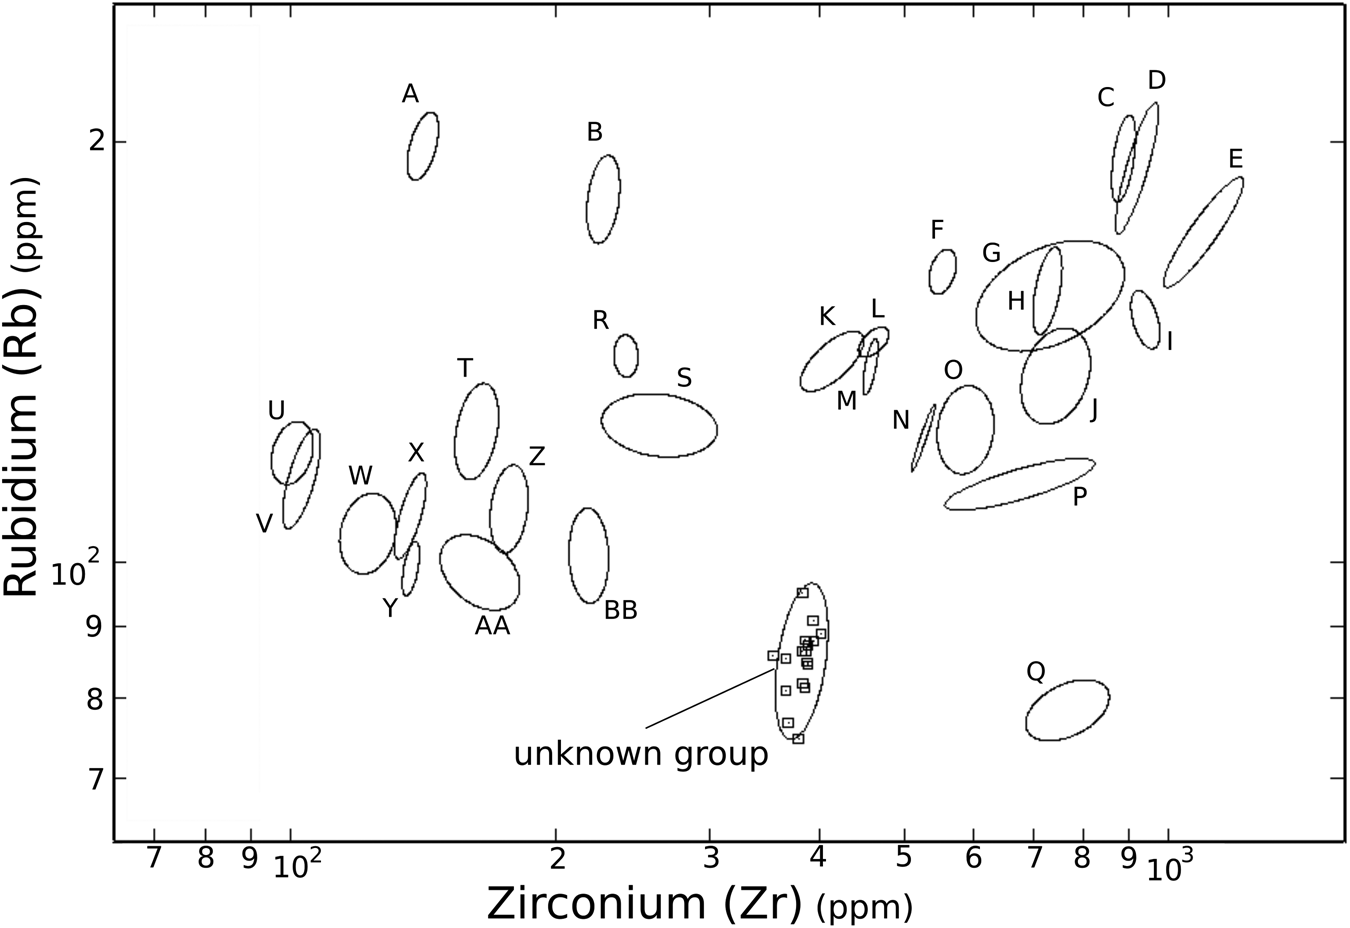
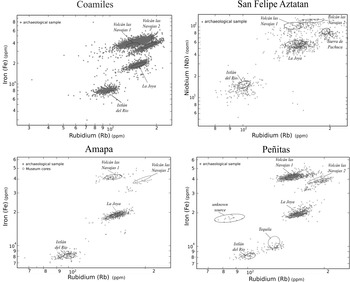
For all of the collections of this study, every available West Mexican obsidian source was considered as reference data, though other sources are known to exist that have yet to be compositionally analyzed. At Peñitas, 17 artifacts appear to be from either a previously unknown source or have been imported from beyond the region where reference samples were not included (Figure 5). These artifacts do appear to be obsidian, rather than a glassy basalt, due to Fe content. Iron content is over 45,000 ppm on average for obsidian from Volcán las Navajas. These unidentified obsidian flakes from Peñitas, however, feature an average Fe concentration of only 18,000. While this quantity is still higher than most West Mexican obsidian sources, it remains substantially lower than others, including Volcán las Navajas and La Joya. With these iron concentrations as well as its glassy appearance, it is more likely to be a true obsidian rather than a glassy basalt. In the future, other mineralogical analyses may confirm this suspicion. Compared to other West Mexican sources, this unidentified source is also generally lower in Th and Rb. Of these unknown specimens, none are in the form of blades or formal tools.
Geochemical distinction of unknown group at Peñitas compared to all known West Mexican sources (illustrated on Zr and Rb axes). (A) Cerro de Navajas, (B) Nochistlan, (C) Sierra de Pachuca 1, (D) Cinco Minas, (E) Volcán las Navajas 2, (F) La Mora/Teuchitlan, (G) Sierra de Pachuca 3, (H) La Joya, (I) Volcán las Navajas 1, (J) Huaxtla, (K) San Leonel, (L) San Isidro, (M) Hacienda de Guadalupe, (N) Llano Grande, (O) Huitzila, (P) Sierra de Pachuca 2, (Q) San Juanito de Escobedo, (R) Santa Teresa, (S) Tequila, (T) La Quemada, (U) Ahuisculco, (V) Navajas, (W) Boquillas, (X) San Juan de los Arcos, (Y) Ixtlan del Rio, (Z) La Providencia, (AA) Cerro de Navajas, and (BB) La Pila. Image by the author.

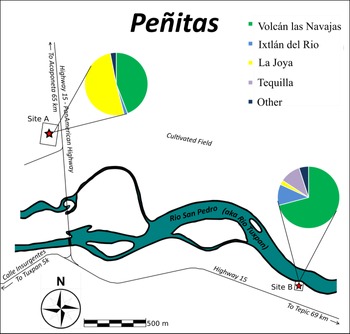
Despite being located just two km apart, the two subsites of Peñitas have notably different distributions of obsidian artifacts. The same three sources were utilized at both sites, but there is an extremely unequal distribution (χ2 = 461.57, df = 5, α = .05) between them. Here, there is a much greater diversity of obsidian sources at Peñitas B. At this smaller and seemingly less significant subsite, all 66 of the Tequila obsidian artifacts, a majority of Ixtlan del Río material, and all of the unknown group obsidian flakes were found. This pattern is in stark contrast to the distribution we see at Peñitas A, which is dominated by La Joya obsidian (51 percent compared to two percent from Peñitas B). Peñitas A and B also differ in the number of blades recovered. In sum, over half of the Peñitas A artifacts are blades. In contrast, only four percent of the Peñitas B artifacts are found in this form. Given that blades are better suited for particular tasks and they are limited almost exclusively to a single locale here, it is possible that this distribution represents functional differences between the two locations (Figure 6). This hypothesis is further suggested by the fact that Peñitas B may be from household contexts while Peñitas A may come from contexts that are more civic/ceremonial (Bordaz Reference Bordaz1964). Regardless, the diversity of sources used for the production of prismatic blades and other lithics is significant and indicative of wide access to an array of sources sitewide.
Spatial distribution of obsidian sources at Peñitas subsites. Image by the author.

Aside from the deepest strata where Volcán las Navajas obsidian is almost exclusively found, the ratio of La Joya to Volcán las Navajas artifacts (approximately 1:1) remained relatively consistent through time. Obsidian use in general, however, increased over time at Peñitas A. By contrast, at Peñitas B obsidian use as a whole generally decreased. In the deeper strata where obsidian is more abundant, there is also greater diversity, containing almost all of the unknown group and Tequila artifacts. While this change may indicate a greater control of obsidian over time (Hirth Reference Hirth1998, Reference Hirth2000), it may alternatively be a reflection of a shift in activities from Peñitas B to Peñitas A over time.
DISCUSSION
Despite the ubiquity of stone tools and debitage at archaeological sites worldwide, the cultural information conveyed by lithic remains (notwithstanding cultural identity, function, and elements of the chaîne opératoire) is too often neglected (cf. Levine and Carballo Reference Levine and Carballo2015). In this sense, archaeologists have historically considered material remains primarily in terms of the tasks for which they may have been used (Binford Reference Binford, Binford and Binford1968, Reference Binford1972, Reference Binford and Renfrew1973; Braun Reference Braun, Moore and Keene1983) or considering them to be culturally and/or temporally diagnostic (Bordes Reference Bordes1953, Reference Bordes1969, Reference Bordes1978). Stone tool typologies (e.g., projectile points, scrapers, and drills) focusing on functional traits have been especially viewed as an ends unto themselves; so much so that often debitage was not recorded nor collected in the past (Coe Reference Coe1959; Levine Reference Levine, Levine and Carballo2015a). But, there is much more that can be learned about a culture based upon their stone tools beyond their purpose.
This study identifies the various patterns of obsidian consumption within five Aztatlan era sites across the coastal plain. In many ways, the patterns are similar from one site to another. But in other aspects, there are notable differences. Much of the variation in patterns of obsidian consumption were likely tied to the level of integration of that particular site into the broader regional trade network. Furthermore this level of integration may be a product of differences in socioeconomic capacity, both within sites and between them. Golitko and Feinman (Reference Golitko and Feinman2015) note that despite its widespread use, obsidian does not appear to have been under control by a single capital during the Postclassic, but any restriction to access to certain sources and lithic types instead may have been due to the increased costs associated with transport from distant sources (Renfrew Reference Renfrew, Earle and Ericson1977; Sidrys Reference Sidrys, Earle and Ericson1977). As shown across Mesoamerica through social network analyses (Golitko and Feinman Reference Golitko and Feinman2015), there is no evidence of centralized control within the Aztatlan tradition on the coastal plain, though unequal distribution of exotic goods may reflect other factors such as how imbedded an individual or the site as a whole was into broader trade networks. Long-distance exchange, according to World Systems theorists, was often used to create and reinforce existing sociopolitical relationships and social structures at various scales (Blanton and Fargher Reference Blanton, Fargher, Babones and Chase-Dunn2012; Blanton et al. Reference Blanton, Fargher, Heredia Espinoza and Blanton2005; Kepecs et al. Reference Kepecs, Feinman and Boucher1994). Thus, at its basest level, the above results demonstrate that obsidian sources were in fact differentially and meaningfully used on the coastal plain and may be reflective of burgeoning trade relationships, shifting associations over time, and even socioeconomic differentiation (Pierce Reference Pierce2017b).
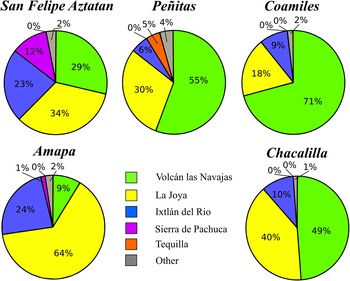
On the coastal plain of West Mexico, it is clear that obsidian was an important commodity beyond its functional attributes. Though other quality sources are available (Glascock et al. Reference Glascock, Weigand, Esparza-López, Ohnersorgen, Ambriz, Mountjoy, Andrew Darling, Kuzmin and Glascock2010), three sources in particular (Volcán las Navajas, La Joya, and Ixtlan del Río) made up the majority of all of the obsidian found in the region (Figures 7 and 8). Distinct trends exist in how these sources were used at the coastal sites. Overall, Volcán las Navajas obsidian was primarily used for generalized reduction (through less-skilled percussive techniques) and rarely used for prismatic blades or formal tools. Based on the distribution of debitage and higher percentage of cortical flakes, it is likely that Volcán las Navajas obsidian was reduced at the coastal sites and was primarily used for domestic tasks as expedient tools. Further, it is unlikely to have been an imported item due to the paucity of third series blades at all the sites and the source's proximity to the coastal plain.
Overall distribution of obsidian sources per site. Image by the author.

Geochemical distribution of coastal plain samples. Chacalilla not included due to visual sourcing method used. Image by the author.

Conversely, the La Joya source was preferred for prismatic blade production, as is evidenced by the high proportion of blades. Given the number of exhausted polyhedral cores found, it is also likely that La Joya prismatic blades were at times reduced on site and/or en route by itinerant craftspeople (Hirth Reference Hirth, Hirth and Andrews2002, Reference Hirth2008). In the Gulf lowlands, for example, polyhedral core preparation debitage is typically found near the highland quarries, indicating that cores entered the site pre-made and ready for blade removal (Stark et al. Reference Stark, Boxt, Gasco, González Lauck, Hedgepeth Balkin, Joyce, King, Knight, Robert Kruge, Levine, Lesure, Mendelsohn, Navarro-Castillo, Neff, Ohnersorgen, Pool, Mark Raab, Rosenswig, Venter, Voorhies, Williams and Workinger2016). In West Mexico, the lower proportion of debitage and early stage and cortical flakes from La Joya similarly suggest that cores typically entered sites in prepared form. Indisputable evidence of onsite production is limited at the coastal plain sites. It remains possible, however, that specialized lithic workshops within these sites have simply yet to be excavated given the differing sampling and collection strategies.
Ixtlan del Río obsidian was often used for prismatic blades, though cores are not found. More formal tools and general debitage have been identified from this source than have been found from La Joya, though far less debitage than from Volcán las Navajas. With the general proximity of Ixtlan del Río to the coastal sites, it is nonetheless unsurprising that some cortical flakes have also been found, likely reflecting direct procurement to some degree. It is notable that there is a significant amount of Sierra de Pachuca obsidian found at San Felipe Aztatan. There, it is found almost exclusively in the form of prismatic blades, demonstrating the long-distance importation of finished blades from the Basin of Mexico to supplement the local obsidians.
Where information is available, there seems to be a trend of consistent use of Volcán las Navajas obsidian throughout the entire occupational history of the coastal sites. Yet over time, source diversity generally increased as populations grew during the Postclassic. The region as a whole reflects an overall increase in blades over time with a concurrent decrease in proportionate use of the local Volcán las Navajas source for generalized reduction. This usage likely indicates an increase in reliance upon trade as well as increased access to more distant sources in the form of finished blades and/or prepared cores. Small deviations from this pattern are apparent, however. At San Felipe Aztatan, for example, Sierra de Pachuca obsidian has been found in only a few contiguous non-mixed stratigraphic levels. These strata have been identified to primarily reflect the Amapa phase prior to the Postclassic peak of the Aztatlan tradition (Pierce Reference Pierce2015a).
This study provides insight at the site level as well. At Peñitas A, presumably the subsite of greater prominence due to the noted features and artifacts, there is a general increase in obsidian over time, particularly with prismatic blades. At the same time, at Peñitas B there is a general decrease over time and a lessening of source diversity. Thus, Peñitas B may have been more densely occupied during the area's development prior to integration into the broader regional network. As the site grew, focus may have shifted from Peñitas B to Peñitas A and communal activities, resulting in an increase of imported blades and/or cores from established trade outlets. This shift would have occurred alongside a decrease in overall obsidian use (and potentially population in general) at Peñitas B as the site became more centralized at its counterpart.
Peñitas is not the only place that spatial patterning of source distribution may reveal key cultural information. In this regard, there are general patterns of unequal source distribution at all sites in which data are available. These patterns likely show a differential access to blades and more distant sources that could be indicative of socioeconomic structures at the sites. More broadly, the diversity of obsidian at one site compared to another may reflect varying levels of integration into the regional Aztatlan trade system as goods may have flowed from the Jalisco altiplano (Pierce Reference Pierce2017a). On the other hand, differences in obsidian distribution may reflect functional differences between areas within sites. This situation appears most likely at Coamiles, but also could be true at Peñitas and Chacalilla. Nonetheless, the identification of these temporal and spatial patterns provide insight into the pervasiveness of the obsidian trade in Postclassic West Mexico.
Overall, the patterns demonstrated by the above analyses provide a window into regional obsidian use during the Postclassic period (Table 4). The Aztatlan tradition, known for trade, likely incorporated this valuable yet ubiquitous material into the far-reaching mercantile network despite its local availability. This practice is similar to many of the patterns observed elsewhere across Mesoamerica (Golitko and Feinman Reference Golitko and Feinman2015; Stark et al. Reference Stark, Boxt, Gasco, González Lauck, Hedgepeth Balkin, Joyce, King, Knight, Robert Kruge, Levine, Lesure, Mendelsohn, Navarro-Castillo, Neff, Ohnersorgen, Pool, Mark Raab, Rosenswig, Venter, Voorhies, Williams and Workinger2016) and is further demonstrated by the noted shifts in usage over time as trade became a larger part of West Mexico culture. As the Aztatlan tradition developed and strengthened mercantile relationships, a region-wide increase in diversity of obsidian sources and a decrease in proportional use of the local source and household production through generalized reduction are evident. At this time, the increasingly common blades were most likely produced by specialists on site from preformed cores or completely reduced elsewhere. These specialists would have had access to sufficient amounts of obsidian from distant sources to supply blades to the entire region without relying on the local source. The importation of obsidian would have become more cost efficient due to economies of scale as populations grew resulting in greater affordability. This growth would have allowed for a wider distribution of exotic sources. All the while, the most proximal source (Volcán las Navajas) remained widely available and unrestricted by any particular group as individuals accessed this source indiscriminately to create less-skilled tools through generalized reduction at the household level.
Summary of results for all sites. Chacalilla values are approximate based upon visual sourcing. Amapa proportionate values are skewed due to sampling bias.

CONCLUSION
Many Mesoamerican studies have demonstrated the substantial social, political, and economic roles obsidian played in ancient society (Clark Reference Clark and Hirth2003b; Smith Reference Smith, Smith and Berdan2003). In many areas, obsidian was simultaneously functional in its everyday utility while simultaneously valuable and symbolically potent for ritual and offerings (Aoyama Reference Aoyama, Levine and Carballo2015; Darras Reference Darras and Darras1998; Miller and Taube Reference Miller and Taube1993; Stark et al. Reference Stark, Boxt, Gasco, González Lauck, Hedgepeth Balkin, Joyce, King, Knight, Robert Kruge, Levine, Lesure, Mendelsohn, Navarro-Castillo, Neff, Ohnersorgen, Pool, Mark Raab, Rosenswig, Venter, Voorhies, Williams and Workinger2016). Without a doubt, this material is inextricably linked to Mesoamerican culture history and the study of it is critical to understanding the ancient Mesoamerican world. Across the region, there were substantial increases in blade usage and access to quality obsidians as more robust economies developed in the Postclassic (Darras Reference Darras2008; Healan Reference Healan2009; Stark et al. Reference Stark, Boxt, Gasco, González Lauck, Hedgepeth Balkin, Joyce, King, Knight, Robert Kruge, Levine, Lesure, Mendelsohn, Navarro-Castillo, Neff, Ohnersorgen, Pool, Mark Raab, Rosenswig, Venter, Voorhies, Williams and Workinger2016). Though imported obsidian was initially restricted to elite contexts during earlier periods (Clark Reference Clark, Johnson and Morrow1987), access to blades and distant sources spread to general households, as sites became more economically powerful. Based on the analyses presented above, this access also appears to be the case in Western Mexico. There, the increase of distant obsidians and of prismatic blades is coeval with the rise to regional prominence of the Aztatlan tradition.
Over time, nonlocal obsidians became more abundant on the coastal plain. Clark et al. (Reference Clark, Lee, Salcedo and Voorhies1989) noted that traders in the Soconusco Region did not have to rely solely upon the demand for obsidian alone to embark on trading expeditions. Rather, obsidian, along with other goods, would be traded together. Likewise, multipurpose trips by itinerant traders bringing various items to the coastal plain from highland locales such as the Etzatlan Basin of Jalisco likely made blades and other goods more readily available on the coast. Given the abundance of local obsidians, the circulation of preformed cores and blades may be a result of these multipurpose trips (Clark et al. Reference Clark, Lee, Salcedo and Voorhies1989), perhaps in reciprocity for coastal items coveted in other places. Elsewhere, in the Mixteca region, similar symbiotic highland-lowland trade relationships are evident. There, coastal resources such as cotton, cacao, and macaws were frequently traded for highland resources such as obsidian and maguey (King Reference King and Blomster2008; Mathiowetz Reference Mathiowetz2018b; Workinger Reference Workinger2002).
The importation of nonlocal goods such as obsidian may have served to proliferate the broader Aztatlan mercantile system, as traders maintained interpersonal relationships across the region by exchanging items that were already accessible in each of the trading centers in another form (Drennan et. al Reference Drennan, Fitzgibbons and Dehn1990; Levine Reference Levine2015b; Schortman Reference Schortman1989). In this sense, the obsidian trade may have even been simply “along for the ride” with the complex trade system, and use patterns may be symbolic of foreign relations and access rather than an issue of differential quality of obsidian (Aoyama Reference Aoyama, Levine and Carballo2015; Pierce Reference Pierce2017b). If this were the case, the focus may have been on other items and the obsidian trade may have been secondary to the broader system as is suspected at Teotihuacan (Drennan et al. Reference Drennan, Fitzgibbons and Dehn1990).
Along the coastal plain, variation in the obsidian sources used suggests a lack of centralized control for the importation of obsidian (Hirth et al. Reference Hirth, Cyphers, Cobean, de León and Glascock2013). Traders may have been non-specialized entrepreneurs providing low and high status goods alike (Hirth Reference Hirth2008). Similarly, itinerant craftspeople may have travelled from place to place producing blades on demand before moving to the next site (Hirth Reference Hirth2016). A diversity of items exchanged may have then resulted in the increased status of the merchant class with foreign obsidian serving as an indicator of the owner's superior access to resources and networks (Pierce Reference Pierce2017b). Regardless, the fact that regional patterns of usage generally echo from one site to the next indicates that concepts of how obsidian could and should be used was likely imbedded in the “common cultural grammar” (Spence Reference Spence, Foster and Gorenstein2000) of the Aztatlan tradition.
Distance to sources and subsequent transport costs likely account for the majority of the differential source usage over time and across space (Renfrew Reference Renfrew, Earle and Ericson1977; Sidrys Reference Sidrys, Earle and Ericson1977; Stark et al. Reference Stark, Boxt, Gasco, González Lauck, Hedgepeth Balkin, Joyce, King, Knight, Robert Kruge, Levine, Lesure, Mendelsohn, Navarro-Castillo, Neff, Ohnersorgen, Pool, Mark Raab, Rosenswig, Venter, Voorhies, Williams and Workinger2016; Tolstoy Reference Tolstoy, Fish, Boksenbaum, Vaughn and Earle Smith1977). In this regard, changes in population density would have led to the increased access to a more diverse set of sources due to economies of scale. As sites grew in population, the per-item transport costs decreased with larger quantities of goods being imported (Millett Reference Millet, Mattingly and Salmon2001). Thus, in Postclassic West Mexico, obsidian access likely improved as numerous sources were utilized due to both a broader market economy and the introduction of the more cost efficient technology of prismatic blade production towards the end of the Classic period. In regards to the latter, Stark (Reference Stark, Clark and Pye2000, Reference Stark, Scarborough and Clark2007) has argued for the spread of technology concurrent with increased trade and wider circulation of more prestigious goods. In Western Mexico, the increased trade of distant obsidians during the Classic period may have resulted in a subsequent increase in local production of blades during the Postclassic due to technological transfers through horizontal cultural transmission as well as the newfound availability of preformed cores from distant sources.
Though more desirable, blades alone still could not satisfy the demand for functional obsidian tools. While obsidian was increasingly imported in the form of prepared cores and blades, more proximal obsidian sources such as Volcán las Navajas were used for less technically complex items such as expedient tools. This usage suggests that where blades and more distant obsidian remained too cost prohibitive and/or individuals did not have the requisite skill to make blades themselves, many continued to exploit more local sources for household produced percussion flakes. This cost-related discrepancy between blades and percussion flakes is evident elsewhere. In the Copan Valley, for example, when obsidian blades became less accessible after the disruption of trade networks with the Spanish entrada, households relied primarily on flaked cobbles rather than pressure blades despite the fact that previously blades were far more common (Aoyama Reference Aoyama2001).
Overall, the patterns of obsidian consumption within the Postclassic Aztatlan tradition mirror those noted elsewhere (Stark et al. Reference Stark, Boxt, Gasco, González Lauck, Hedgepeth Balkin, Joyce, King, Knight, Robert Kruge, Levine, Lesure, Mendelsohn, Navarro-Castillo, Neff, Ohnersorgen, Pool, Mark Raab, Rosenswig, Venter, Voorhies, Williams and Workinger2016). Throughout Mesoamerica, obsidian was a critical resource due to its functional utility as well as its symbolic and cultural significance. West Mexico was no different. These patterns include an increase of distant obsidians and blades over time associated with a greater dependency on itinerant traders/craftspeople and subsequent lower transport costs (Clark et al. Reference Clark, Lee, Salcedo and Voorhies1989). Through a regional assessment of obsidian use, this study provides further evidence that the Postclassic Aztatlan tradition was embedded into broader Mesoamerican patterns of exchange and material culture. In doing so, this study also provides the first exhaustive look at obsidian usage within the Aztatlan tradition.
RESUMEN
En Mesoamérica, la obsidiana era un material ideal para la producción de diversas herramientas debido a sus propiedades físicas y sus ventajas funcionales, en comparación con otros tipos de roca. Es fácil de astillar y crea bordes extremadamente afilados cuando se rompe, lo que le confiere a este vidrio volcánico propiedades excepcionales para la manufactura de una gran diversidad de objetos de carácter utilitario. Como era de esperar, la obsidiana se encuentra en casi todos los sitios mesoamericanos. Debido a esta abundancia y aparente valor simbólico y utilitario, la obsidiana puede ser una herramienta valiosa para estudiar las culturas mesoamericanas.
A pesar de la presencia de numerosos yacimientos de obsidiana de buena calidad, el Occidente de México ha recibido menos atención en estudios especializados sobre la obsidiana que otras regiones de Mesoamérica. Allí, la tradición cultural Aztatlan del posclásico temprano y medio (850/900–1350 d.C.) fue responsable del comercio extensivo de diversos productos, participando en complejas redes de comercio dentro y fuera del occidente. Esta tradición también inició una reorganización a gran escala de los sistemas socioeconómicos del área y participó activamente en la difusión de complejos patrones arquitectónicos e iconográficos que fueron compartidos por las élites de un sitio a otro. Este estudio considera esta tradición al analizar la distribución y consumo de la obsidiana en la escala regional para identificar patrones de uso que van más allá de un solo sitio.
El análisis incluye una muestra de más de 12,000 artefactos de obsidiana procedente de varios sitios ubicados en las tierras bajas noroccidentales de Nayarit. Estos análisis contribuyen a la identificación de patrones diferenciales de uso a lo largo del tiempo y del espacio en toda la región. En general, este estudio se centra en identificar la fuente de obtención de estos artefactos, incluyendo lascas, navajas, navajillas prismáticas, núcleos y desechos de talla. Mediante el uso de un detector portátil de fluorescencia de rayos X (pXRF, por sus siglas en inglés), se ha descubierto la procedencia de casi todos los artefactos. A partir de estos resultados se han identificado significativos patrones culturales de distribución que varían, espacial y temporalmente, dependiendo de la fuente utilizada. Al hacerlo, se ha presentado una imagen más clara del uso regional de la obsidiana por parte de la cultura Aztatlan durante este período crucial de la prehistoria del Occidente de México.
Los resultados de este estudio, que incluyeron análisis macroscópicos y geoquímicos de las muestras, muestran algunas consistencias en toda la región, lo que indica una norma cultural de uso de obsidiana. La fuente de obsidiana más próxima se usó de manera indiscriminada en todos los sitios para la reducción generalizada, es decir, no especializada. Por otro lado, se importaron fuentes de obsidiana más distantes para ser utilizadas para navajas prismáticas. Esta importación coincide con el desarrollo de la red comercial Aztatlan que tuvo lugar durante el periodo posclásico. Espacialmente, la distribución sugiere que tanto el acceso como el consumo diferencial de este importante recurso estratégico reforzaron internamente la estructura jerárquica de los grupos de elite, legitimando su posición social y su papel en el control y distribución de bienes de prestigio, como la obsidiana procedente del altiplano central de México (Sierra de las Navajas, Hidalgo) y la que se explotaba en varios yacimientos del altiplano de Jalisco (volcán de Tequila).
Al final, este estudio es un análisis exhaustivo de la obsidiana a nivel regional que ayuda a comprender mejor la cultura material del complejo Aztatlan. Puede servir como referencia para estudios futuros de obsidiana en el Occidente de México, interesados en comprender mejor las rutas comerciales que abastecían a la población de la zona nuclear costera Aztatlan.
ACKNOWLEDGMENTS
I would like to thank the following individuals for their guidance and assistance with this project. In no particular order, thank you to Michael Mathiowetz, Jeff Ferguson, Todd VanPool, Michael Ohnersorgen, Michael Glascock, and especially Mauricio Garduño Ambriz. I would also like to thank the anonymous reviewers and the various institutions which have provided assistance and support: Instituto Nacional de Antropología e Historia (INAH) Centro Nayarit, L'institut de Recherche sur les Archéomatériaux—Centre de recherche en physique appliquée à l'archéologie (Université Bordeaux Montaigne), the Archaeometry Laboratory at the University of Missouri Research Reactor (MURR), Bruker Corporation, and The Fowler Museum at the University of California, Los Angeles. Finally, I am grateful for the financial assistance from the Raymond Wood Excellence in Archaeology Fund and the MURR NSF grant BCS-1415403.