
I. INTRODUCTION
In the past few years, hybrid lead halide perovskites have emerged as a promising material for photovoltaic applications owing to their outstanding optoelectronic properties. Reference Green, Emery, Hishikawa, Warta and Dunlop1,Reference Kojima, Teshima, Shirai and Miyasaka2 The abundance of precursor materials and the possibility of solution processing raise the hope of low-cost, highly efficient solar cells with a short energy payback time compared to the currently established technologies. Reference Binek, Petrus, Huber, Bristow, Hu, Bein and Docampo3–Reference Boix, Agarwala, Ming Koh, Mathews and Mhaisalkar7 Furthermore, the interest in these materials has increased due to reports of efficient light harvesting organic-inorganic halides (AMX3), in which M = Pb and A = organic cations [methylammonium (MA), formamidinium (FA), and guanidinium (GUA)]. Reference Dimesso, Dimamay, Hamburger and Jaegermann5,Reference Dimesso, Kim and Jaegermann6 Despite their high power conversion efficiencies (PCEs), perovskite solar cells still have not entered commercial markets at this time. One of the current major issues is the heavy metal lead used in the perovskite structure in high-efficiency devices, which is known to be a significant hazard to the environment and human health. Reference Benmessaoud, Mahul-Mellier, Horvath, Maco, Spina, Lashuel and Forro8–Reference Pourrut, Shahid, Dumat, Winterton and Pinelli11 The toxic effects of lead are ascribed to its harmful interactions with proteins, which cause changes in the folding of the proteins resulting in reduced activity and loss of function. Reference Toscano and Guilarte10,Reference Pourrut, Shahid, Dumat, Winterton and Pinelli11 Because of this, a key scientific challenge is to replace the lead in the perovskite crystal with a less toxic metal. The most viable replacements for Pb in the perovskite material are Sn and Ge. However, the stability of the 2+ oxidation state decreases when moving up the group 14 elements, which leads to the poor stability of hybrid perovskite photovoltaic devices, especially under operating conditions, creating a further considerable barrier to commercialization. Reference Ogomi, Morita, Tsukamoto, Saitho, Fujikawa, Shen, Toyoda, Yoshino, Pandey, Ma and Hayase12 According to International Standards (IEC 61646 climatic chamber tests), long-term stability at 85 °C (representing an elevated temperature on a roof on a hot summer day) is required to compete with the silicon-based technology Reference Conings, Drijkoningen, Gauquelin, Babayigit, D’Haen, D’Olieslaeger, Ethirajan, Verbeeck, Manca, Mosconi, De Angelis and Boyen13 ; the material should be stable till 150 °C, a typical curing temperature for ethylene-vinyl acetate (EVA) and many other commercial encapsulants. A recent study by Ogomi Reference Ogomi, Morita, Tsukamoto, Saitho, Fujikawa, Shen, Toyoda, Yoshino, Pandey, Ma and Hayase12 reported a mixed metal, Sn–Pb perovskite which allowed tunability of the band gap of the perovskite absorber by varying the Sn to Pb ratio, indicating that Sn could be a good choice of metal ion, especially for lower band gap solar cells (with adsorption edge at 1060 nm for the composition MAPb0.5Sn0.5I3). However, the same study reported that the neat MASnI3 perovskite does not exhibit significant photovoltaic properties and that a minimum content of Pb is needed to stabilize Sn in its 2+ oxidation state. On the other hand, by investigating the Cs–Sn–Pb–I system after annealing in nitrogen and air through thermal analysis, our group has found out that the thermal instability in nitrogen can be related to a loss of iodine and in air to the additional formation of Sn(II)–O and Sn(IV)–O binds. Reference Liu, Fan, Li, Zhang and Mai14,Reference Dimesso, Das, Stoehr, Mayer and Jaegermann15
Important information on the thermal stability as well as on understanding the light absorbing mechanisms of the Sn2+-containing perovskite can be obtained by investigating MASnI3 powders which can be used as precursors for the preparation of solar cell devices as previously reported. Reference Dimesso, Kim and Jaegermann6 To our best knowledge, up to now the investigations concern the perovskite system with the stoichiometric molar ratio (MA:Sn = 1:1) and no literature has been found on different MA:Sn molar ratios. The purpose of this work is the investigation on the effect of Sn-content on the structural, microstructural, optical, and photoluminescence (PL) properties of CH3NH3Sn x I3 powder systems with 0.9 ≤ x ≤ 1.4, prepared by a self-organizing process in aqueous solutions Reference Dimesso, Dimamay, Hamburger and Jaegermann5 and annealed in inert (nitrogen) and oxidizing atmospheres (air).
II. EXPERIMENTAL
Methylammonium tin iodide powders were obtained by a precipitation process in aqueous solutions which were prepared by commercially available materials. In particular, Sn(CH3COO)2 [tin(II) acetate, Alfa Aesar, Thermo Fisher (Kandel) GmbH, Karlsruhe Germany], HI (47 wt%, hydroiodic acid stabilized with 1.5 wt% hypophosphorous acid, Alfa Aesar), and CH3NH2 (40 wt% aqueous solution, methylamine, Alfa Aesar) were used as delivered. The materials were prepared by the addition of a corresponding amount of CH3NH2 at T = 110 °C in aqueous solutions containing Sn2+ ions (MA:Sn = 1:x, with x = 0.9, 1.0, 1.1, 1.2, and 1.4 M ratios respectively) in air. To avoid the Sn-oxidation during the preparation with corresponding formation of purple I3− species, 3.5 mL H3PO2 solution (hypophosphorous acid, 50 wt%, Fisher Scientific, Loughborough, United Kingdom) was added in solution (9.0 mL) during heating up. Reference Scaife, Weller and Fisher16,Reference Foster, Nahas, Lineken and Fernelius17 After cooling down the solution to room temperature, the crystallized black powders were separated from the mother liqueur and washed with 2-propanol, then with di-ethyl-ether, and finally with toluene. The powders did not optically reveal any changes even after days under ambient conditions. To avoid any surface contamination or reaction, the as-prepared and annealed materials were stored in a glove-box under Ar-atmosphere (≤5 ppm H2O).
The structural and microstructural analyses were performed under the same conditions as previously reported. Reference Dimesso, Dimamay, Hamburger and Jaegermann5 Optical diffuse-reflectance measurements and the estimation of the band gap of the materials were carried out as reported in our previous work. X-ray induced photoelectron spectroscopy (XPS) analysis was performed using a Thermo Fischer Scientific (Waltham, Massachusetts) spectrometer equipped with a monocromated Al-Kα (1468.6 eV) source. The photoemission measurements were carried in ultra high vacuum (10−9 mbar). The data were collected with a pass energy of 10 eV, a step width of 0.05 eV, and 50 ms acquisition time. The take-off angle for the measurements was 45°. The powder samples were stuck on an In-foil. The binding energy of the peaks was calibrated using the Ag (Fermi level, 3d) and Cu2p peaks. Optical diffuse-reflectance measurements and the estimation of the band gap of the materials were carried out as reported in our previous work. Reference Dimesso, Dimamay, Hamburger and Jaegermann5,Reference Liu, Fan, Li, Zhang and Mai14 The PL measurements were performed by a VARIAN Cary Ellipse fluorescence spectrophotometer (Agilent Technologies, Santa Clara, California) equipped with an Xe-arc as the emission source. The emission properties were measured in the 600–1100 nm range. All measurements were performed at room temperature.
III. RESULTS AND DISCUSSION
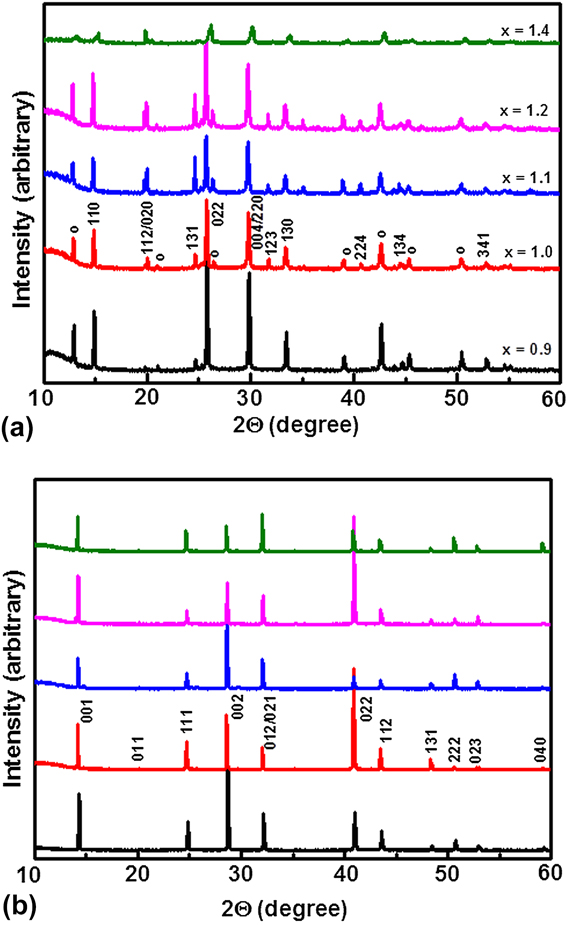
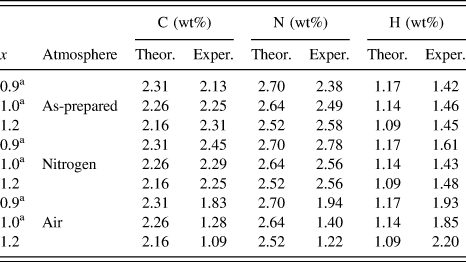
The crystalline structure of the MA–Sn–I systems was investigated by powder X-ray diffraction (XRD) analysis. The diffraction patterns of the “as-prepared” MASn x I3 systems (Fig. 1) revealed CH3NH3SnI3, with a tetragonal crystalline structure (space group I4cm), and monoclinic SnI2 [indicated with “o” in Fig. 1(a)] as the major crystalline phases. By observing the XRD patterns, there are some important points to note. First, the crystalline reflections of the MASnI3 tetragonal phase are shifted to higher diffraction angles compared to those reported in the literature. This can be explained by the presence and interactions of water molecules with the crystalline structure of the MASnI3 phase through hydrogen bonds with iodine ions coordinated to the Sn-ions. The shift of the crystalline reflections has been recently reported by Dang Reference Dang, Zhou, Liu, Ju, Xia, Xia and Tao18 during the investigation of MASnI3 single crystals after exposure to air for a month and supported by the elemental analysis (CHN-Analysis) performed on the as-prepared CH3NH3Sn x I3 powders for x = 0.9, x = 1.0, and x = 1.2, respectively, (summarized in Table I). A description of the CHN-analysis and procedure is reported in the Supplementary Material. Indeed, the experimental values of carbon, nitrogen, and hydrogen (in wt%) would confirm the presence of the methylammonium group in the as-prepared materials independent of the Sn-content in the starting materials. The higher carbon and hydrogen contents can be explained by the absorption from species in the environment (moisture and carbon dioxide). Second, the intensity of the crystalline reflections of the MASnI3 phase increases at increasing the Sn-content (till x = 1.2); at higher Sn-content (x = 1.4), a broadening of the crystalline peaks has been detected. This can be explained by the higher Sn-content into the material. Tin sometimes plays the role of a glass former and sometimes that of a network modifier. Reference Bartenev, Suzdalev and Tsyganov19 In noncrystalline oxide materials (or “glasses”), constituents can be either network formers or intermediates or network modifiers. The network formers (e.g., Si, B, and Ge) form a highly cross-linked network of chemical bonds. The intermediates (e.g., Ti, Al, Zr, Be, Mg, and Zn) can act as both network formers and modifiers, according to the glass composition. The network modifiers (e.g., Ca, Pb, Li, Na, K, and P2O5) alter the network structure; they are usually present as ions, compensated by nearby nonbridging oxygen atoms, bound by one covalent bond to the glass network and holding one negative charge to compensate for the positive ion nearby. On the other hand, no effect of the Sn-content on the morphology of the as-prepared materials has been observed: the crystallites show an irregular polyhedral morphology, with a length ranging between 50 and 400 μm.
XRD patterns of CH3NH3Sn x I3 systems for different values of x, (a) as-prepared, (b) after annealing in nitrogen at T = 150 °C, t = 8 h. The monoclinic SnI2 phase has been indicated with “o”.

Elemental analysis of CH3NH3Sn x I3 systems for different values of “x”. The experimental values were obtained as the average of two in-a-row measurements.

The thermal properties of the as-prepared CH3NH3Sn x I3 systems were investigated by dynamic differential thermal analysis (DTA) and dynamic thermogravimetry (TG) in the range between 30 and 600 °C (heating rate of 10 K/min) under flowing nitrogen and synthetic air. A detailed discussion on the results of the thermal analysis has been previously reported. Reference Dimesso, Fasel, Lakus-Wollny, Mayer and Jaegermann20 We found out that under nitrogen, the thermal event(s) above T = 200 °C are related to the decomposition of the perovskitic systems to solid Sn(II) iodide and gaseous methylamine and hydrogen iodide followed by the melting of the solid phase according to the processes
 $${\rm{C}}{{\rm{H}}_3}{\rm{N}}{{\rm{H}}_3}{\rm{Sn}}{{\rm{I}}_3}\left( {\rm{s}} \right) \to {\rm{C}}{{\rm{H}}_3}{\rm{N}}{{\rm{H}}_2}\left( {\rm{g}} \right) + {\rm{HI}}\left( {\rm{g}} \right) + {\rm{Sn}}{{\rm{I}}_2}\left( {\rm{s}} \right)\quad ,$$
 $${\rm{Sn}}{{\rm{I}}_2}\left( {\rm{s}} \right) \to {\rm{Sn}}{{\rm{I}}_2}\left( {{\rm{liq}}} \right)\quad ,$$
as reported by Mitzi Reference Mitzi21 and recently confirmed by Brunetti Reference Brunetti, Cavallo, Ciccioli, Gigli and Latini22 for the Pb-containing analogues. In our case, the processes (1) and (2) are confirmed by the absence of a “plateau” in the TG-curve. On the other hand, we observed a shift of the thermal events and consequently of the processes (1) and (2) toward lower temperatures in air. A possible explanation is related to the different heat transfer and thermal conductivities of the analyzed materials in air (air is a worse thermal insulator than nitrogen), and the formation of the Sn2+–O and Sn4+–O species according to the reaction 2SnO(s) + O2(g) → 2SnO2(s) was also considered. Interestingly, the thermal profiles in nitrogen and air showed an endothermic event peaking at T = 140 °C, which is not related to any weight loss in the thermogravimetric profiles. To provide more information on the reactions associated to this small thermal event, the as-prepared powders were thermally treated at T = 150 °C for t = 8 h under flowing nitrogen and flowing synthetic air. The diffraction patterns of the MASn x I3 systems annealed in nitrogen are shown in Fig. 1(b). At room temperature, the hybrid compounds CH3NH3Sn x I3 adopted a nearly cubic perovskite structure (space group P4mm) Reference Stoumpos, Malliakas and Kanatzidis23 ; this structure is constructed of a network of corner sharing SnX6 octahedra that encompass an organic monovalent cation, [CH3NH3]+. The organic monovalent cation is highly disordered and free to rotate at high temperature because the thermal energy surpasses the energy barriers between different stable configurations, Reference Noel, Stranks, Abate, Wehrenfennig, Guarnera, Haghighirad, Sadhanala, Eperon, Pathak, Johnston, Petrozza, Herza and Snaith24 which can indicate that the organic cation does not form a strong bond with the halide atoms. After annealing in air, the XRD patterns revealed the presence of very broad reflections (Fig. S1, x = 0.9 and x = 1.0, respectively), which can be explained by the growth of noncrystalline phases related to a possible degradation reaction of the perovskites. Indeed, the reaction of oxygen atoms with the Sn-ions of the perovskite through defects and dislocations in the crystalline structure of the MASnI3 phase can lead to the formation of Sn(II)–O [and possibly Sn(IV)–O] binds Reference Dimesso, Das, Stoehr, Mayer and Jaegermann15 and consequently to the formation of noncrystalline phases due to the nature of Sn-oxides as network modifiers.
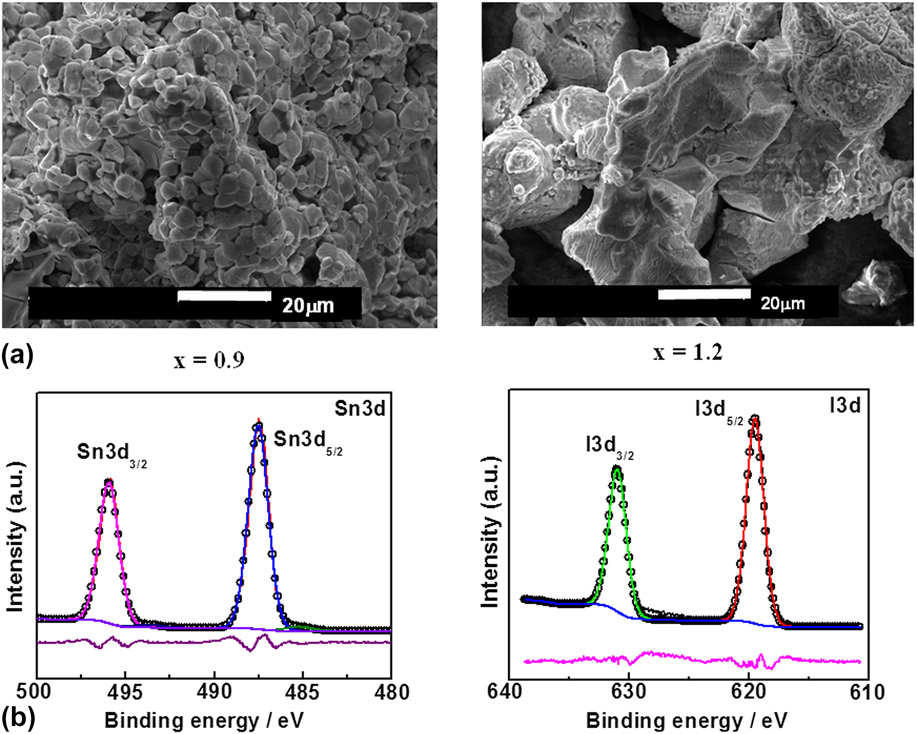
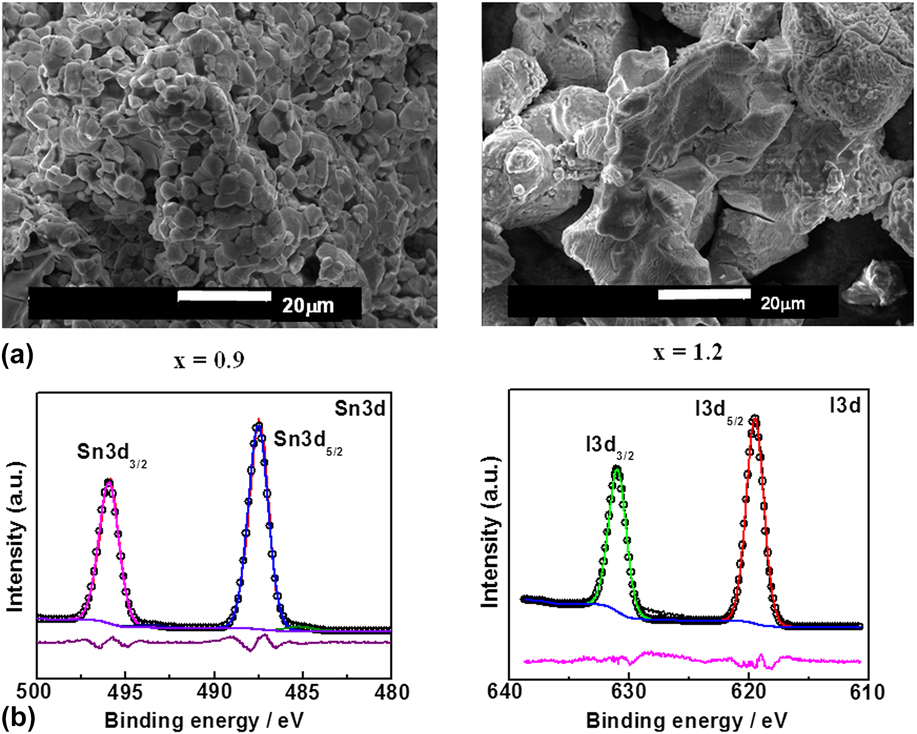
Typical SEM images of the MASn x I3 systems are shown in Figs. 2(a) and 2(b). For x = 0.9, the crystallites show irregular polyhedral morphology, with a length ranging between 2 and 4 μm [Fig. 2(a)], at higher Sn-content (x = 1.2), a “melt-like” morphology with irregularly shaped crystallites can be observed. The morphological analysis supports the XRD and DTA data on a phase transformation without heat exchange during annealing before decomposition of the material. The phase transformation occurs independent of the initial Sn-content in the material which can indicate an “active contribution” of the SnI2 species in the mechanism. A similar behavior has been observed by Ogomi Reference Conings, Drijkoningen, Gauquelin, Babayigit, D’Haen, D’Olieslaeger, Ethirajan, Verbeeck, Manca, Mosconi, De Angelis and Boyen13 and more recently by Ju Reference Ju, Sun, Zhaob and Liang25 during the investigation of MAPb x Sn1−x I3 systems, particularly for x ≈ 0.5 by computational calculations. The calculated results reveal that the band gaps of MAPb x Sn1−x I3 systems are sensitive to the Sn/Pb ratio and are proportional to the x component, consistent with the previous reports. The key role of I-containing species is supported by our results. The CHN-analysis of the annealed samples (reported in Table I) revealed experimental values of carbon, nitrogen, and hydrogen very close to the theoretical ones which would indicate that the change of the crystalline structure of the MASnI3 phase (at T ≈ 140 °C) took place without any lost of methylammonium ions. The oxidation state of the elements was determined by XPS investigations on the MASI systems after annealing under nitrogen. The XPS survey spectra (not reported in this work) detected the presence of carbon, nitrogen, tin, iodine, and oxygen. The presence of oxygen can be explained by the adsorption of impurities in the atmosphere due to grinding of the material as well as due to the ex situ XPS measurements. The fit of the Sn3d and I3d core level spectra was performed using the Thermo Scientific™ Avantage Software (Thermo Fisher Scientific, Inc., Waltham, Massachusetts) for surface analysis. The background was corrected using “smart background fitting”, and the peaks were fitted by a combination of Gaussian and Lorentzian functions. The Sn3d 5/2 core level XPS profile showed a main peak position at 487.5 eV, attributed to the formation of the Sn–I bond, and a small peak at lower binding energy (485 eV), possibly related to the formation of metallic Sn(0). Reference Liu, Fan, Li, Zhang and Mai14
(a) Typical SEM-images of cubic CH3NH3Sn x I3 systems for x = 0.9 and x = 1.2, respectively; (b) Sn3d and I3d photoelectron emission spectra of the cubic-MASn0.9I3 system.
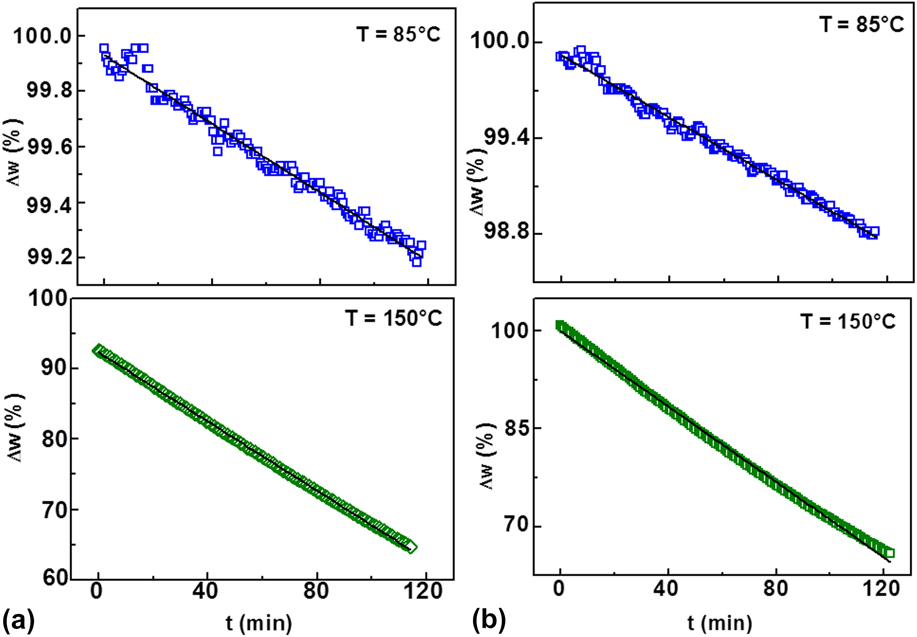
The thermal stability of the cubic CH3NH3Sn x I3 systems was investigated by dynamic DTA-TG measurements in the temperature range between 30 and 500 °C (heating rate of 10 K/min) under flowing nitrogen and synthetic air. The results of the thermal investigation, for x = 1.0, are previously reported. Reference Dimesso, Fasel, Lakus-Wollny, Mayer and Jaegermann20 Under nitrogen, the DTA profile was related to (i) the decomposition of the perovskite system with formation of SnI2 as solid phase and (ii) the melting of the SnI2; this fact is supported by the weight losses recorded in the TG profile (and first derivative) in which weight losses of Δw ≈ −0.13% at T = 85 °C and Δw ≈ −0.90% at T = 150 °C were determined. On the other hand, in air, the DTA profile of MASn x I3 systems showed a shift toward lower temperatures of the endothermic events related to the decomposition of the MASnI3 phase and melting of solid SnI2. A deeper analysis of the thermal features revealed the presence of additional thermal events which were explained by the formation of Sn(IV)–O binds from Sn(IV)–I compound(s) in the vapor phase and the decomposition of methylamine into CO2, H2O, and N2. Reference Li and Oshima26 Indeed, this is supported by the results of the dynamic thermogravimetric profile for x = 1.0 which recorded in air a weight loss of 0.35 wt% at t = 85 °C and 0.51 wt% at T = 150 °C, respectively, and of the elemental analysis (Table I) on the samples annealed in air which revealed a lower amount of carbon and nitrogen compared to the theoretical values, whereas the excess of hydrogen can be explained by the formation of tin oxide hydrates (SnO2·nH2O) in contact with moisture of the ambient atmosphere.
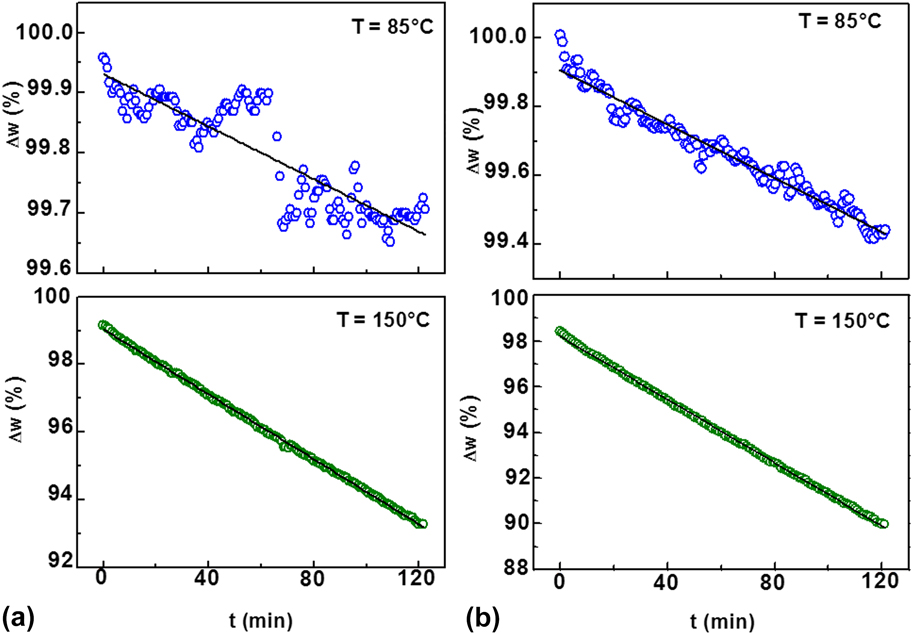
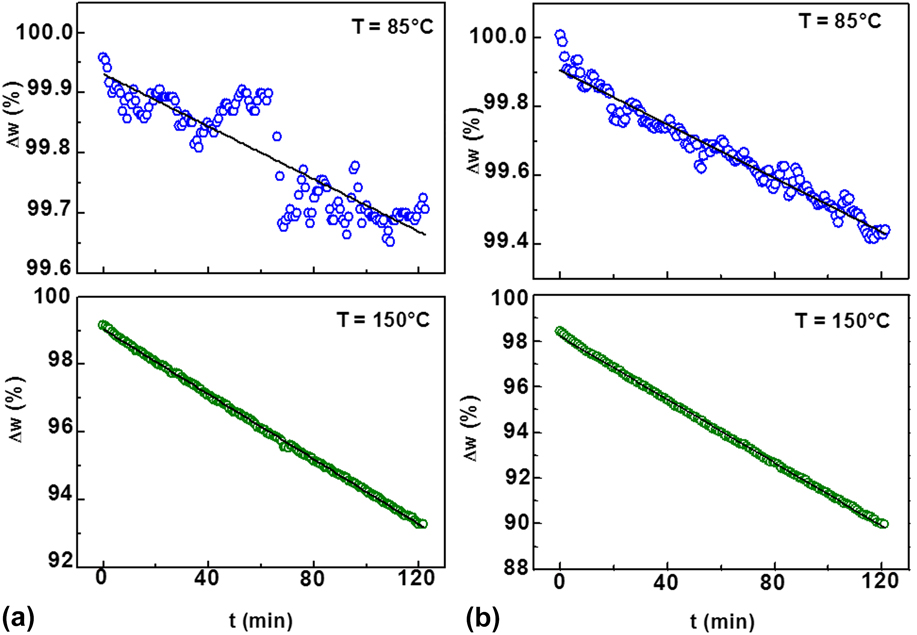
The weight loss mechanism and the influence of the starting Sn-content on this effect, MASn x I3 systems (for x = 0.9 and x = 1.0), were investigated by static TG-analysis in nitrogen and air. The samples were heated up to T = 85 °C and to T = 150 °C, respectively, and the weight loss was measured in a time range t = 2 h. The weight losses as a function of time at constant temperature are shown in Fig. 3 in nitrogen atmosphere and in Fig. 4 in air, respectively. The loss rates (wt% per minute) have been calculated by linear fit of the experimental data; the corresponding fit parameters are summarized in Table SI. Under nitrogen, weight loss rates of −0.0022 wt%/min (T = 85 °C) and −0.048 wt%/min (T = 150 °C) for the MASn0.9I3 phase [Fig. 3(a)] and −0.0039 wt%/min (T = 85 °C) and −0.0693 wt%/min (T = 150 °C) for the MASn1.0I3 system [Fig. 3(b)] were estimated, respectively. From the obtained results, we suggest that the weight losses can be related to the iodine (-containing) species and may be related to a change of the stoichiometric ratios among cations and iodine anions in the perovskite active material with the time. This fact would be supported by the CHN-analysis (Table I) on the samples annealed under nitrogen which showed a small difference of the carbon and nitrogen contents compared to the untreated samples (as-prepared). This would indicate that the methylammonium ions are not involved in the weight losses of the Sn-containing perovskite. We speculate that the loss of iodine could “create the conditions” for the disproportion of the Sn(II)-ions, and this would provide an explanation of the poor PCE performance of this system reported in the literature. Reference Conings, Drijkoningen, Gauquelin, Babayigit, D’Haen, D’Olieslaeger, Ethirajan, Verbeeck, Manca, Mosconi, De Angelis and Boyen13
Isothermal curves of the CH3NH3Sn x I3 systems at T = 85 °C and T = 150 °C, t = 2 h under nitrogen for (a) x = 0.9 and (b) x = 1.0, respectively. The black line is a linear fit of the data originated by the program OriginPro 8. The corresponding fit parameters are reported in Table SI.
Isothermal curves of the CH3NH3Sn x I3 systems at T = 85 °C and T = 150 °C, t = 2 h in air for (a) x = 0.9 and (b) for x = 1.0, respectively. The black line is a linear fit of the data originated by the program OriginPro 8. The corresponding fit parameters are reported in Table SI.
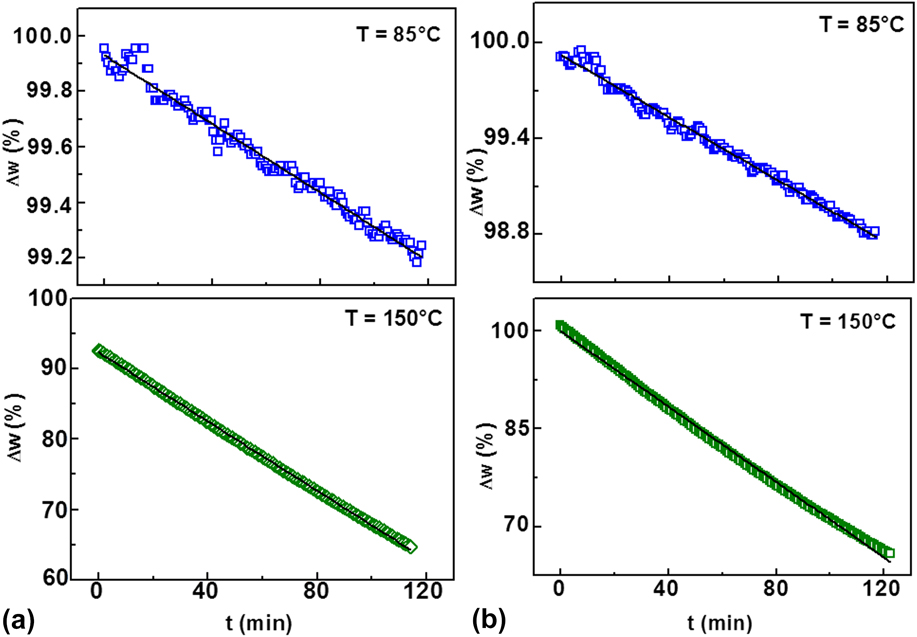
On the other hand, static TG measurements performed in air revealed higher weight loss rates (Table SI) which confirm a more negative effect of the oxygen ions on the perovskite material. For x = 0.9, the weight loss rates were −0.0062 wt%/min at T = 85 °C and −0.2463 wt%/min at T = 150 °C, [Fig. 4(a)] which are 3 times and 5 times higher than the corresponding rates in nitrogen. For x = 1.0, loss rates of −0.0098 wt%/min (T = 85 °C) and −0.2885 wt%/min (T = 150 °C) were estimated [Fig. 4(b)] which are 2.5 times, 4 times higher than those observed under nitrogen and higher than the loss rates observed in the MASn0.9I3 system. These data can be explained by using oxygen atoms as a substitute for iodine anions in the perovskite structure of the MA–Sn–I systems, which leads to the oxidation fo Sn(II) into Sn(IV) as well as to the formation of Sn(II)–O and Sn(IV)–O binds as observed previously in the Cs- and Cs–Pb-containing systems. Reference Liu, Fan, Li, Zhang and Mai14,Reference Dimesso, Das, Stoehr, Mayer and Jaegermann15
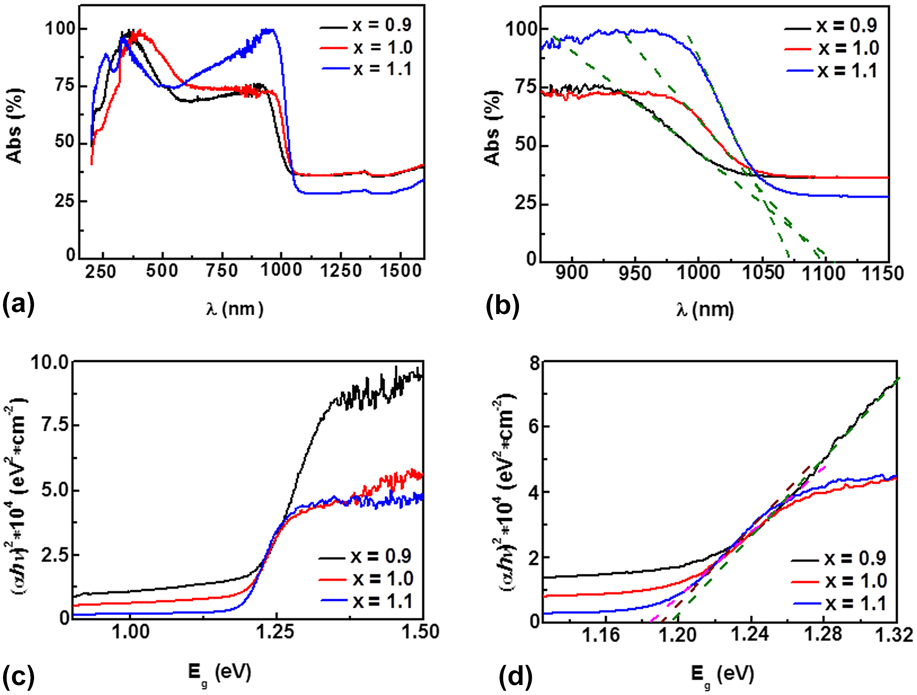
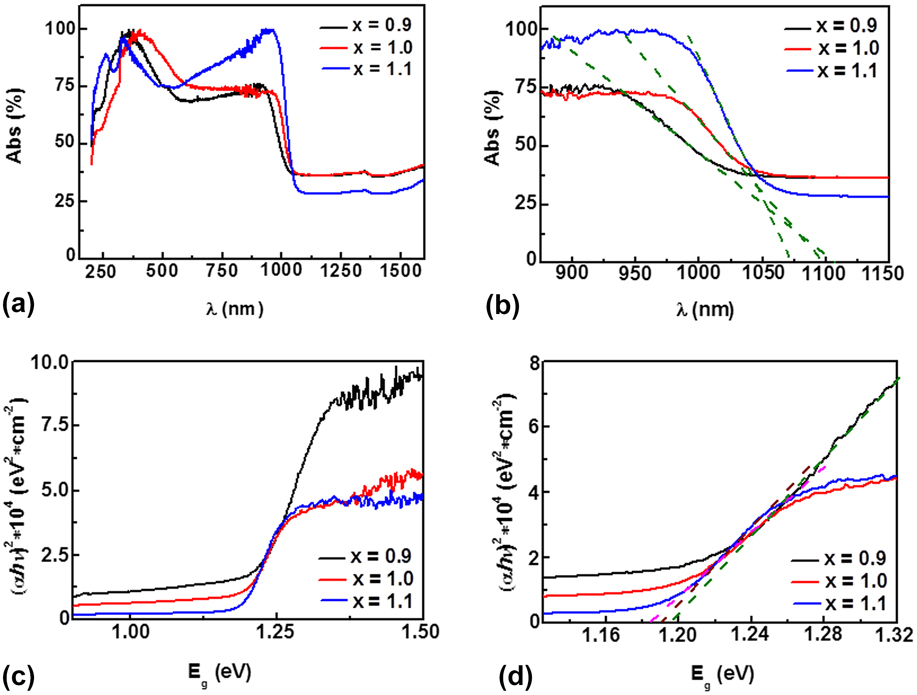
The differences in the structural and morphological features in dependence on the Sn-content can have a dramatic influence on the optical properties of the prepared materials. In Fig. 5, the optical absorption spectra [Figs. 5(a) and 5(b)] and the Tauc’s plots [Figs. 5(c) and 5(d)] of the cubic-MASn x I3 systems are shown. Assuming a bulk-like behavior, the adsorption edges [λon-set (nm), the frequency values at which the photons absorption begins] can be obtained by fitting the linear part of the absorbance spectrum [Fig. 5(b)]. Reference Kojima, Teshima, Shirai and Miyasaka2 The values of the adsorption edges are reported in Table SII. The adsorption spectra of the MASn x I3 systems showed a dramatic dependence of the optical properties on the starting Sn-content. Indeed, in the 0.9 ≤ x ≤ 1.1 composition range, the optical spectra display a strong, abrupt absorption in the infrared region with absorbance edges at 1107.0 nm for x = 0.9, at 1098.6 nm for x = 1.0 and at 1073.2 nm for x = 1.1, respectively. Furthermore, as shown in Fig. 5(a), the pregap region does not show strong absorption tails indicating the high quality of the prepared materials, whereas at a higher Sn-content (x ≥ 1.2), a broad tail of the absorbance profile can be observed (Fig. S2). As nano-particles in powders tend to agglomerate and consequently develop bulk-like bands, the relationship between the adsorption coefficient (α) near the absorption edge and the optical band gap (E g) for direct interband transitions obeys a relationship as previously reported [Fig. 5(c)]. Reference Dimesso, Dimamay, Hamburger and Jaegermann5,Reference Dimesso, Kim and Jaegermann6 By extrapolating to α = 0 [Fig. 5(d)], the plots revealed a direct semiconducting behavior with band energy gaps of 1.18–1.19 eV. The optical band gap values are lower than 1.3 eV which is commonly reported in the literature and very close to the bulk silicon band gap (E 0 ≈ 1.11 eV at 300 K). Reference Kittel27 This behavior can be related with Sn cation vacancies which are the most common defects in the Sn-containing systems Reference Needleman9 and possibly with the iodine stoichiometry in our annealed samples.
(a) Normalized absorption spectra and (b) magnification of (a) with fit of the linear part of the absorbance spectra; (c) plots (αhν)2 for direct transitions, where α is absorption coefficient and hν is the photon energy, of the cubic-MASn x I3 systems; and (d) band gaps E g are obtained by extrapolation to α = 0. The values are reported in Table SII.
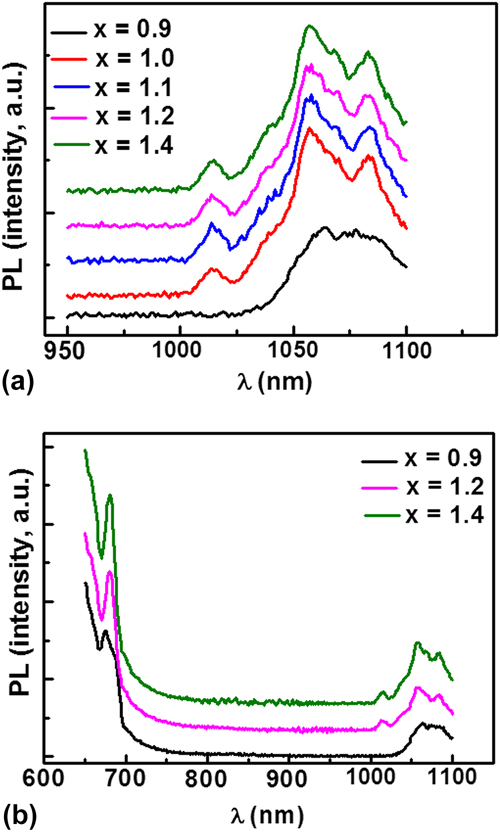
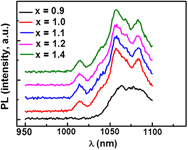
The PL emission properties of the MA–Sn–I systems were investigated at room temperature using an excitation wave length of λexc = 500 nm. The PL emission spectra, in the wave length range between 950 and 1100 nm, of the cubic-MASn x I3 systems are shown in Fig. 6(a), and the corresponding PL-peak values are reported in Table SII. By observing Fig. 6(a) and the data in Table SII values, some points are to be noted. A dramatic influence of the initial Sn-content on the PL emission spectra of the MASn x I3 system has been observed. Indeed, for x = 0.9, a band peaking at ∼1064 nm with a broad shoulder at ∼1078 nm was detected, and an additional band peaking at ∼1014 nm [Fig. 6(a) and Table SII] was observed at a higher Sn-content (for x ≥ 1.0). Moreover, additional PL-emission bands peaking at ∼1057 nm, ∼1084 nm, respectively, with shoulders at ∼1035–1038 and ∼1070 nm, appeared in the 1.0 ≤ x ≤ 1.2 range. Finally, for x = 1.4, further additional bands peaking at ∼1040 and ∼1068 nm, respectively, were observed [Fig. 6(a)]. The wavelengths of the PL-peak maxima are higher than those reported in the literature Reference Noel, Stranks, Abate, Wehrenfennig, Guarnera, Haghighirad, Sadhanala, Eperon, Pathak, Johnston, Petrozza, Herza and Snaith24,Reference Hao, Stoumpos, Cao, Chang and Kanatzidis28 at room temperature. Hao Reference Hao, Stoumpos, Cao, Chang and Kanatzidis28 reported a PL-emission peak at 950 nm for the MASnI3 phase at room temperature, and Noel Reference Noel, Stranks, Abate, Wehrenfennig, Guarnera, Haghighirad, Sadhanala, Eperon, Pathak, Johnston, Petrozza, Herza and Snaith24 reported a broad adsorption edge at 1000 nm and a PL emission peaked at ∼980 nm with a photoexcitation of 500 nm.
(a) PL-emission spectra (RT, λexc = 500 nm) in the 950–1100 nm range of the cubic- MASn x I3 systems. The corresponding peak values are reported in Table SII; (b) PL-emission spectra (RT, λexc = 500 nm) in the range 650–1100 nm for x = 0.9, x = 1.2, and x = 1.4, respectively.

To avoid any misunderstanding and misleading information, we performed a PL-emission survey (at RT and λexc = 500 nm) in the 650–1100 nm of the cubic-MASn x I3 phase for different values of “x” [Fig. 6(b)]. For x = 0.9, the PL-spectrum consists of bands peaked at ∼675 nm and above 1000 nm. On the other hand, at a higher Sn-content (x = 1.2 and x = 1.4), a shift of the PL-emission peak to ∼681 nm was detected. This emission was observed in SnI2-doped CdI2 crystals Reference Novosad and Kovalyuk29 and was attributed to electron–hole recombination on halogen vacancies, followed by energy transfer, via an Auger process, to emission centers involving interstitial Cd. The origin and presence of more bands by increasing the Sn-content can be explained by supposing that the defect formation energy of the Sn-vacancies generating the hole is lower than that of any other defects. This would indicate that a major p-type carrier source is Sn-vacancies, and the black compound is a nearly intrinsic p-type semiconductor. The facile generation of Sn vacancies would be even better activated by the heat energy, resulting in continuously raising the number of allowed spectroscopic transitions. Reference Liu, Fan, Li, Zhang and Mai14 Furthermore, monoclinic SnI2 in single crystals contains two types of sites Reference Howie, Moser and Trevena30 : octahedral (as in SnTe and in cubic CsSnBr3) and hexagonal (as in PbCl2). Since the SnI2 structure contains these two inequivalent types of cation sites, we can reasonably suppose that there are at least two types of luminescence centers (i.e., defects and impurities or self-trapped excitons) in the MA–Sn–I systems, which can be attributed to these different coordination sites.
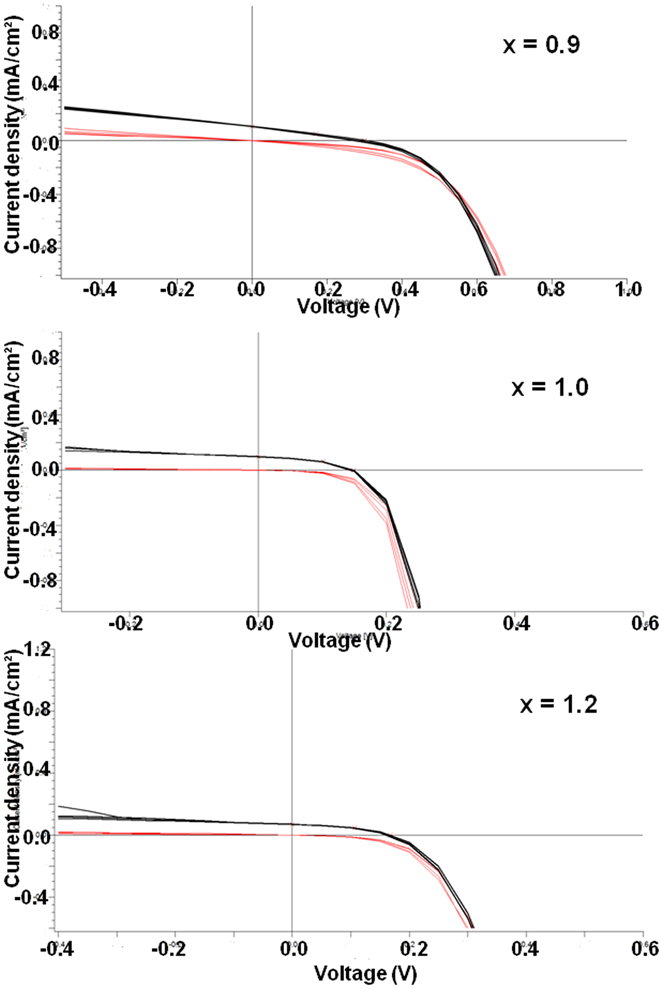
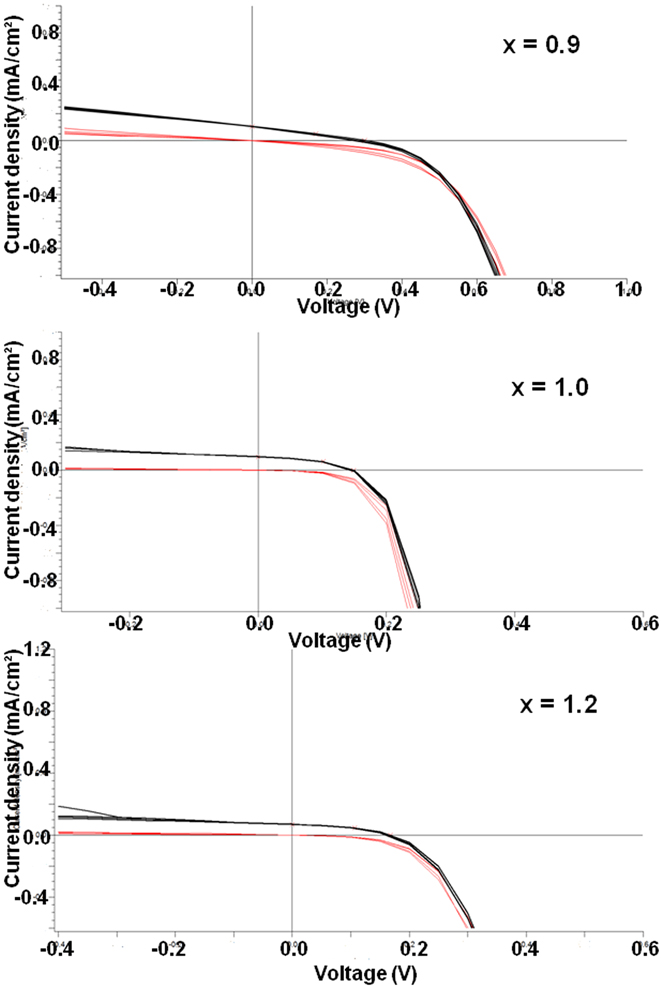
The next step of our investigation was the preparation of the layers using the prepared powders as precursors. Detailed descriptions of the device fabrication and characterization methods are reported in the Supplementary Material. From our previous experiments on the preparation of solar cells by dissolution of the prepared powders in an appropriate solvent, Reference Dimesso, Kim and Jaegermann6 we concluded that this process favors the recrystallization of the light harvesting materials on the substrates. After dissolution and recrystallization of the MASnI3 powders as the light harvesting material, hole-transporting layers (spiro-OMeTAD) were deposited by spin-coating. Finally gold electrodes were thermally evaporated under vacuum. Typical current–voltage (J–V) characteristics measured under simulated sunlight (AM1.5, 100 mW/cm2) illumination, by using spiro-OMeTAD as the hole-conductor are shown in Fig. 7. The J–V curves under illumination (black curves) show a semiconducting behavior which confirms the PL profile observed during our measurements. These data can be explained by supposing a “quenching” process which takes place due to the loss of iodine (-containing) species inducing the formation of “excited dimers” (or “excimers”).
Example of J–V characteristics measured under simulated sunlight (AM1.5, 100 mW/cm2) illumination for MASn x I3 solar cells. The black curves are obtained under illumination of the solar cell whereas the red curves are obtained without illumination of the device.
Although the low PCEs value the Sn-containing hybrid systems, this study opens up opportunities to discover visible and IR light-emitting materials at room temperature, which is highly desirable in achieving breakthrough applications in photovoltaics, various radiation detectors, and light-emitting diodes because the perovskite structure can incorporate a very broad range of elements. However, the poor stability of the Sn-containing system still represents a challenging factor for large scale applications, and more efforts should be dedicated to the stabilization of this system to be commercially desirable.
IV. CONCLUSIONS
Methylammonium-tin-iodide (MASn x I3, 0.9 ≤ x ≤ 1.4) systems were prepared by self assembly process in aqueous solutions. The X-ray diffraction analysis (XRD) revealed the presence of the CH3NH3SnI3 tetragonal phase (space group I4cm) and crystalline reflections attributed to SnI2 and crystallites with an irregular polyhedral morphology (length 50–400 μm). The as-prepared powders were thermally treated at T = 150 °C for t = 8 h under flowing nitrogen and flowing synthetic air. Under nitrogen, the hybrid compounds CH3NH3Sn x I3 adopted a cubic perovskite structure (space group P4mm) with the morphology depending on the Sn-content. For x = 0.9, the crystallites show an irregular polyhedral morphology, with a length ranging between 2 and 4 μm, whereas at a higher Sn-content (x ≥ 1.0), a “melt-like” morphology with irregularly shaped crystallites was observed. Furthermore, the CHN-analysis of the annealed samples revealed experimental values of carbon, nitrogen, and hydrogen very close to the theoretical ones which would indicate that the change of the crystalline structure of the MASnI3 phase (at T ≈ 140 °C) took place without any loss of methylammonium ions. Under air, the XRD patterns revealed the formation of noncrystalline phases due to a degradation reaction of the crystallites. The XPS spectra detected the presence of carbon, nitrogen, tin, iodine, and oxygen. Moreover the Sn3d and I3d peak positions suggested the presence of Sn2+ ions and the formation of the Sn–I bind which confirm the structural data.
The investigation on the thermal stability of the cubic-CH3NH3Sn x I3 system by dynamic DTA-TG measurements between 30 and 500 °C, under flowing nitrogen and in air, revealed the decomposition of the perovskite systems with the formation of SnI2 as the solid phase and then the melting of the SnI2 at temperatures above T = 200 °C. Static TG-analysis in nitrogen and air revealed a linear weight loss as a function of the time. This loss was related to the formation of iodine(-containing) species as confirmed by the elemental analysis.
The optical investigations on the MASn x I3 systems showed a dramatic dependence on the starting Sn-content. Indeed, in the 0.9 ≤ x ≤ 1.1 composition range, the optical spectra displayed absorption edges at 1107.0 nm (x = 0.9), at 1098.6 nm (x = 1.0), and at 1073.2 nm (x = 1.1), respectively, whereas at a higher Sn-content (x ≥ 1.2), a broad tail of the absorbance profile was observed. The PL emission properties of the MA–Sn–I systems (room temperature, λexc = 500 nm) showed a band peaking at ∼1064 nm with a broad shoulder at ∼1078 nm (x = 0.9) and an additional band peaking at ∼1014 nm at a higher Sn-content (for x ≥ 1.0). Further bands, peaking at ∼1057 nm, ∼1084 nm, respectively, with shoulders at ∼1035–1038 and ∼1070 nm appeared by adding Sn2+ ions in the MASnI3 phase (1.0 ≤ x ≤ 1.2) and, for x = 1.4, additional bands peaking at ∼1040 nm and ∼1068 nm, respectively, have been detected. Finally, the J–V curves, under illumination, of the devices prepared by dissolving the prepared powders in DMF and spin-coated on substrates, showed a semiconducting behavior which confirms the PL profile observed during our measurements.
The novelty of this work is the investigation of off-stoichiometric Sn-containing halide perovskites and particularly on the thermal stability of these systems by static thermal measurements, performed under nitrogen and air, at possible operating temperatures. Indeed, we have found no literature on this kind of investigation on Pb-containing analogous. The obtained results can supply useful information and/or explanation on the behavior of the devices containing Sn-based perovskites.
Supplementary Material
To view supplementary material for this article, please visit https://doi.org/10.1557/jmr.2017.418.
ACKNOWLEDGMENTS
Many thanks are owed to Mr. J-C. Jaud for XRD technical assistance, to Mrs. K. Lakus-Wollny for SEM technical assistance, and to Mrs. C. Fasel for DTA-TG technical assistance. The authors thank the Federal Ministry of Research and Development (BMBF) of Germany (Project “Perosol” No. 03SF0483B) for the financial support during this work.