Introduction
While the existence of a genetic factor in the aetiology of schizophrenia is uncontroversial (e.g. Gottesman, Reference Gottesman1991), studies to date have yielded only a few candidate genes, whose effects are small and some of which are also implicated in other forms of major psychiatric disorder (Craddock & Owen, Reference Craddock and Owen2005; Collins & Sullivan, Reference Collins and Sullivan2013). This, coupled with evidence that schizophrenia shows a complex pattern of inheritance – i.e. involving multiple genes and almost certainly environmental factors as well (McGue & Gottesman, Reference McGue and Gottesman1989) – has led to a search for so-called endophenotypes, clinical or biological findings that are more closely related to risk genes than the disorder itself (Leboyer et al. Reference Leboyer, Bellivier, Nosten-Bertrand, Jouvent, Pauls and Mallet1998; Gottesman & Gould, Reference Gottesman and Gould2003). A key aspect of the endophenotype concept is that the abnormality is present not only in patients with schizophrenia but is also seen to a lesser degree in non-affected family members at a higher rate than in the general population.
The first recognizably endophenotypic construct in schizophrenia was schizotypy, a quantitative personality trait with presumptive neurobiological correlates (Meehl, Reference Meehl1962). A number of other endophenotypes have since been proposed, ranging from eye-tracking dysfunction to sensory gating deficits, cognitive impairment, neurological soft signs and brain structural abnormality (for a review, see Allen et al. Reference Allen, Griss, Folley, Hawkins and Pearlson2009). A further candidate is brain functional abnormality; here interest has focused on the reduced dorsolateral prefrontal cortex (DLPFC) activation that is well documented in schizophrenia (Hill et al. Reference Hill, Mann, Laws, Stephenson, Nimmo-Smith and McKenna2004), and more recently the ‘hyperfrontality’ or increased activation that has also been found during cognitive task performance (Weinberger et al. Reference Weinberger, Egan, Bertolino, Callicott, Mattay, Lipska, Berman and Goldberg2001; Minzenberg et al. Reference Minzenberg, Laird, Thelen, Carter and Glahn2009). MacDonald et al. (Reference MacDonald, Thermenos, Barch and Seidman2009) reviewed 20 task-related functional imaging studies carried out on first-degree relatives of patients with schizophrenia. Those using working memory tasks and tasks requiring ‘cognitive control’ (inhibition of a pre-potent response or ignoring distraction) were found to have heterogeneous findings, reporting increased, decreased and unchanged activation in the dorsolateral and the ventrolateral prefrontal cortex, in some cases with increases on one side and decreases on the other. Findings were similar in studies using long-term memory and language tasks. Studies carried out since this review have continued to find evidence of both decreased (Karch et al. Reference Karch, Leicht, Giegling, Lutz, Kunz, Buselmeier, Hey, Sporl, Jager, Meindl, Pogarell, Moller, Hegerl, Rujescu and Mulert2009; Sepede et al. Reference Sepede, Ferretti, Perrucci, Gambi, Di Donato, Nuccetelli, Del Gratta, Tartaro, Salerno, Ferro and Romani2010; Meda et al. Reference Meda, Gill, Stevens, Lorenzoni, Glahn, Calhoun, Sweeney, Tamminga, Keshavan, Thaker and Pearlson2012) and increased (Karch et al. Reference Karch, Leicht, Giegling, Lutz, Kunz, Buselmeier, Hey, Sporl, Jager, Meindl, Pogarell, Moller, Hegerl, Rujescu and Mulert2009; Woodward et al. Reference Woodward, Waldie, Rogers, Tibbo, Seres and Purdon2009; Stolz et al. Reference Stolz, Pancholi, Goradia, Paul, Keshavan, Nimgaonkar and Prasad2012; Liddle et al. Reference Liddle, Bates, Das, White, Groom, Jansen, Jackson, Hollis and Liddle2013; Sambataro et al. Reference Sambataro, Mattay, Thurin, Safrin, Rasetti, Blasi, Callicott and Weinberger2013) prefrontal activation.
Recently, a further functional imaging abnormality has been documented in schizophrenia: failure of deactivation in the medial frontal cortex (Pomarol-Clotet et al. Reference Pomarol-Clotet, Salvador, Sarro, Gomar, Vila, Martinez, Guerrero, Ortiz-Gil, Sans-Sansa, Capdevila, Cebamanos and McKenna2008; Whitfield-Gabrieli et al. Reference Whitfield-Gabrieli, Thermenos, Milanovic, Tsuang, Faraone, McCarley, Shenton, Green, Nieto-Castanon, LaViolette, Wojcik, Gabrieli and Seidman2009; Mannell et al. Reference Mannell, Franco, Calhoun, Canive, Thoma and Mayer2010; Salgado-Pineda et al. Reference Salgado-Pineda, Fakra, Delaveau, McKenna, Pomarol-Clotet and Blin2011; Schneider et al. Reference Schneider, Royer, Grosselin, Pellet, Barral, Laurent, Brouillet and Lang2011; Dreher et al. Reference Dreher, Koch, Kohn, Apud, Weinberger and Berman2012). The usual interpretation of this finding is that it represents dysfunction in the default mode network, an interconnected series of brain regions which are active at rest but which deactivate during performance of a wide range of cognitive tasks. The medial frontal cortex is one of the principal constituents of this network, along with the posterior cingulate cortex/precuneus, parts of the parietal and temporal lobe cortex and the hippocampus (for a review, see Buckner et al. Reference Buckner, Andrews-Hanna and Schacter2008). This interpretation is strengthened by studies that have used another method of examining the default mode network function, resting-state functional connectivity (Buckner et al. Reference Buckner, Andrews-Hanna and Schacter2008; Greicius, Reference Greicius2008). These have typically found changes in schizophrenia (Liang et al. Reference Liang, Zhou, Jiang, Liu, Tian, Liu and Hao2006; Bluhm et al. Reference Bluhm, Miller, Lanius, Osuch, Boksman, Neufeld, Theberge, Schaefer and Williamson2007; Mannell et al. Reference Mannell, Franco, Calhoun, Canive, Thoma and Mayer2010; Ongur et al. Reference Ongur, Lundy, Greenhouse, Shinn, Menon, Cohen and Renshaw2010; Rotarska-Jagiela et al. Reference Rotarska-Jagiela, van de Ven, Oertel-Knochel, Uhlhaas, Vogeley and Linden2010; Salvador et al. Reference Salvador, Sarro, Gomar, Ortiz-Gil, Vila, Capdevila, Bullmore, McKenna and Pomarol-Clotet2010; Camchong et al. Reference Camchong, MacDonald, Bell, Mueller and Lim2011), although there is currently no consensus about whether connectivity is increased, decreased or shows a more complex pattern of abnormality.
Examination of the default mode network in relatives of patients with schizophrenia has so far been limited. In the first study of this type, Whitfield-Gabrieli et al. (Reference Whitfield-Gabrieli, Thermenos, Milanovic, Tsuang, Faraone, McCarley, Shenton, Green, Nieto-Castanon, LaViolette, Wojcik, Gabrieli and Seidman2009) found that 13 first-degree relatives of schizophrenic patients showed failure to deactivate in the medial frontal cortex compared with 13 controls during performance of the n-back working memory task. Additionally, the failure of deactivation was found to correlate negatively with scores on a measure of psychiatric symptomatology in the relatives. In contrast, Sepede et al. (Reference Sepede, Ferretti, Perrucci, Gambi, Di Donato, Nuccetelli, Del Gratta, Tartaro, Salerno, Ferro and Romani2010) found no differences in medial frontal cortex deactivation in 11 siblings of schizophrenic patients compared with 11 healthy controls during performance of the Continuous Performance Task; instead, the relatives showed exaggerated deactivation in the posterior cingulate and retrosplenial cortex when making correct responses. Using a choice reaction time task, Liddle et al. (Reference Liddle, Bates, Das, White, Groom, Jansen, Jackson, Hollis and Liddle2013) found no overall differences in deactivation between 18 siblings of schizophrenic patients and 26 healthy controls. However, the relatives showed failure of deactivation in response to non-target as opposed to target stimuli in both the medial frontal cortex and the precuneus.
The aim in the present study was to examine task-related activations and deactivations in relatives of schizophrenic patients, using a prototypical frontal/executive task, the n-back working memory task. We also compared relatives with their siblings with schizophrenia. A particular focus of interest was on failure of deactivation, which we were able to examine in a larger sample than the three other studies carried out on relatives to date.
Method
Subjects
A total of 28 patients with schizophrenia and 28 of their healthy siblings were recruited. The schizophrenic patients all met Diagnostic and Statistical Manual of Mental Disorders, fourth edition (DSM-IV) criteria, based on interview by a psychiatrist and review of case-notes by a member of the research team (P.J.M. or S.S.). They were excluded if: (1) they were younger than 18 or older than 65 years; (2) they had a history of brain trauma or neurological disease; or (3) they had shown alcohol/substance abuse within 12 months prior to participation. They all had chronic illnesses (mean duration 15.66, s.d. = 8.18 years; range 3.5 to 41 years) and were all taking antipsychotic medication (20 atypical neuroleptics, four typical neuroleptics, four both types). The mean daily dose (in chlorpromazine equivalents) was 707.83 mg (s.d. = 319.95 mg, range 200–1274 mg).
The unaffected first-degree relatives had a mean difference in age from the patients of 5.25 years (s.d. = 3.70 years, range 0 to 13 years; one pair were non-identical twins). They met the same exclusion criteria as the patients, and were also excluded if they reported a history of mental illness and/or treatment with psychotropic medication. Twenty-seven (one declined) additionally underwent assessment using the Computerized Diagnostic Interview Schedule IV (C DIS-IV; Robins et al. Reference Robins, Cottler, Bucholz, Compton, North and Rourke2000), a structured psychiatric interview designed to detect lifetime presence of major psychiatric disorders.
Healthy subjects were recruited via poster and web-based advertisement in the hospital and local community, plus word-of-mouth requests from staff in the research unit. They met the same exclusion criteria as the patients and, like the relatives, were excluded if they reported a history of mental illness and/or treatment with psychotropic medication. Two healthy subjects were recruited for each patient–relative pair, matching for age, sex and estimated intelligence quotient (IQ). This strategy was adopted in order to be able to match properly in those cases where the patient–relative pair consisted of a male and a female.
All patients and their relatives were right-handed with the exception of one pair, who were both left-handed. All the controls were right-handed. IQ (pre-morbid IQ in the patients) was estimated using the Word Accentuation Test (Test de Acentuación de Palabras; TAP; Del Ser et al. Reference Del Ser, Gonzalez-Montalvo, Martinez-Espinosa, Delgado-Villapalos and Bermejo1997), a word reading test requiring pronunciation of Spanish words whose accents have been removed. The TAP has been standardized against the Wechsler Adult Intelligence Scale III (WAIS-III; Wechsler, Reference Wechsler2001) and scores can be converted into IQ estimates (Gomar et al. Reference Gomar, Ortiz-Gil, McKenna, Salvador, Sans-Sansa, Sarro, Guerrero and Pomarol-Clotet2011). Patients, relatives and controls were also required to have a current IQ in the normal range (i.e. ⩾70), as measured using four subtests of the WAIS-III: vocabulary, similarities, block design and matrix reasoning.
Symptoms in the patients were rated using the Positive and Negative Syndrome Scale (PANSS; Kay et al. Reference Kay, Fiszbein and Opler1987). Relatives were rated on a schizotypy scale, the Rust Inventory of Schizotypal Cognitions (RISC; Rust, Reference Rust1989). Lifetime presence of psychotic-like experiences in the relatives was also assessed. For this, ratings on the psychotic subscales of the C DIS-IV were used. This section contains 22 items, 17 for delusion-like and five for hallucination-like experiences, each of which are rated as ‘absent’, ‘questionable’ or ‘present’.
All participants gave written informed consent and the study was approved by the hospital research ethics committee. All procedures were carried out according to the Declaration of Helsinki.
Procedure
The participants performed a sequential-letter version of the n-back task (Gevins & Cutillo, Reference Gevins and Cutillo1993). Two levels of memory load (1-back and 2-back) were presented in a blocked design manner. Each block consisted of 24 letters that were shown every 2 s (1 s on, 1 s off) and all blocks contained five repetitions (1-back and 2-back depending on the block) located randomly within the blocks. Individuals had to indicate repetitions by pressing a button. Four 1-back and four 2-back blocks were presented in an interleaved way, and between them a baseline stimulus (an asterisk flashing with the same frequency as the letters) was presented for 16 s. To identify which task had to be performed, characters were shown in green in 1-back blocks and in red in the 2-back blocks. All participants first went through a training session outside the scanner.
The behavioural measure used was the signal detection theory index of sensitivity, d (Green & Swets, Reference Green and Swets1966). Higher values of d′ indicate better ability to discriminate between targets and distractors. If subjects showed negative d values in either or both of the 1-back and 2-back versions of the task, which suggests that they were not performing it, they were not included in the study.
Functional magnetic resonance imaging (fMRI) data acquisition
In each individual scanning session 266 volumes were acquired from a 1.5-T GE Signa scanner. A gradient echo planar imaging (EPI) sequence depicting the blood oxygenation level-dependent (BOLD) contrast was used. Each volume contained 16 axial planes acquired with the following parameters: repetition time = 2000 ms, echo time = 20 ms, flip angle = 70°, section thickness = 7 mm, section skip = 0.7 mm, in-plane resolution = 3 × 3 mm. The first 10 volumes were discarded to avoid T1 saturation effects.
Analysis of fMRI activations and deactivations
fMRI image analyses were performed with the feat module included in FSL software (Smith et al. Reference Smith, Jenkinson, Woolrich, Beckmann, Behrens, Johansen-Berg, Bannister, De Luca, Drobnjak, Flitney, Niazy, Saunders, Vickers, Zhang, De Stefano, Brady and Matthews2004). At a first level, images were corrected for movement and then co-registered to a common stereotaxic space [Montreal Neurological Institute (MNI) template]. To minimize unwanted movement-related effects, individuals with an estimated maximum absolute movement >3.0 mm or an average absolute movement >0.3 mm were excluded from the study.
The signal:noise ratio (SNR) was computed for individual functional scans across the three groups according to the definition that models SNR based on the mean signal of the fMRI time series and the standard deviation of the noise in the time series (Welvaert & Rosseel, Reference Welvaert and Rosseel2013).
General linear models were fitted to generate individual activation maps for the 1-back v. baseline and 2-back v. baseline contrasts. We also carried out a supplementary analysis examining the effect of increasing working memory load on group differences. To do this we fitted models that assume a linear relationship through the baseline, 1-back and 2-back levels of the task, reporting significant differences on regression slopes between the relatives, patients and controls.
Group analysis
Individual activation maps for baseline v. 1-back and baseline v. 2-back contrasts were used as inputs for the group analysis. Since each patient was sampled together with his/her sibling, creating covariation between pairs, a simple one-way analysis of variance (ANOVA) was not appropriate, and this lack of independence between subjects had to be modelled through a repeated-measures ANOVA. Each set of patient–relative–matched pair of controls was considered as a unit in the repeated-measures design, and an F test was performed to highlight any statistical differences between groups. This F test was carried out with the FEAT module at the cluster level with a p value of 0.05 corrected for multiple comparisons across space using Gaussian random field methods. The default threshold of Z = 2.3 was used to define the initial set of candidate clusters.
Any clusters showing significant differences among the groups in the ANOVA were used as regions of interest (ROIs) to perform pair-wise comparisons.
Results
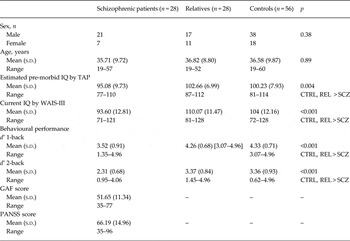
Demographic data on the patients, relatives and controls are shown in Table 1. The groups were matched for age and sex. There was a significant group effect for TAP-estimated IQ; this was due to a significant difference between the patients with schizophrenia and the other two groups. Therefore, TAP score was entered as a covariate in all analyses. As expected, the patients had a significantly lower current IQ than both the relatives and the healthy controls.
Demographic characteristics of the patients (n = 28), healthy relatives (n = 28) and controls (n = 56)

s.d., Standard deviation; IQ, intelligence quotient; TAP, Word Accentuation Test (Test de Acentuación de Palabras); CTRL, controls; REL, relatives; SCZ, schizophrenic patients; WAIS-III, Wechsler Adult Intelligence Scale III; d′, d-prime; GAF, Global Assessment of Functioning; PANSS, Positive and Negative Syndrome Scale.
There was little evidence of co-morbidity in the schizophrenic patients. One had experienced depressive symptoms over a period of months but these did not amount to a diagnosable major affective syndrome. No patients had a recorded history of depression, anxiety or obsessive–compulsive disorder prior to the onset of schizophrenia. Similarly, no patients had received other Axis I diagnoses such as attention-deficit/hyperactivity disorder (ADHD), post-traumatic stress disorder or autistic spectrum disorder, prior to or concurrently with their index diagnosis of schizophrenia.
Behavioural performance
The three groups’ d′ scores are shown in Table 1. There was a main effect of group on performance in both the 1-back and 2-back versions of the task (F = 11.36 and F = 16.17, respectively, both p < 0.01). This was due to the schizophrenic patients performing more poorly than the controls on the 1-back (t = −4.48, p < 0.001) and the 2-back (t = −5.03, p < 0.001) versions of the task. They also performed more poorly than the relatives on both versions of the task (1-back: t = −3.66, p = 0.01; 2-back: t = −5.90, p < 0.001). There were no significant differences between the relatives and the healthy controls on either version of the task (1-back: t = −0.43, p = 0.66; 2-back: t = −0.07, p = 0.94).
fMRI findings
Average values for SNR did not differ significantly among the three groups (schizophrenic patients 5.51, s.d. = 1.88; relatives 5.73, s.d. = 1.97; healthy controls 5.88, s.d. = 1.51; p = 0.62).
Activations and deactivations were generally more marked in the 2-back v. baseline than in the 1-back v. baseline contrast. To avoid redundancy, therefore, in what follows the focus is on the former contrast (the supplementary working memory load analysis takes into account performance during the 1-back task).
Within-group activations and deactivations
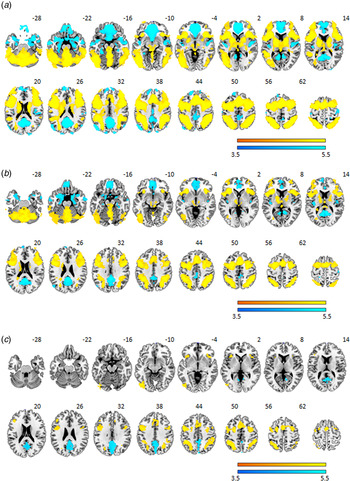
The findings are shown in Fig. 1. The healthy subjects and the relatives both showed activation in predominantly lateral frontal regions. This included clusters in the precentral gyrus bilaterally, which extended anteriorly to reach both the left and right DLPFC and the supplementary motor area. These clusters also included the frontal operculum and the anterior insula bilaterally. Other clusters of activation were seen in the basal ganglia and thalamus, the cerebellum, and bilaterally in regions of the temporal, occipital and parietal cortex.
Brain regions showing a significant effect in the 2-back v. baseline contrast in (a) controls, (b) healthy first-degree relatives and (c) schizophrenic patients. Yellow indicates a positive association (activation) with the task. Blue indicates areas where the task led to a decrease in the blood oxygenation level-dependent response (deactivation). Numbers refer to Montreal Neurological Institute z coordinates of the slice shown. The right side of each image represents the right side of the brain. Colour bars indicate Z scores from the group-level analysis. (For clarity, the results for this figure are thresholded at Z = 3.5.)

The healthy subjects and the relatives also showed task-related deactivations in the medial frontal cortex and the posterior cingulate cortex/precuneus. Deactivation was additionally seen in the temporal poles bilaterally, extending to the amygdala, parahippocampal gyrus and marginally to the hippocampus. These latter clusters also involved the middle temporal cortex/posterior insula, the left angular gyrus and the pre/post-central cortex.
Activations in the schizophrenic patients were generally less marked. Regions included the DLPFC bilaterally, the anterior insula bilaterally and neighbouring regions of the frontal operculum, the precentral gyrus and the supplementary motor area. Activation was also seen in the left temporal cortex and the occipital cortex. Unlike the controls and the relatives, no activation was seen in the basal ganglia or thalamus. The patients showed deactivation only in the posterior cingulate cortex/precuneus and not in the medial frontal cortex.
Between-group differences
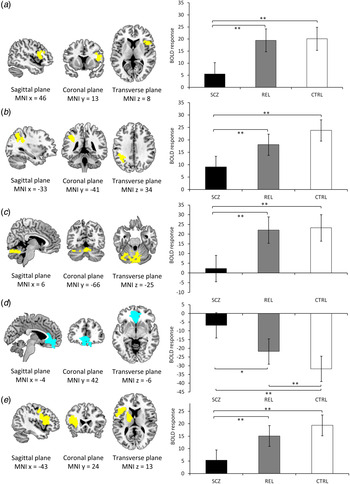
Results of the ANOVA comparing the three groups are shown in Fig. 2. Five clusters of significant difference were found. One cluster was in the right lateral prefrontal cortex, including the DLPFC and extending to the right insula (cluster size 868, peak activation at MNI coordinates 44, 16, 12, Z max = 3.51, p = 0.03). The second cluster included regions of the parietal lobe extending from the left angular gyrus to the left supramarginal gyrus and the left inferior parietal cortex (cluster size 875, peak activation at MNI coordinates −36, −44, 32, Z max = 4.20, p = 0.03). A third cluster was seen in the cerebellum bilaterally extending to the vermis (cluster size 1015 voxels, peak activation at MNI coordinates 8, −80, −22, Z max = 4.27, p = 0.01). The fourth cluster centred on the medial and inferior frontal cortex bilaterally, also including portions of the orbitofrontal cortex (cluster size 1858 voxels, peak activation at MNI coordinates 0, 40, −42, Z max = 5.02, p = 0.0003). Finally, there was a cluster in the left caudate and putamen and thalamus that extended to the left lateral prefrontal cortex, including the left DLPFC, and to left insula, the precentral gyrus and supplementary motor area (cluster size 4408 voxels, peak activation at MNI coordinates −18, −8, 16, Z max = 4.91, p = 0.001).
Location of the clusters and blood oxygenation level-dependent (BOLD) response in schizophrenic patients (SCZ, n = 28), their first-degree healthy relatives (REL, n = 28) and healthy controls (CTRL, n = 56): (a) the right dorsolateral activation, (b) left parietal cortex activation, (c) bilateral cerebellum activation, (d) caudate gyrus, globus pallidus, putamen and left dorsolateral activation, (d) anterior cingulate deactivation and (e) left dorsolateral activation. The right side of each image represents the right side of the brain. Results are thresholded at Z = 2.3. MNI, Montreal Neurological Institute. * p < 0.05, ** p < 0.01. A colour version of this figure is available at http://journals.cambridge.org/psm

Analysis by working memory load
This revealed four clusters of significant difference, which were broadly of approximately the same size as and in similar locations to those in the 2-back v. baseline contrast. However, in this analysis the previously found cluster in the right DLPFC/insula was no longer evident. These four clusters were located in the left parietal cortex (cluster size 952 voxels, peak activation at MNI coordinates −36, −58, 48, Z max = 4.43, p = 0.02), the bilateral cerebellum (cluster size 1002 voxels, peak activation at MNI coordinates 8, −80, 22, Z max = 4.32, p = 0.01), the anterior cingulate cortex (cluster size 2529 voxels, peak activation at MNI coordinates −2, 38, −6, Z max = 4.72, p = 0.00002) and the left caudate nucleus, globus pallidus and putamen, and the left DLPFC (cluster size 4575 voxels, peak activation at MNI coordinates −18, −8, 16, Z max = 5.12, p = 0.00000001).
Pair-wise comparisons within ROIs
Mean activation values for each of the five clusters in the 2-back v. baseline contrast were extracted and the groups were compared using either paired (patient v. relative comparisons) or unpaired (patient v. control and relative v. control comparisons) t tests; once again TAP-estimated pre-morbid IQ was entered as a covariate. Since there were 15 individual comparisons, the statistical threshold was corrected for using false discovery rate (FDR; Benjamini & Yekutieli, Reference Benjamini and Yekutieli2001).
The findings from this analysis are also shown in Fig. 2, and further details are given in online Supplementary Table S1. Cluster 1 (right DLPFC/insula), cluster 2 (left parietal cortex), cluster 3 (bilateral cerebellum) and cluster 5 (left DLPFC, insula and basal ganglia), were all regions where the controls showed activation compared with baseline. In all of these clusters the patients showed significantly reduced activation compared with both the controls and the relatives, but the relatives and controls did not differ significantly from each other.
In cluster 4, the healthy controls showed deactivation from baseline. The schizophrenic patients showed significantly less deactivation than the healthy controls in this cluster. Here, unlike in the other four clusters the relatives also showed significant failure of deactivation compared with the controls. Their degree of failure of deactivation was also significantly less marked than in the schizophrenic patients.
Relationship to clinical features
In the relatives there were no correlations between RISC scores and mean activation/deactivation values in any the five ROIs (cluster 1: Spearman r = 0.01, FDR corrected p = 0.92; cluster 2: Spearman r = 0.03, FDR corrected p = 0.87; cluster 3: Spearman r = 0.05, FDR corrected p = 0.78; cluster 4: Spearman r = −0.34, FDR corrected p = 0.07; cluster 5: Spearman r = −0.11, FDR corrected p = 0.57).
To examine whether activations/deactivations in these five clusters were associated with the presence of psychotic-like experiences, the relatives were dichotomized into 17 who gave no positive responses to any of the delusion-like or hallucination-like items, and 10 who gave one or more positive or questionable ratings. There were no significant differences in mean activation/deactivation values between those with negative and positive ratings for these experiences for any cluster (cluster 1: 20.98, s.d. = 10.53 v. 17.15, s.d. = 11.02, t = 0.89, FDR corrected p = 0.47; cluster 2: 19.02, s.d. = 10.30 v. 17.40, s.d. = 10.04, t = 0.39, FDR corrected p = 0.69; cluster 3: 25.54, s.d. = 14.97 v. 19.09, s.d. = 15.01, t = 1.08, FDR corrected p = 0.47; cluster 4: −15.52, s.d. = 13.45 v. −24.32, s.d. = 13.50, t = 1.64, FDR corrected p = 0.47; cluster 5:16.41, s.d. = 6.01 v. 13.46, s.d. = 5.75, t = 1.25, FDR corrected p = 0.47; the first-reported values are for relatives without experiences).
In the patients, there were no significant correlations between PANSS total or positive, negative and disorganization syndrome scores and mean activation/deactivation values in any of the above five clusters after FDR correction (see online Supplementary Table S2).
There were no significant correlations between n-back test performance, as measured using d′ and activation/deactivation in any of the five clusters in the controls, relatives or schizophrenic patients (see online Supplementary Table S3).
Discussion
In this study, a group of non-affected siblings of patients with schizophrenia did not show functional imaging changes in the prefrontal cortex – although the DLPFC was an area of significantly reduced activation in the schizophrenic patients, this did not separate the relatives from the controls. They did, however, show failure of deactivation in the medial frontal cortex, a finding that implies default mode network dysfunction. This failure was significantly less marked than in the patients with schizophrenia.
The absence of activation changes in the relatives in our study appears at first sight to be at variance with the conclusions drawn in the review of MacDonald et al. (Reference MacDonald, Thermenos, Barch and Seidman2009), where evidence of altered DLPFC function was found in over two-thirds of 20 studies and changes were also frequently seen in the ventrolateral prefrontal cortex. However, in this review the directionality of the changes was not consistent; in fact, in all of the four cognitive domains the authors examined (cognitive control, working memory, memory and language) the studies were approximately evenly divided between those finding decreased activation, those finding increased activation and those finding no change. One interpretation of this pattern of results is that it simply reflects scattering around a true finding of no change; however, meta-analysis of these and later studies (Meda et al. Reference Meda, Bhattarai, Morris, Astur, Calhoun, Mathalon, Kiehl and Pearlson2008; Karch et al. Reference Karch, Leicht, Giegling, Lutz, Kunz, Buselmeier, Hey, Sporl, Jager, Meindl, Pogarell, Moller, Hegerl, Rujescu and Mulert2009; Whitfield-Gabrieli et al. Reference Whitfield-Gabrieli, Thermenos, Milanovic, Tsuang, Faraone, McCarley, Shenton, Green, Nieto-Castanon, LaViolette, Wojcik, Gabrieli and Seidman2009; Woodward et al. Reference Woodward, Waldie, Rogers, Tibbo, Seres and Purdon2009; Sepede et al. Reference Sepede, Ferretti, Perrucci, Gambi, Di Donato, Nuccetelli, Del Gratta, Tartaro, Salerno, Ferro and Romani2010; Choi et al. Reference Choi, Park, Jung, Jang, Kang, Jung, Han, Choi, Hong and Kwon2012; Sambataro et al. Reference Sambataro, Mattay, Thurin, Safrin, Rasetti, Blasi, Callicott and Weinberger2013; Liddle et al. Reference Liddle, Bates, Das, White, Groom, Jansen, Jackson, Hollis and Liddle2013; Stolz et al. Reference Stolz, Pancholi, Goradia, Paul, Keshavan, Nimgaonkar and Prasad2012) would be necessary to establish this with certainty.
In contrast, the relatives showed significant failure of deactivation in the medial frontal cortex compared with the healthy controls. This finding replicates that of Whitfield-Gabrieli et al. (Reference Whitfield-Gabrieli, Thermenos, Milanovic, Tsuang, Faraone, McCarley, Shenton, Green, Nieto-Castanon, LaViolette, Wojcik, Gabrieli and Seidman2009), and also extends it, since they found the failure of deactivation to be not statistically distinguishable from that seen in schizophrenia, whereas we found it to be intermediate between the levels seen in patients and healthy controls. As noted in the introduction, Liddle et al. (Reference Liddle, Bates, Das, White, Groom, Jansen, Jackson, Hollis and Liddle2013) also found failure of deactivation not only in the medial frontal cortex but also in the precuneus; however, as in the study of Whitfield-Gabrieli et al. (Reference Whitfield-Gabrieli, Thermenos, Milanovic, Tsuang, Faraone, McCarley, Shenton, Green, Nieto-Castanon, LaViolette, Wojcik, Gabrieli and Seidman2009), this was similar in degree to that seen in schizophrenic patients.
We did not replicate the finding of Whitfield-Gabrieli (Reference Whitfield-Gabrieli, Thermenos, Milanovic, Tsuang, Faraone, McCarley, Shenton, Green, Nieto-Castanon, LaViolette, Wojcik, Gabrieli and Seidman2009) that medial frontal failure of deactivation was correlated with the presence of schizophrenia-related symptomatology in relatives. In our study there was no association between the relatives’ mean deactivation values in this region and measures of either schizotypy or psychotic-like experiences. It may be relevant here that the rating scale that Whitfield-Gabrieli et al. (Reference Whitfield-Gabrieli, Thermenos, Milanovic, Tsuang, Faraone, McCarley, Shenton, Green, Nieto-Castanon, LaViolette, Wojcik, Gabrieli and Seidman2009) used, the Hopkins Symptom Checklist Revised (SCL-90-R) (Derogatis, Reference Derogatis1983), is a general measure of psychiatric symptomatology and does not actually include items related to psychotic-like experiences.
If it is not associated with symptomatic features, could medial frontal failure of deactivation be related to another proposed endophenotype for schizophrenia, cognitive impairment? As reviewed by Anticevic et al. (Reference Anticevic, Cole, Murray, Corlett, Wang and Krystal2012), there is clear evidence that default mode network activity varies with cognitive function in healthy subjects, with, for example, increased activity being associated with lapses of attention during task performance and reduced activity being associated with better performance. In our study, however, there was no correlation between deactivation in the relatives and performance on the n-back task. Nor do the findings of Liddle et al. (Reference Liddle, Bates, Das, White, Groom, Jansen, Jackson, Hollis and Liddle2013) provide much support for this idea – they found that failure of deactivation was present in relatives of schizophrenic patients despite the fact that they showed normal performance on the task used.
It should be noted that that even in schizophrenia itself whether there is a relationship between failure of deactivation and cognitive impairment is a vexed question. Whitfield-Gabrieli et al. (Reference Whitfield-Gabrieli, Thermenos, Milanovic, Tsuang, Faraone, McCarley, Shenton, Green, Nieto-Castanon, LaViolette, Wojcik, Gabrieli and Seidman2009) found that medial frontal failure of deactivation in schizophrenic patients continued to be evident after differences in n-back performance from controls were controlled for. Pomarol-Clotet et al. (Reference Pomarol-Clotet, Salvador, Sarro, Gomar, Vila, Martinez, Guerrero, Ortiz-Gil, Sans-Sansa, Capdevila, Cebamanos and McKenna2008) had similar findings, but they noted that the size of the cluster of failure of deactivation became smaller after n-back performance was introduced as a covariate. In the only other relevant study to date, Anticevic et al. (Reference Anticevic, Repovs and Barch2013) examined schizophrenic patients and controls during performance on the Sternberg task, using a strategy whereby task difficulty was adjusted so that all subjects performed at a level of about 80% correct. With performance balanced in this way, whole-brain analysis revealed no deactivation differences between schizophrenic patients and healthy controls in the territory of the default mode network, but the patients did show failure of deactivation in a region outside this, the right superior lateral frontal cortex. A subsequent masked analysis (based on regions showing meta-analytic evidence of involvement in working memory in healthy subjects) found failure of deactivation in the right parietal cortex similar in location to the parietal component of the default mode network. All these studies, it should be noted, only examined the default mode network function in relation to performance on the task used during scanning. This is at best a proxy measure for cognitive impairment in schizophrenia, and examination of the relationship of failure of deactivation to more orthodox measures of cognitive function is something that would clearly be desirable in future studies.
As noted in the Introduction, resting-state connectivity represents a complementary way of examining the function of the default mode network, and a small number of such studies have been carried out in the relatives of schizophrenic patients. Currently, their findings are inconclusive: Whitfield-Gabrieli et al. (Reference Whitfield-Gabrieli, Thermenos, Milanovic, Tsuang, Faraone, McCarley, Shenton, Green, Nieto-Castanon, LaViolette, Wojcik, Gabrieli and Seidman2009) and van Buuren et al. (Reference van Buuren, Vink and Kahn2012) found that relatives showed increased resting-state connectivity between the medial frontal cortex and other regions within the default mode network. Liu et al. (Reference Liu, Kaneko, Ouyang, Li, Hao, Chen, Jiang, Zhou and Liu2012) also found increased connectivity, although this time between the posterior cingulate cortex/precuneus and the bilateral inferior temporal gyri. On the other hand, Jang et al. (Reference Jang, Jung, Choi, Choi, Kang, Shin, Hong and Kwon2011) found significantly reduced connectivity within multiple regions of the default mode network in individuals who had two relatives with schizophrenia. Two further studies (Repovs et al. Reference Repovs, Csernansky and Barch2011; Meda et al. Reference Meda, Gill, Stevens, Lorenzoni, Glahn, Calhoun, Sweeney, Tamminga, Keshavan, Thaker and Pearlson2012) found no differences in default mode network connectivity between siblings and controls.
Conclusion
This study adds to existing evidence that failure of deactivation in the medial frontal cortex characterizes not only schizophrenia but also the first-degree relatives of schizophrenic patients. The dysfunction appeared to be present to a lesser degree in this latter group, something that would be expected if it were a trait marker or endophenotype for the disorder. However, caution needs to be exercised before coming to such a conclusion. In the first place, the failure seems from our study to be clinically ‘silent’ – we did not find associations with either schizotypy or psychosis-like experiences, or with cognitive impairment, in so far as this was indexed by poor n-back task performance. Second, failure of deactivation in the default mode network is not specific to schizophrenia, having also been found in all forms of major affective disorder (Sheline et al. Reference Sheline, Barch, Price, Rundle, Vaishnavi, Snyder, Mintun, Wang, Coalson and Raichle2009; Allin et al. Reference Allin, Marshall, Schulze, Walshe, Hall, Picchioni, Murray and McDonald2010; Pomarol-Clotet et al. Reference Pomarol-Clotet, Moro, Sarro, Goikolea, Vieta, Amann, Fernandez-Corcuera, Sans-Sansa, Monte, Capdevila, McKenna and Salvador2012), as well as in other psychiatric and disorders such as ADHD (Broyd et al. Reference Broyd, Demanuele, Debener, Helps, James and Sonuga-Barke2009) and autistic spectrum disorder (Kennedy et al. Reference Kennedy, Redcay and Courchesne2006; Spencer et al. Reference Spencer, Chura, Holt, Suckling, Calder, Bullmore and Baron-Cohen2012). The integrity of the network is also compromised in cognitive disorders such as mild cognitive impairment and normal ageing (Buckner et al. Reference Buckner, Andrews-Hanna and Schacter2008; Broyd et al. Reference Broyd, Demanuele, Debener, Helps, James and Sonuga-Barke2009; Dennis & Thompson, Reference Dennis and Thompson2014).
Supplementary material
For supplementary material accompanying this paper visit http://dx.doi.org/10.1017/S0033291714002426
Acknowledgements
This work was supported by: (i) the Centro de Investigación Biomédica en Red de Salud Mental (CIBERSAM); (ii) several grants from the Instituto de Salud Carlos III [Miguel Servet Research Contract to R.S. (CP07/00048) and to E.P.-C. (CP10/00596); Intensification grant to S.S. (10/231)]; and (iii) the Comissionat per a Universitats i Recerca del DIUE from the Catalonian Government (grant 2009SGR211).
Declaration of Interest
None.