Recent work on the European interest system has seen a number of calls for a more consistent theoretical approach that is at the same time uniquely European, and that entails the use of large-N studies to accompany the rather patchy results of the qualitative research the field has produced to date.Footnote 1 Similar research questions arise in respect of both the US and the European interest systems, suggesting that comparative research may be beneficial. Yet, three distinct assessments of the potential value of such a comparative approach are evident in the literature. First, Mahoney has directly compared lobbying of the US federal government to that of the European Union on a number of issues, including, among others, the mobilization and lobbying tactics employed by interest organizations, the membership of coalitions and the success of lobbying.Footnote 2 Secondly, and in contrast, Coen advocates development of new theoretical approaches that are distinctive to the EU interest system, arguing that the ‘wholesale exportation and replication of US models’ is dangerous without careful evaluation of the distinctiveness of the EU public policy process and institutions.Footnote 3 And finally, Lowery, Poppelaars and Berkhout advocate a middle ground, allowing for cautious comparative work within what they term the stages of the ‘influence production process’, segmenting the research field into four distinct categories (mobilization and maintenance; interest organization populations; influence tactics and policy outcomes) and being highly attentive to their linkages in different political systems.Footnote 4
We believe that the latter position – cautious comparison – is the most appropriate and potentially valuable. It is appropriate because, as noted by Lowery, Poppelaars and Berkhout, there are marked differences in the institutional structures of political systems that inevitably have significant ramifications for the manner in which interests are represented and how interested parties behave when they seek policy influence.Footnote 5 Failure to be attentive to these differences by seeking too general a theory may achieve comparability only through an unacceptable degree of theoretical vagueness, or what Sartori called the ‘travelling problem’.Footnote 6 Thus, whether we can develop comparative theories of interest representation remains at least in part an empirical question of whether we can find and then test general theories that provide insight rather than vacuity. At the same time, however, there would seem to be at least potentially significant advantages in developing and testing such theories. That is, as currently framed, many theories of interest group politics, whether applied to the European Union, to European national political systems or to the United States, are often framed so narrowly in terms of their own institutional settings that they simply do not speak to each other. Indeed, in one of the few textbooks devoted to the topic of comparative interest group research, Pijnenburg and Thomas’s Comparative Interest Group Studies, the essays are not really comparative at all, but consist of a serial examination of separate cases.Footnote 7 This characterization of the literature on interest representation seems more than fair when it is contrasted to comparative research on other topics such as political parties, public opinion and, most recently, policy agendas,Footnote 8 subfields of the discipline that have gained immeasurably in terms of theoretical breadth and substantive reach through truly comparative research. Given these manifest advantages, it would seem odd to abjure their potential on a priori grounds based on the ‘uniqueness’ of any given political system.
We examine one such research question that is common to both cases: interest system density or the number of organizations representing interests before government. The density of interest communities is important for a number of reasons. Perhaps the substantively most immediate of these reasons is the claim that political systems are increasingly overwhelmed by interests, such that ‘lobbyism’ threatens either political gridlock or, even worse, the wholesale looting of public policy by ever larger hordes of self-interested claimants.Footnote 9 These fears have some theoretical foundation in the self-regulating features of interest communities, although this work is restricted to the case of the United States.Footnote 10 Indeed, historically, questions about the density or size of interest communities were assumed to have been answered by Olson, who asserted that interest populations are simply the result of an accumulation of interest organizations resulting from their separate mobilizing events;Footnote 11 once interest organizations have overcome barriers to mobilization (his famous collective action problem), they are assumed to continue in perpetuity.Footnote 12 Thus, the density of interest systems is assumed to be a one-way street of steady accumulation. The assumption of unidirectional growth and its associated threats to representative government is as strongly evident in the limited number of analyses of numbers of EU interest organizationsFootnote 13 as in American works.Footnote 14
More broadly, attention to interest-system density is vitally important for fully understanding many if not most other elements of interest-group politics. Indeed, one of the key findings of recent work on both American and EU interest systems is that the mobilization of individual interest organizations, their interactions with populations of organized interests, their selection of lobbying strategies and the policy consequences arising from those efforts are powerfully connected in complex ways.Footnote 15 In the American case, for example, where more attention has been devoted to interest-system density, it has been shown that the size of the interest community influences the mobilization and survival rates of individual interest organizations,Footnote 16 the potential diversity of or bias found in the interest community,Footnote 17 the use of lobbying strategies and tacticsFootnote 18 and, in at least some cases, their effectiveness in terms of political influence.Footnote 19 In short, a better understanding of the density or size of interest communities is essential if we are to avoid specification error in models of many other aspects of the politics of interest representation.
There are good reasons to expect that both of these reasons are equally applicable to the EU as to the American case. But there is a third reason for examining the EU. Simply put and, as will be more fully discussed in the first section of this article, there is as yet, for a variety of reasons, remarkably little research available on the density of the EU interest community. To address these issues, we examine whether the Energy-Stability-Area (ESA) model of interest system density developed by Gray and Lowery in the US context can be used to understand the density of the EU interest system.Footnote 20 Our reasons for starting comparative work from the base of a model derived from the US are also outlined in the first section of the article. We necessarily, of course, modify both model and measures in order to account for the unique features of the EU policy process. Thus, we theoretically examine the issue of interest-system density in the first section of the article, looking first at relevant European research, secondly at how the ESA model is applied in the US and, lastly, how the model needs to be modified for the analysis of the EU case. The second section of the article tests the model with ordinary least squares (OLS) regression using data on the density of different types or sectors of organized interests in the EU. We return in the conclusion to the question of the viability of inter-system transfers of models and theories about the politics of interest representation.
Interest-system density
The Problem of Studying Density in the EU
The European literature largely focuses on why specific and diffuse interests become active in the EU institutions,Footnote 21 and on lobbying tactics and methods of influence.Footnote 22 With the exception of Broscheid and Coen,Footnote 23 the question of size or density of the EU interest population has been neglected. In large part, this inattention is due to the sheer difficulty of studying density in the EU given the lack of systematic data. Unlike the US federal register of organized interests established by the Lobby Disclosure Act of 1995, the EU lacks anything approaching a complete census of its interest population. The European Commission and the European Parliament, we will see, provide some form of registration data, but these are far from complete or reliable. And as Berkhout and Lowery note,Footnote 24 the many paper and CD-Rom directories of interests pertain only to the year of publication and are not exhaustive.Footnote 25 Thus, simply counting interest organizations in the EU at any point in time is a formidable task.
Even if a valid and reliable census existed for any single year, it is, however, not clear that this would be sufficient to test theories of interest-system density. Since such tests require variations in population density, to date they have typically been conducted with two types of data. First, time series are used to assess the growth of a single subpopulation of interests.Footnote 26 Not surprisingly, given the lack of a valid census of the EU interest population in even one year, there is no valid time series of EU lobby organizations.Footnote 27 Secondly, and more commonly, cross-sectional tests using the fifty American states have been employed, thereby allowing for comparisons within different substantive types of lobby organizations across states.Footnote 28 But the single government of the EU is not easily compared with others.
These problems are not entirely unique to the EU. The lobby community in the US national case, for example, is also difficult to compare with others in a cross-sectional design, and a valid time series of US national lobby registrations only started a decade or so ago. In this case, scholars have opted for comparisons across types or guilds of organized interests (where guilds are defined as similar types of interest organizations, often defined in terms of economic sectors) within a single lobbying community at one point in time.Footnote 29 This assumes, however, that very different types of organized interests – for example, environmental and transport interest groups – are sufficiently similarly responsive to the various factors that shape the contours of the population and can therefore be validly compared within a single theoretical model. In contrast, analyses of the density of the transport interest communities across multiple states or within a single political system over time seem superficially more valid. This research strategy also assumes that it is possible to identify a sufficiently large number of guilds as units of analysis for a robust test of theory.
Among the few to do so, a recent attempt to explain EU interest-population density offers a good illustration of these problems. Broscheid and Coen argue that the European literature lacks a solid theoretical account of the density of the interest population.Footnote 30 But rather than drawing on the American population ecology approach, to be discussed below, their model highlights various features of the policy-making structures of the European Commission as explanatory variables, including the age of policy domains, the number of Directorate-General staff and policy units, and the number of consultative fora. The first problem is that the analysis is heavily Commission-focused, when only a portion of the lobbying community in Brussels is so oriented.Footnote 31 Secondly, because they derived their observations from the total number of policy domains used by the Commission, the statistical power of the analysis is weakened by the scarcity of observations. Thirdly, because policy domains derived from the Commission sometimes attract quite different types of interests, it is not clear whether they reflect meaningful units of analysis in terms of the births and deaths of organized interests – organizations that are sufficiently similar that they compete with each other in the mobilization and maintenance phase in the process of creating influence. Finally, while surely the most comprehensive study on the density of the EU interest population to date, the model is framed so closely to the case under examination that it is not obvious that broader comparison on the fundamental processes governing the density of interest communities is possible. This is emphatically not to suggest that Broscheid and Coen’s model is wrong, only that its very context-specific conceptualization provides a weak basis for employing it as a basis for comparative analysis. Indeed, we will see that several of its key elements can be productively subsumed in the more general theory we offer below. This last point especially is where the more general population ecology model employed here may have something to offer EU scholars.
The ESA Model
As noted above, Lowery and Gray and their colleagues developed a population ecology model of interest population density.Footnote 32 Although it was tested with data on the American states, the theory underlying the model is framed quite generally. In short, they modified the Energy-Stability-Area (ESA) model used by population biologists to study the density and diversity of biological species and applied it to populations of interest organizations. This model is premised on the expectation that environmental constraints ultimately determine the contours of interest populations by bringing selective pressures to bear so that not all interest organizations survive.Footnote 33 Of more immediate importance, the model is framed at a broad conceptual level, something that provides at least potentially a foundation for a broadly comparative model of interest-system density.
The model suggests that three environmental factors determine the carrying capacity of interest systems for numbers of organized interests.Footnote 34 First, the number of potential constituents of an interest is expected to be positively related to the number of organizations that can form and survive; if there are more environmentalists at one time or in one place, there will be more environmental interest organizations. This is the ‘area’ or ‘supply’ term of the model. The second element is how active government is in the interest organization’s field of interest; this was initially measured in the US case by the government goods and services available to potential constituents,Footnote 35 and subsequently by the size of legislative agendas of concern to them.Footnote 36 This is one of the two ‘energy’ terms of the model, and it suggests that when government is active, organizations can more readily mobilize constituents. Thirdly, it is expected that more organizations can form and survive when there is policy uncertainty or likelihood that policy will change.Footnote 37 Such uncertainty also provides ‘energy’ that organizations can use to mobilize.
We think that it is very appropriate to consider whether a variant of the ESA model can be usefully applied to the EU interest system. This is especially so for scholars interested in moving beyond case or sector studies to large-N confirmatory testing of a theory.Footnote 38 Applying the simple ESA model to the US case has proven remarkably productive in generating insights across a range of theoretical issues of concern to interest-group scholars. These include analyses of fluctuations in the number of interest organizations, including how the density of an interest system influences the birth and death rates of organizations;Footnote 39 studies of the life cycle of interest organizations over time, the liability of ‘newness’ for newly mobilized interests, and the condition of density dependence within mature interest communities;Footnote 40 analyses of the diversity of or bias within an interest population that highlight how the density functions of different interest guilds combine some interests to advantage;Footnote 41 and studies of how the structure of interest populations influences both the use of lobbying tacticsFootnote 42 and their impact on public policy.Footnote 43 The ESA model offers a theoretical construct within which to link these important topics.
In contrast, and with the exception of Broscheid and Coen,Footnote 44 studies about EU interest-system density have been more often than not descriptive efforts that rather loosely observe the growth in numbers of interest organizations since the EU was formed, without elaborating at a general theoretical level the sources of such growth.Footnote 45 This does not mean, of course, that these studies were without theoretical interest. Indeed, some cite factors – especially the growth of EU policy competencies as member states have ceded legislative authority to the supranational level – that fit well with the ESA model concept of energy. Thus, various scholars ascribe EU interest-population growth over time to the expansion of EU policy competencies, focusing in particular on the single-market project and the later addition of environmental and social policy.Footnote 46 While certainly useful, these studies more often than not lacked a valid census of the EU interest population, and their theoretical expectations were framed so closely to the case being studied that their comparative import was not obvious.Footnote 47
By seeing how the ESA model can be applied to the EU interest population, we hope to improve on the work of EU interest scholars to date by testing the applicability of a widely accepted American theory in the European context, by providing a large-N study using a more valid census of interest organizations from which stronger inferences can be drawn, and by incorporating additional environmental features associated with the ‘supply’ of interest organizations and the ‘energy’ they use to mobilize and maintain themselves, which have been shown to have an impact on interest-population size, such as the numbers of potential constituents within a given guild and levels of EU legislative activity across guilds. We take heart from Woll’s contention that a comparison between the American and European cases may provide a more useful understanding of the ways in which institutional conditions may determine lobbying activities.Footnote 48 But such comparison rests on translating our theoretical model to a quite different case.
A European ESA Model
While the ESA model was initially conceived by American scholars and tested within the American state interest systems, it is not an ‘American’ theory per se, and its theoretical concepts are quite general. Still, the specific tests of the model contain some uniquely American features, perhaps the most important of which concerns the units of analysis available for testing. That is, the American tests employed cross-sectional analysis of the fifty US states and have only indirectly been applied to the single case of the American national government. As noted above, to investigate interest population density at the federal level, Leech, Baumgartner, La Pira and Semanko opted to compare across interest guilds (organizations addressing common issue areas as defined by economic sectors), which assumed that very different types of organized interests respond similarly to the variables posited by the ESA model.Footnote 49 To assess the validity of this strategy, Gray, Lowery, Fellowes and Anderson have compared tests of ESA models using cross-guild and cross-state data and found that they produce quite similar results.Footnote 50 This suggests that cross-sector or cross-guild models can be used when a cross-system comparison is not possible.
Turning to the theoretical terms of the model, area represents the space or the breadth of the ‘niche’ in which an interest guild (or a biological species) might survive. The model hypothesizes that the relationship between area and density is positive. In biological species, a larger area will support both more individuals and more species. With regard to lobbying, a larger number of potential constituents will support both a larger number of interest organizations and guilds of organizations. In mature interest systems, like mature ecosystems, this relationship is typically curvilinear. As the population grows denser, competition within species (for resources) and between species (for niche space) intensifies and the growth rate of the population slows.Footnote 51
The first part of this area or supply element of the ESA model arguably crosses the Atlantic quite well. Although the corporatist traditions of some European national governmentsFootnote 52 might be expected to make cross-national comparisons difficult by skewing the relationship between the size of potential constituencies and numbers of interest organizations, the single EU is more pluralist in nature.Footnote 53 Still, the curvilinear or density-dependent character of the relationship in the US case may not apply to the EU, given that it is expected to be more typical of mature interest systems, and the EU interest system is youthful in comparison to the US case. Thus, it is plausible that the EU interest community is still in an initial growth phaseFootnote 54 and that density dependence may not yet have set in.Footnote 55 Indeed, this is perhaps the most interesting element of our analysis given the fears that – as reflected in ongoing debates over the adoption of a more rigorous lobby registrations system for the EU – the EU system is becoming overwhelmed by organized interests. If interest populations are self-regulating through density dependence, then this justification for a more rigorous registration system is not valid.Footnote 56 The density-dependent hypothesis is also the element of our model that is most strikingly different from the few existing models of the density of the EU interest system.
Tests of the energy term of the ESA model in the American case entailed two distinct measures tapping the resources useful for entrepreneurs in mobilizing and maintaining interest organizations. The first was a count of bill introductions to state legislatures to measure levels of legislative activity relevant to each guild, since higher degrees of legislative activity would entail higher numbers of interest organizations engaged in responding to and trying to shape the direction of the legislative activity.Footnote 57 The second measure was an index of party competition in each state, which was used to measure policy uncertainty, since higher levels of party competition create more opportunities for sudden policy change and should thereby encourage higher levels of interest organization activity.Footnote 58
The first element of the energy term – levels of legislative activity – is surely relevant to the EU. The making of supranational policy is one of its core institutional activities, and as discussed above, research on EU interest-population growth has shown that the gradually expanding policy brief of the EU has drawn increased numbers of interest organizations to Brussels. However, the precise measurement of government activity is complicated in the EU because it entails the co-ordinated activity of the Council, Parliament and Commission. Next to institutional segmentation, there are procedural differences across policy areas.Footnote 59 Indeed, the task of mapping which venues are involved in which issues is a research task in itself.Footnote 60 Therefore, although the Commission is officially the originator of EU policy making, we cannot reliably measure levels of EU legislative activity by simple reference to the number of proposals introduced in any single institution. The only safe proxy is measuring variations in the step-by-step transit of legislative proposals from one institution to another, for each guild.
The second aspect of the energy term – uncertainty or the likelihood of policy change – is another area in which the US and the EU differ markedly. Mahoney, comparing the US Congress to the legislative process of the EU, notes that most American policy proposals (i.e. bills) do not become law: ‘many die in committee, because they are voted down or not acted upon; still others die on the chamber floor, or are vetoed by the president’.Footnote 61 In fact, bill death is more likely than policy change. In these circumstances, Lowery and Gray chose to use an index of party competition to measure policy uncertainty in their ESA model, since higher levels of party competition create more opportunities for a sudden policy change.Footnote 62 But in contrast to the US, the EU is not a political system dominated by two parties, and its elected parliament does not function as the sole originator of legislation. Policy change in the EU is more typically gradual and incremental, characterized by building up a consensus. Once the EU policy-making process has begun, policy change is highly likely; only a handful of legislative proposals do not make it out of the co-decision process.Footnote 63
It is, therefore, very difficult to measure when a policy ‘starts’ in the EU policy cycle. Further, we can make no recourse to the simple and convenient use of party competition as a comprehensive measure of policy uncertainty. But most authors assume that the starting point is institutionally grounded, in particular, within the various Directorates General of the Commission.Footnote 64 Therefore, conceptualizing the likelihood of policy change in a European ESA model must refer to institutional activity of some form. We have chosen to refer to the open public consultations carried out by the Commission, which indicate to the member states, policy stakeholders and the general public that the Commission is preparing to scrutinize a particular policy.Footnote 65
Finally, one further energy source in our European ESA model reflects the unique institutional apparatus of the EU and its implications for lobbying. The Commission solicits the formal and informal participation of organized interests in its policy-making process, from seats on the Commission’s consultative committees to ad hoc issue coalitions and working parties.Footnote 66 Moreover, the Commission relies on the expert knowledge, technical information and other resources that interest organizations offer with respect to particular policy areas, especially among economic or business interests.Footnote 67 This reliance is commonly linked to the fact that the Commission is under-resourced for the range and size of the policy-making functions that it undertakes.Footnote 68 But whatever its origins, the EU version of the ESA model incorporates a measure of policy participation opportunities, similar to Broscheid and Coen’s institutionalized fora for interest representation.Footnote 69
Testing the ESA model
Data and Measurement
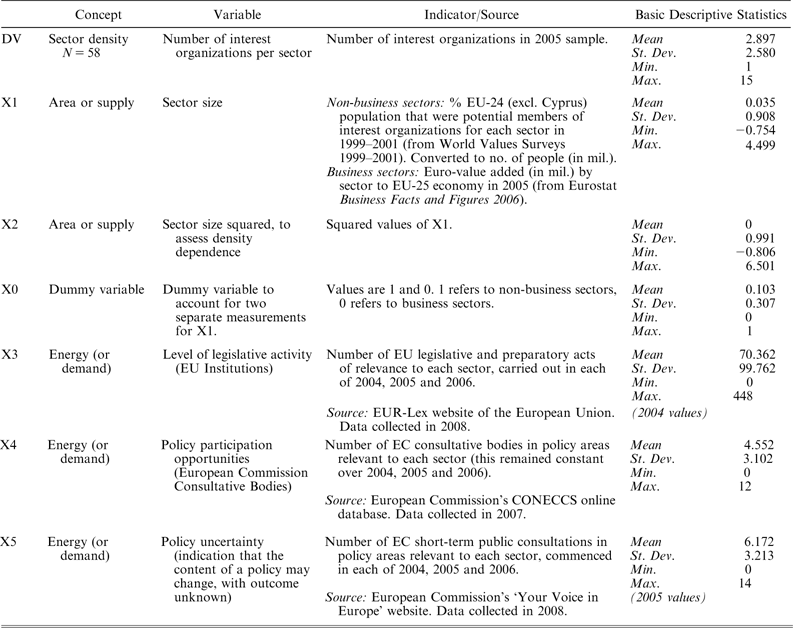
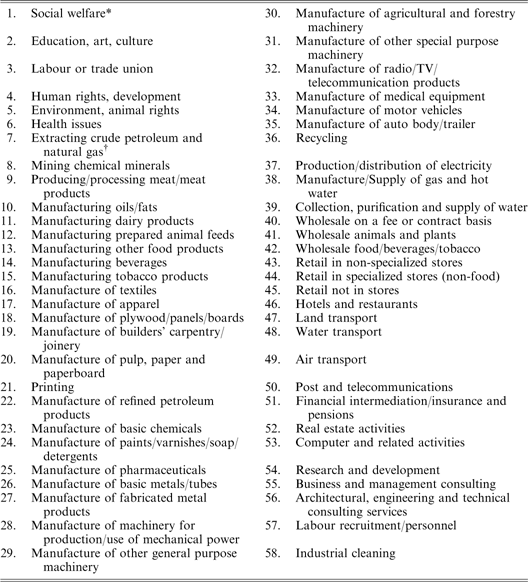
Taking account of the limitations of data on the EU interest population – in having no reliable time-series data, nor a valid cross-system comparison – the unit of analysis in this research is the population of organized interests representing economic and social guilds in EU institutions in 2005. Thus, we rely on Gray, Lowery, Fellowes and Anderson’s finding, noted earlier, that cross-guild and cross-state analyses produce quite similar results.Footnote 70 The dependent variable, as seen in Table 1, is the number of organizations representing each guild (N = 58), which are listed in Appendix Table 1.Footnote 71 The guilds were derived from two sources: for economic guilds, we adopted the economic classification used by Eurostat;Footnote 72 and for social guilds, the World Values Survey 1999–2001 was used, following Wessels and Balme and Chabanet.Footnote 73 This survey classified nine types of voluntary activities in which citizens participate.Footnote 74
Concepts, Variables, Measurement and Sources

Lacking a complete census of the EU interest population, the data on the dependent variable was drawn from a dataset of 168 interest organizations and firms active in one or more EU institutions in 2005, split across fifty-two economic guilds and six social guilds. This dataset was derived from an original random sample of EU interest organizations collected by Berkhout and Lowery.Footnote 75 They took a random sample of organizations listed in online directories and paper directories of interest organizations present at the EU institutions by directory. The dataset in this research relied on the random samples they took from the following directories current in 2005: CONECCS (an online database belonging to the Commission),Footnote 76 the EU Parliament (EP) register (an online database belonging to the Parliament),Footnote 77 Landmarks 2005 (a paper directory), and Euroconfidentiel 2002 (a paper directory published in 2002, coded and checked for currency at the end of 2005). These samples were compiled into a single dataset for 2005, although the calendar year 2005 is not a perfect match for the data, as the Euroconfidentiel data were published in 2002 and subsequently updated by website checks performed in January and February 2006. Landmarks data were published in 2005 (and therefore probably collected in 2004), but were updated by website checks performed in January and February 2006. Thus, all organizations from Landmarks 2005 and Euroconfidentiel 2002 initially had two entries, one for the book information and one for the website check in January/February 2006. The CONECCS and European Parliament (EP) data were collected online in November and December 2005. Organizations chose when and if to update their data on the CONECCS database, so some data may date to earlier than 2005. The EP database is a record of organizations that have obtained a twelve-month lobbyist’s pass, and in which the twelve months start running from the date of the pass.
This 2005 dataset was further refined for the current research, as follows. First, the website and book entries for the Landmarks 2005 and Euroconfidentiel 2002 samples were checked and manually converted into single entries. Organizations that no longer existed and all multiple entries were deleted from the dataset. The remaining organizations were then coded by reference to the NACE Rev 1.1 classification of economic activity (at the second or third tier), for the economic guilds, to enable cross-referencing to the economic sector data published by Eurostat,Footnote 78 and the list of voluntary and membership organizations in the World Values Survey 1999–2001 for social guilds, to enable cross-referencing to the data from that survey. Those organizations that were unable to be coded according to these two classifications were deleted from the dataset.Footnote 79 This generated a total of fifty-two economic guilds and six social guilds. The bias towards economic guilds and the small number of social guilds in our sample seems characteristic of EU interest representation, since it is well-established that the EU interest population is dominated by business interests.Footnote 80
The first set of independent variables concerns the supply or area term of the ESA model. The inclusion of both economic and social organizations in our analysis necessitated the use of a somewhat complex measure. Following tests in the US context, we define guild size for economic organizations as the amount of economic activity in the guild. For each of the fifty-two economic guilds, guild size was measured by the total euro value-added contributed by it to the EU-25 economy in 2005, based on Eurostat economic sector data.
Economic activity is not a plausible measure of size for non-economic or social interest organizations, since individuals provide the basis of organization of such interests. For these organizations, then, we measure ‘area’ as the number of EU citizens showing support for such interests, based on responses to the World Values Survey 1999–2001.Footnote 81 As noted above, to enable cross-referencing to the survey results, the social-interest organizations in the sample were coded according to the survey classification of voluntary organizations. The interest organizations corresponded to six of the nine classifications (or social guilds). Guild size was then measured by the total number of positive responses to the survey questions asking about participation by respondents in voluntary organizations for each guild. The survey was carried out in twenty-four of the twenty-five EU countries under consideration in this research.Footnote 82 The survey results were presented as percentages of the EU-24 population, and these figures were converted to actual numbers of individuals based on Eurostat’s population data for the EU-24 in 2001, to enable comparison to the data for the other terms in our model.Footnote 83
Given these two quite different bases of organization underlying the measure of the area term of the model, the euro value-added and survey results were combined via standardization into a single variable with a common mean of zero and values expressed in units of standard deviation. The standardized index ranged in value from −0.794 to 4.499. This indicator has a number of unfortunate assumptions built into it, most notably that the economic and social interests share a common constant value and that the numbers of organized interests are equally responsive to changes in their respective areas. To address these problems, we include in the models two additional measures. The first is simply a dummy variable with a value of one indicating that the guild was in the social as opposed to economic domain. This controls for the difference in the constants of the two broad types of interest guilds. And secondly, the model includes an interaction of the guild or sector dummy and the area term of the model. This should control for any difference in the relative responsiveness of the number of organized interests across the two guild types to changes in the relative size of the area term of the model. Thus, if the number of organized interests in the social guild is less (or more) responsive to changes in area or size, the interaction terms should generate an estimate that is discernibly different from zero.
We have also hypothesized that the area variable may be density dependent or that the growth of the number of organizations in response to the area term of the model will slow as area becomes larger. We have also noted, however, that the relative youth of the EU may have minimized density dependence up to this point in its history. We test this hypothesis via inclusion of two second-order polynomial or squared measures of guild area – one for the baseline area measure and another for the interaction of area and type of guild. These squared values of the area terms of the model should indicate whether responsiveness (in terms of number of lobby organizations) to area changes as area becomes larger. Thus, in regard to the core area variable, the sign of the estimate for the nominal value should be positive and the sign of the estimate of the squared term should be negative, together indicating density dependence. We have, however, less precise expectations – and hence use two-tailed tests – for the estimates for the interactions of guild type and the nominal and squared values of area, since we have included these measures to control for differences in the responsiveness of the number of lobby organizations in the two quite different sets of interest to the ESA determinants without specifying precisely how they should differ.
The second set of variables concerns the ‘energy’ term of the ESA model. As noted by Gray and Lowery, the energy supporting organized interests is comprised of both the opportunities and/or threats posed by legislative activity and the uncertainty of the outcome of such activity.Footnote 84 As discussed above, unlike the US case, where legislative activity is rather simply measured by bill introductions,Footnote 85 the complex legislative process of the EU is far from transparent. Thus, we examined two distinct indicators of EU activity that might attract organized interests to Brussels.
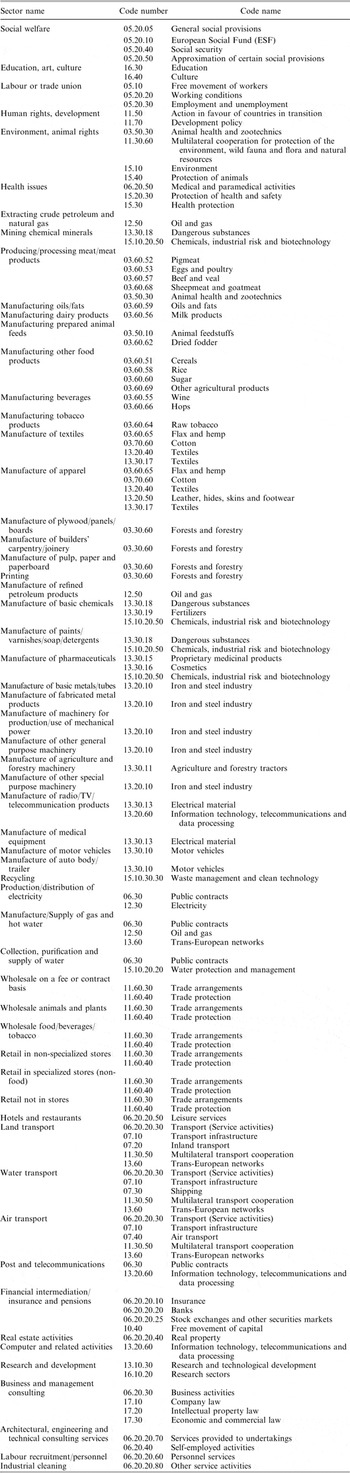
The first is legislative activity, a measure that is most directly comparable to the US measures. The data for measuring the level of legislative activity was collected from EUR-Lex, the online database of EU law maintained by the EU institutions. EUR-Lex contains the Official Journal of the European Union as well as all the treaties, legislation, case law and legislative proposals (called ‘preparatory acts’ in the database). It includes each revised version of a preparatory act as it passes through the law-making process and preparatory acts and legislation that are no longer in force.Footnote 86 To count the legislative activity for each guild, the guild names were matched to the appropriate EUR-Lex classification code(s).Footnote 87 Often, the guild names and the codes were the same or similar. In most cases, one or two codes were matched to each guild; in some cases, however, three or more codes were relevant.Footnote 88 There was some overlap of codes across guilds where guilds shared certain interest areas.Footnote 89 The full list of guilds and their corresponding codes can be seen in Appendix Table 2. Then, the legislative and preparatory acts section of the EUR-Lex database (including those acts no longer in force) was searched according to the classification code(s) that applied to each guild. The total number of legislative and preparatory acts for each code was counted for 2004, 2005 and 2006. In 2004, the highest count of legislative and preparatory acts was 448 and the lowest count was zero; in 2005, the highest count was 441 and the lowest count was zero; in 2006, the highest count was 533, and the lowest count was zero. By counting for each of 2004, 2005 and 2006, we were able to assess whether legislative activity lagged, led or was contemporaneous with the arrival of interest organizations in the EU institutions. This was done for the other energy measures as well, something we will address more fully below.
This measure is not a comprehensive indicator of legislative procedures in the EU. Instead, it taps variations in legislative activity across guilds, so that we can establish whether greater relative legislative activity leads to higher numbers of interest organizations. Therefore, as in tests of the ESA model in the US case,Footnote 90 it is also appropriate that each legislative proposal was counted each time it moved through the EU legislative process. We would expect interest organizations to become more attentive to legislative proposals – and thus be more active – as they move closer to their final versions, since this constitutes a higher level of ‘energy’ or ‘demand’ for lobbying activity.
Given the privileged role of the Commission in developing legislation and the well-known reliance by the Commission on interest organizations for technical advice and expertise, our second indicator of EU activity measured the policy participation opportunities for organized interests at the Commission. This was measured by the number of the Commission’s consultative bodies relevant to each guild in 2005. The consultative bodies of the Commission are permanent bodies that meet several times each year to discuss and monitor Commission policies, and to draft legislation.Footnote 91 These bodies are comprised of Commission officials and interest representatives appointed by the Commission. The consultative bodies did not change over 2004, 2005 and 2006; during this period, there were a total of 134 bodies.Footnote 92 We matched the names of the bodies to the names of the fifty-eight guilds in the sample. Of the 134 bodies, 118 were relevant to this research, and some were relevant to more than one guild.Footnote 93 While this meant that some bodies were counted more than once, it is also an accurate reflection of interest-organization competition for influence in particular policy areas. The total number of bodies was tallied for each guild.Footnote 94
The second element of energy is policy uncertainty. Because of the institutional complexity of the EU, it is difficult to measure when a policy ‘starts’ in EU policy making. To develop a proxy measure of policy uncertainty, we counted the number of open public consultations held by the Commission on policies relevant to the guilds in the sample, in each of 2004, 2005 and 2006. The Treaties of the EU specify that wide consultation is one of the Commission’s duties in preparing legislative proposals, to ensure that proposals are sound. Wide consultation is considered necessary to ‘reduce the risk of the policy-makers just listening to one side of the argument or of particular groups getting privileged access’.Footnote 95 The opening of a public consultation indicates to the public that the Commission is preparing to scrutinize a particular policy area, and a proposed policy change (in the form of a White or Green Paper) is one potential outcome of a consultation.Footnote 96 In this sense, consultations appear to be the natural forerunners to the policy-making cycle.
The Your Voice website of the Commission acts as a clearinghouse for all public consultations the Commission carries out, and the consultations are organized according to thirty-four ‘policy activities’.Footnote 97 Public consultations typically remain open for a couple of months, and the target audience is usually policy stakeholders, member states and/or the general public. Once closed, the results of each consultation are made publicly available on the Your Voice website. We obtained a complete list of Commission public consultations for each year of study from the Your Voice web archives. In 2004, there were 77 consultations; in 2005, there were 72; in 2006, there were 122. The names of the consultations were matched to the names of the fifty-eight interest guilds in the sample, and an additional relevance check was made by reference to the EUR-Lex classification codes that applied to each guild. Like the Consultative Bodies, some public consultations were relevant to more than one guild. The total number of consultations was then tallied for each guild for each year.
We have noted that we examined measures of legislative activity and policy uncertainty for 2004, 2005 and 2006, thereby allowing us to see whether policy activity is contemporaneous with or leads or lags lobbying activity.Footnote 98 The last is particularly important in terms of specifying the model. That is, if policy activity lags lobbying, we may risk introducing endogeneity into the model, since these indicators of demand are proximate to the legislative agenda, and lobbying by organized interests may create policy consultation and legislative activity rather than being responsive to it.Footnote 99 That is, Commission policy activities might be a function of interest-group activity rather than organized interests responding to the Commission, as is now indicated by the specification. In US tests of the ESA models, however, the relationship between interest-system density and energy/demand has been shown to be clearly contemporaneous with state legislative agendas. That is, organized interests respond to agendas, not the reverse.
Is the same true in the case of the EU? While research is limited, Wessels found that the growth of EU interest groups was a reaction to (not anticipation of) the expansion of EU institutions in the 1990s.Footnote 100 But to answer this question better, we examined models with all possible combinations of the 2004, 2005 and 2006 energy variables, although extensive collinearity eventually precluded including measures for several years in our final models.Footnote 101 In the interest of brevity, we do not present all of these models, which, for the most part, produce similar results. The one telling difference among them is that we found no clear evidence that lobbying precedes the 2006 indicators of either legislative activity or public consultations. Rather, although the results were similar to each other in terms of either contemporaneous or lagging effects, the modestly best models included the 2004 or leading value of the number of EU legislative and preparatory acts and the 2005 or contemporaneous measure of the number of public consultations. Still, given the high collinearity between the annual measures, we do not offer any firm conclusions about the precise timing of the impact of the energy variables.
In sum, we hypothesize that, across the guilds we examine, the number of interest organizations lobbying EU institutions will: (1) increase as the potential membership of a guild increases in a linear relationship; (2) display density dependence or curvilinearity as the overall number of organizations grows; (3) increase with the level of EU legislative activity with regard to that guild; (4) increase to the extent that the Commission creates opportunities for interest organizations to participate in EU policy consultation and review forums that are relevant to that guild; and (5) increase when there is evidence of policy uncertainty with regard to guild-relevant policies. These variables and their indicators are summarized in Table 1.
Results
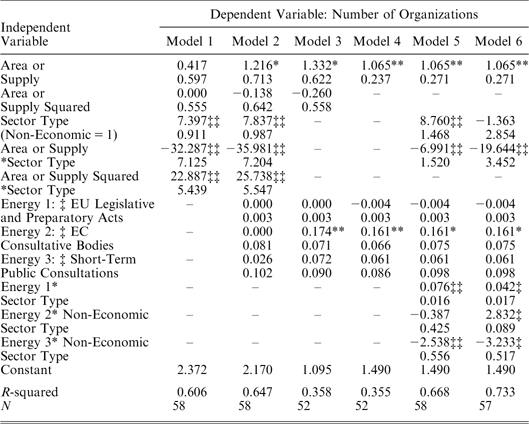
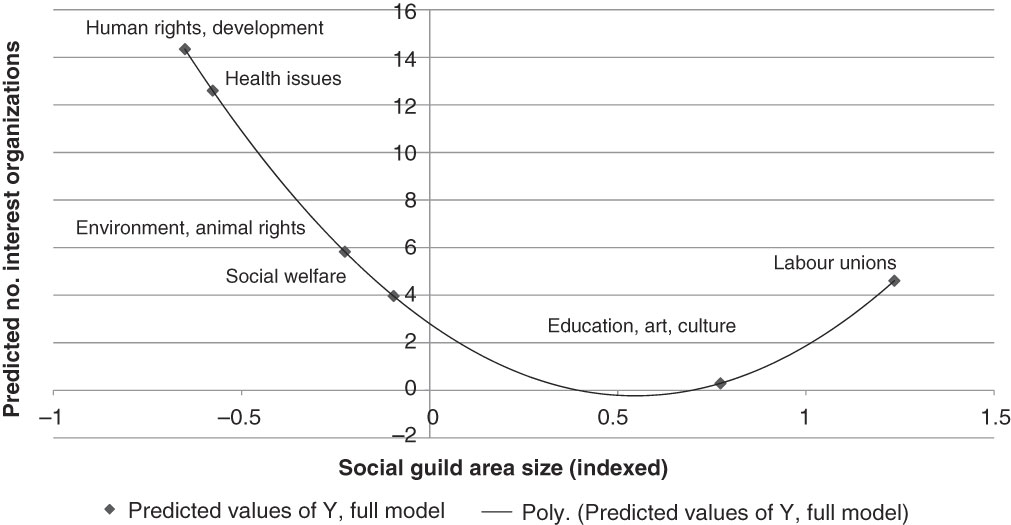
The ordinary least squares (OLS) regression results are presented in Table 2. There was, not surprisingly given that there are few observations for social organizations, considerable collinearity,Footnote 102 making it difficult to estimate the full model. Instead, we present a series of partial models, addressing different aspects of the analysis in turn while looking for consistencies in the results across multiple models. Model 1 includes only the nominal and squared values of the size or supply terms of the model, as well as a dummy for social guild interests and its interaction with the supply variables.Footnote 103 These results were not supportive of our expectations. The first two estimates test the density dependence hypothesis for economic interest guilds. As expected, the first estimate for supply is positive, but its squared value produced an unexpected positive coefficient. However, neither was significant. Even worse, the two significant estimates for the supply variable interactions were wrongly signed. Even more surprising, they are larger in absolute value than the estimates for the general supply variables. This means that as the level of support within the EU for the several types of social-interest guilds rises, the number of lobby organizations actually declines. This is reflected in Figure 1, which presents the predicted values of the indexed number of lobby organizations for the social-based guilds while holding the energy variables at their means. This line reflects both the linear and the squared values of the supply variables and is strongly negative across most of its range, but then rises sharply as public support increases. The estimate of the social guild dummy, although included only as a control for the different baselines of the supply measures for the economic and social guilds, was positive and significant at the 0.01 level. In general, then, the first model provides almost no support for our expectations.
OLS Regression Tests of ESA Model

Figures below coefficient estimates are standard errors. ‡ p < 0.05, ‡‡ p < 0.01, two-tailed test. *p < 0.05, **p < 0.01, one-tailed test.
Predicted numbers of interest organizations by social guild area size (indexed), based on fully specified model

This changes only slightly in Model 2, where we add the three energy variables. The nominal and squared value of the first two supply variables are now signed positively and negatively as expected, and the first is significant at the 0.05 level. The unexpectedly signed and significant estimates for the interaction of the supply variables and the social-guild dummy remain. And, while all of the three energy variables representing legislative activity, consultative bodies and short-term consultations were positively signed as expected, none were discernibly different from 0. Again, with the exception of the nominal supply variable for economic-interest guilds, Model 2 provides little support for our expectations.
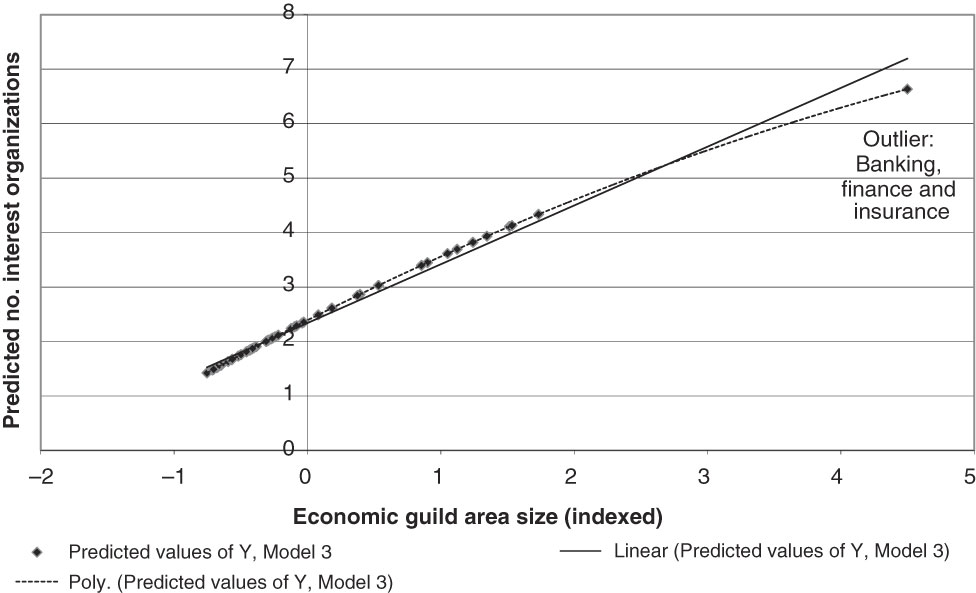
To explore why this was so, we examined several other models. In Models 3 and 4, we exclude the social guilds from the analysis, to see whether these confound our expectations. Model 3 produces some support for the basic model for the fifty-two economic-interest guilds. The nominal supply coefficient is again positive as expected. Economic guilds that are larger in terms of potential membership (as measured by economic activity) produce more lobby organizations. What of density dependence or the expected curvilinear relationship between the supply variables and numbers of lobby organizations? The estimate in the second row of Table 2 is again negative as expected, indicating that the growth of numbers of lobby organizations declines as the level of economic activity increases. However, it is again not discernibly different from 0. This relationship is retained in Model 4, which excludes squared supply, although in this case the nominal supply variables generate a positive estimate that is significant at the 0.01 level. The weakness of the curvilinear relationship is reflected in the dotted line in Figure 2, which reports the predicted values of the number of lobby organizations for the economic guilds from Model 3, holding the energy variables at their means. The darker line identifies a strongly positive linear relationship between supply and the relative number of lobby organizations in a guild. The lack of a discernible difference between the two lines indicates that there is little density dependence. Density dependence is characteristic of mature populations in which there is little room for new organizations to secure a viable niche, so this suggests that the EU interest community has not yet stopped growing and there is still room for new entrants. This is a particularly interesting conclusion for those scholars who argue that interest population growth in the EU ought to be slowing, based on their belief that the groups now present at the EU level ‘embrace virtually every imaginable spectrum of civil society’.Footnote 104
Predicted numbers of interest organizations by economic guild area size (indexed), based on Model 3

We can now turn to the energy variables reflecting legislative activity and policy uncertainty. Focusing only on economic-interest guilds, the estimates in Models 3 and 4 tell the same tale. While five of the six estimates are positive as expected, only two – the two coefficients for the number of consultative bodies – were statistically significant (p < 0.01). It seems, then, that higher levels of legislative activity and short-term consultations do not seem to draw economic-interest organizations to Brussels. However, consistent with the findings of Broscheid and Coen, the numbers of consultative bodies do seem to matter.Footnote 105
In sum, Models 3 and 4 provide modest support for several elements of the ESA model when our attention is focused exclusively on economic-interest guilds. Both supply and demand seem to matter in the expected manner. However, there is little evidence of density dependence, and the only energy variable that seems to matter is the number of consultative bodies. This corroborates prior findings that the Commission’s reliance on organized interests for technical expertise and advice operates as a magnet to Brussels.
Unfortunately, further analysis of the social guilds could not be as straightforward as the initial work, given that the small number of such guilds precluded separate estimation. Instead, Models 5 and 6 estimate models that exclude the second order polynomial terms of the supply variables, so as to reduce collinearity, while including interactions of the guild-type dummy with the three energy variables. Model 6 differs further from Model 5 by excluding the labour or trade union guild from the set of social guilds. As seen in Figure 1, the strongly curvilinear character of the reaction function for the social guilds is heavily influenced by the labour union interest guild. While labour unions share with the other social organizations the characteristic of being firmly rooted in members and they also share economic concerns with firms and trade associations in the other major guilds in our analysis, they are quite different in terms of their industrial rather than post-industrial origins, and they have been institutionalized within the national European political systems. Given these differences, we excluded the labour union guild from Model 6 to see how it influences our results. Still, Models 5 and 6 should be viewed with considerable caution. We have gained statistical power by examining the social guilds in combination with their economic compatriots, but that statistical power is actually still quite limited given the small number of social guilds and the number of interactions between core explanatory variables and the guild-type dummy.
With this important caveat, the initial thing to note is that results for the economic guilds reported for Models 3 and 4 are, of course, retained in Models 5 and 6. The linear supply term in row one and the number of consultative bodies again generate positive and significant estimates for the economic-interest guilds. But the results also suggest that the processes that bring social-interest organizations to Brussels are different from those influencing the density of the economic-interest guilds.
First, the estimate for the supply interaction with the guild dummy is still negative and significant in Models 5 and 6. As public support in the EU rises for social lobby interests, the density of their representation declines. This result runs, of course, against our expectations and demands explanation, albeit retrospective. Two possibilities come to mind, in addition to the simple possibility that variations in public support for these several topics comprising the social guild is a poor measure of actual participation levels and hence the number of organizations engaged in lobbying.Footnote 106 First, many scholars might say that this is an example of Olson’s collective action problem.Footnote 107 We do not find such an interpretation plausible. That is, prior cross-jurisdictional, within-interest guild tests of ESA models have always found strong evidence of a positive relationship between numbers of potential members of an interest guild and the number of actual interest organizations. Thus, when we compare US states with larger numbers of environmentalists, we find a larger number of organizations representing their interests. This would not be true if a collective action problem dominated the mobilization of such organizations.
A more plausible explanation of this unexpected finding lies in our necessary recourse to a cross-guild design instead of the more commonly used time-series or cross-system designs. That is, measures of supply based on numbers of potential supporters across different types of interests may inevitably be contaminated by picking up aspects of the other core concept in ESA models – policy demand. Interpreting our results in this manner rests on how lobbying works in democratic polities. Given democratic elections, public support for policy activity should lead politicians to respond irrespective of active lobbying. Policy activity in less supported areas, in contrast, would require mobilization and lobbying. Simply put, democratic responsiveness would not require interest organizations with strong public support to be as active as groups lacking that support to achieve the same effect. And this is what our results show; there are fewer interest organizations in those social guilds for which there is stronger public support. In contrast, within-guild tests across different jurisdictions, as with tests of the ESA model across US states, would miss this effect.Footnote 108 The bottom line for our purpose is that by using a cross-guild research design, our purported measure of supply may well be picking up levels of policy demand in such a way as to produce confounding results in terms of the ESA model for the social organizations.Footnote 109
The second key difference between the economic-interest and social-guild results, as indicated by the energy-guild type interaction in Models 5 and 6, concerns the sources of policy and political energy motivating each guild. In contrast to the economic guilds, legislative activity generated the expected positive and significant estimates in Models 5 and 6. More social guilds seem to become active in the EU when legislation is being prepared. And when labour or trade unions were excluded in Model 6, the number of consultative bodies also produced a strongly positive (b = 2.832) estimate that was significant at the 0.05 level. Taken together with the results for the estimate for the number of consultative bodies for the economic guilds (b = 0.161), this suggests that the social guilds – sans labour unions – are even more responsive to the number of policy participation opportunities than are the economic guilds. While these bodies are dominated by economic (and in particular business) interests,Footnote 110 this result may indeed reflect the impact of the EU’s expanding policy brief.
Against these positive results, however, the estimates for short-term consultations are unexpectedly negative and significant, indicating that more short-term consultations lead to less density among social groups. When combined with the positive results for legislative activity, this could mean that social groups are simply more involved with new legislation than with the regulatory activity that follows (if, indeed, short-term consultations tend to address implementation). This would be consistent with some prior observations of the differences in participation patterns across these two very different stages of the legislative process in the US.Footnote 111 But it is also plausible that short-term consultations simply occur too early in the policy cycle to signal to interest organizations that it is time to relocate to Brussels – even though they may, from their original locale, cast their eyes more frequently in the direction of EU law-makers. Thus, in using short-term consultations, we may have simply failed to identify an appropriate proxy for the concept of policy uncertainty comparable to the use of levels of party competition in the US case.
Conclusion
Several conclusions are warranted. First, we have strong to moderate support for at least some elements of the ESA model when applied to the emerging interest community in Brussels. The strongest support was found for the linear component of the supply term of the model when applied to economic-interest organizations. Interest guilds with greater levels of economic activity produce more organized interests. And we found some support for the energy term of the model, namely that structured opportunities to participate in policy making (the consultative bodies) do indeed draw interest organizations to Brussels. And, at least for social organizations, legislative activity also seems to bring lobbyists to the EU.
Still, while satisfactory in comparison to – and yet broadly consistent with – the few prior tests of the density of EU lobbying based on cross-guild models,Footnote 112 these results were, in several cases, not as strong as those generated in the US case. First, the failure to find density dependence in the EU interest population may be less a failure of the model than an indication of a real difference in the polities under study. The interest systems of the American state and national governments are mature communities in which density dependence would be expected, whereas the EU interest community will remain in flux for as long as the polity continues to accept new member states and to expand its policy brief. To this point at least, we are prepared to view our failure to replicate this part of the ESA model as a function of real differences between the EU and the US.
More noteworthy perhaps, in terms of a real failure at replication, we were not able to incorporate social organizations into the model in a manner capable of ready interpretation. We were able to offer an interpretation of the unexpected and quite strong findings on the supply term for social organizations based on the peculiarities of relying on a cross-guild rather than a time-series or a cross-jurisdiction design, if only in retrospect. We revised our initial use of public support for social-interest organizations as indicators of supply to an inverse measure of demand in which greater support among the public minimizes the need for interest representation by organized groups. But, however plausible this reinterpretation might be, we cannot confirm or reject it with these data, and Mahoney’s findings on the imbalanced responsiveness of the EU to democratic (as opposed to expert) demands suggest the need for caution in further exploring this explanation.Footnote 113 More importantly for the present purpose, it is not clear how the supply term of the ESA model might be better included in models appropriate for use with social interests within the single government of the EU, for which time-series data are not available. Indeed, several aspects of the EU context might explain our unexpected observations of the social interests. That is, the mechanism that underlies the relation between membership-input, as measured by World Values Survey responses, and an interest being represented in Brussels may be attenuated by the absence of a EU-wide media system, something that is vitally important to social interests,Footnote 114 by the multi-level nature of the institutional system and how this affects the mobilization of social interests or by variations in the strength of domestic resources of these types of interest. Each of these explanations merits further attention, some of which should entail comparisons of the EU interest system with European national interest systems.
Finally, we began this effort as an exercise to sort through several different interpretations of how readily models developed in one context – in this case, for the US – might be applied to the EU. Although the proponents of these different views all recognized the difficulties of doing sound comparative work, their interpretations ranged from quite optimistic to downright pessimistic. Based on the analyses presented here, we believe that cautious optimism is perhaps the most appropriate response. We found, we believe, enough positive support for the ESA model to suggest that it has useful theoretical insights for the study of the EU interest system. At the same time, however, the model was modified in important respects for our analysis. Perhaps most consequentially in terms of empirical results, we had to employ a single-government, cross-interest-guild design. While certainly necessary, this is far from the preferred design for testing ESA models. Our difficulties in including social groups into the analysis result in large part from this design. But even more consequentially in terms of theory, we had to employ quite different measures of the energy terms of the ESA model. Critically, these were more than just proxy indicators for the measures used in the US models. Rather, they were fundamentally different measures because the legislative process and the nature of policy uncertainty are different in the US in comparison with the EU. When we have changed the research design and the measures so fundamentally, and when we have generated somewhat different findings, it is certainly fair to ask how directly comparable the two sets of results really are. Our answer is that they speak to each other only in very broad terms. Interpreting more precisely whether variations in findings result from real differences in the underlying relationships, in the designs and/or in the measures is far more difficult and must be undertaken with considerable caution and a full appreciation of the differences between political systems.
Appendix A
List of Sectors

*The first six sectors are taken from the World Values Survey. See fn. 2 above.
†The names for this and all remaining sectors are taken from NACE Rev 1.1. See fn. 78 above.
Sectors and Corresponding EUR-Lex Classification Codes