


Introduction
The sharp increase in income inequality since the early 1980s has attracted much scholarly attention and resulted in an emerging consensus about the limits of democracy in ensuring broad-sharing of economic growth. This gloomy view stands in contrast to the optimistic assessments of the first three post-WWII decades, nostalgically referred to as the “Golden Age,” “Trente Glorieuses,” and so on. Today, the predominating view is that governments have lost their ability to effectively intervene in the market and redistribute income through taxes and transfers to protect the interests of the majority. This paper is a critical theoretical and empirical assessment of this emerging scholarly consensus, focusing on the past 40 years. We present a theory of inequality and redistribution that builds on classic models of democracy and redistribution, and we employ it as a baseline to evaluate competing hypotheses using a new comprehensive dataset on the distribution of national income across advanced capitalist democracies. The results show that democracy remains a powerful guarantor of shared prosperity, with one notable exception.
The revisionist interpretation of democratic capitalism comes in at least two flavors. One grows out of the public opinion literature and focuses on the link between preferences and policies. Most work in this vein finds that redistributive policies are strongly biased toward the preferences of the rich, even in traditionally egalitarian, European democracies (Bartels Reference Bartels2008; Gilens Reference Gilens2012; for a systematic review of this literature, see Elkjær and Klitgaard Reference Elkjær and Klitgaard2021). Another literature emerges from a macro political economy perspective, which questions the structural capacity of democracies to redistribute. For Streeck (Reference Streeck2016) globalization of capital renders democratic governments impotent to tax and spend without causing capital flight, turning democracy and the demand for redistribution into mostly symbolic politics. Piketty acknowledges that politics matters, but in his influential Reference Piketty2014 book on capitalism in the twentieth century, growing capital mobility reinforces a built-in tendency for capital to accumulate faster than economic growth (r > g in Piketty’s notation). A complementary argument is that the rich can use increasing wealth to pay tax lawyers and accountants to shift income and evade taxes. Rodrik (Reference Rodrik2011) succinctly summarizes these and related arguments as a “trilemma” among (hyper-)globalization, democracy, and redistribution: it is not possible to have all three at the same time.
Yet, there are reasons to be cautious about these claims. First, expressed preferences may be a poor guide to whose interests are pursued in economic policies. Lack of information, or voter misinformation, can create poor correspondence between preferences and policies, but being uninformed about policies does not preclude voting in line with class interests (Elkjær and Iversen Reference Elkjær and Iversen2020). Although voters adopt issue positions that are sometimes fickle and inconsistent, many know enough to vote for a party that represents their interests. Going back to Downs (Reference Downs1957), one of the main functions of political parties is to provide voters with simple informational shortcuts; another is to overcome collective action problems and policy inconsistency through tight internal party organization and discipline (Aldrich Reference Aldrich1995; Rosenbluth and Shapiro Reference Rosenbluth and Shapiro2018). Recent scholarship confirms the role of political parties in forging pro-welfare state electoral coalitions (Gingrich and Häusermann Reference Gingrich and Häusermann2015; Schwander, Manow, and Palier Reference Manow, Palier and Schwander2018).
Second, for all the data brought to bear on the relationship between democracy and inequality—lacking correspondence between preferences and policies, increasing market inequality, top-end wealth concentration, deepening poverty, and higher Ginis—there are surprisingly few comparative studies that directly examine the effect of the democratic state on the interest-realization of different classes. Piketty’s pioneering work on measuring inequality, for example, still leaves uncertainty about the primary claim that capital and the rich have reaped most of the gains of growth. After taking account of destruction of capital and capital taxation, his own results suggest that the rate of net capital accumulation is lower than is the rate of growth (r < g) for the entire period from 1913 to 2012—that is, basically for the period of democracy (Piketty Reference Piketty2014, Figures 10.10 and 10.11). Rodrik (Reference Rodrik2011) and Streeck (Reference Streeck2016) present no data to show that the advanced democratic state has weakened over time, and total government social spending as a share of GDP has increased over the past four decades. Theoretically, Iversen and Soskice (Reference Iversen and Soskice2019) build on arguments in economic geography (e.g., Storper Reference Storper2013) and business schools (e.g., Iammarino and McCann Reference Iammarino and McCann2013) to argue that far from increasing mobility of advanced capital, multinationals are increasingly tied down in geographically rooted knowledge clusters of skilled labor, which gives governments wide scope for taxation and redistribution.
We are left, then, with sweeping new claims about a decline in the capacity and willingness of democratic governments to confront increasing inequality, yet little serious engagement with arguments, some with a long pedigree, that suggest otherwise. The central question for this paper is the responsiveness of the democratic state to the economic interests of different classes in an age of increasing inequality.Footnote 1 The recent release of the World Inequality Database (WID) offers an unprecedented opportunity to confront competing arguments with comprehensive new evidence. In doing so, this paper provides fresh answers to the most pressing questions about the role of the democratic state in redistribution: whose economic interests are best reflected in the flow of state resources, from cash transfers to social insurance to public goods? Is the democratic state less involved in redistribution today than 40 years ago? Are redistributive policies increasingly favoring the economic interests of the rich over the middle and the poor? Is globalization undermining the fiscal capacity of the state?
The rest of the paper is divided into four sections. First, we show that the past four decades have indeed been a period of increasing market inequality. It is on this background that we must understand the contemporary politics of redistribution. Second, building on existing models we present a theoretical framework that encompasses long-standing arguments about the role of the democratic state in redistribution and social insurance. We use this framework to derive a set of baseline predictions about the role of the democratic state in countering the increase in market inequality and safeguarding (or not) the interests of different classes. These predictions represent mostly existing, yet largely forgotten or ignored, arguments about democracy. Third, we test these predictions against recent arguments about the increasing power of capital and the rich. We find that the middle-income quintile in most advanced democracies has largely kept up with the overall growth of the economy and that this is a direct result of a redistributive state. To a degree we did not anticipate, this is also true of the bottom-income quintile. The United States stands out as a major outlier, however, with overall macroeconomic growth exceedingly outpacing low and middle after-tax-and-transfer incomes. We consider violations of theoretical assumptions, notably majority rule and the salience of class, which may explain this puzzle. In the conclusion we also raise concerns about how increasing segmentation of labor markets, lower mobility, and increasing accumulation of wealth, all correlates of pre-fisc inequality, could undermine solidarism.
The Context: Four Decades of Increasing Pretax Income Inequality
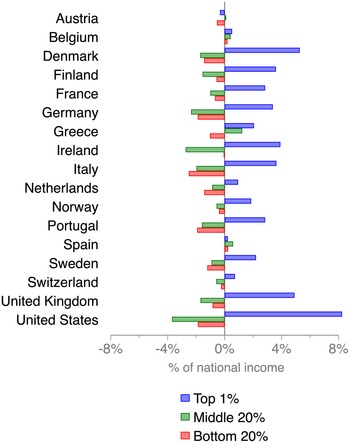
We begin by documenting the increase in pretax income inequality using data from the WID, which we will discuss in detail below. Figure 1 displays changes in the shares of total pretax income received by the bottom 20%, middle 20%, and top 1% from 1980 to 2016 for each of the 17 countries included in our advanced democracy sample. The figure shows that in most countries the top 1% income share has increased markedly: on average by 36%, corresponding to 2.8% of national income. The increase is most pronounced in the US, in which top 1%’s share of income has increased by 80% (equivalent to 8.2% of national income).
Changes in Pretax Income Shares from 1980 to 2016, by Income Group
Note: The years for which change is calculated differ for Austria (2004–2016), Belgium (1991–2016), and Switzerland (1982–2016).

For the bottom 20% and middle 20%, we see roughly mirror images of that of the top 1%. On average, the bottom 20% income share has declined by 19%, which is almost 1% of national income. The middle 20% income share has decreased by 6.6% on average, but from a higher level than that of the bottom, so in terms of national income it equals a similar loss of 1.1%. Again, the development in the US is more extreme than that in any other country. Here, the bottom 20% income share has been halved (from 3.8% to 1.9%) and that of the middle cut by about a quarter (from 15.3% to 11.6%). In very few countries, the bottom and middle quintiles have experienced (slightly) increasing pretax income shares. Overall, Figure 1 thus displays a now familiar pattern of widening pretax income distributions since 1980, especially in the US.Footnote 2
There are many and complex reasons for this widening. Most are linked to the transition from a Fordist industrial economy to a new knowledge economy, with an increasing market premium on skills combined with strong agglomeration dynamics in the successful cities.Footnote 3 Some of these changes have caused, and are in turn caused by, changes in market power. The bottom has lost out with the decline of unions and centralized wage bargaining (Ahlquist Reference Ahlquist2017), increasing gig work, and growing monopsony power of large employers (Hertel-Fernandez Reference Hertel-Fernandez2018; Rahman and Thelen Reference Rahman and Thelen2019; Thelen Reference Thelen2018), especially in the US and the UK, whereas the top has benefited from skill-biased technological change (Autor, Levy, and Murnane Reference Autor, Levy and Murnane2003). We recognize the importance of explaining “predistribution,” but whereas pretax inequality has many (economic and political) causes, fiscal redistribution is a direct result of democratic politics, and so like most of the political economy literature, our focus is on redistribution where democratic politics and political power should be paramount. In Appendix B, however, we consider the extent to which government redistribution also affects the distribution of pre-fisc income. The effects are not large, but they mostly reinforce the findings for redistribution.
A Three-Class Theory of Redistribution
In Gilens’s (Reference Gilens2012) pioneering work, policy influence is compared across income classes. We agree with Gilens that if the task is to account for power over democratic politics, we cannot dispense with an analysis of class interests. But instead of using expressed preferences in opinion surveys to gauge interests, with all the pitfalls of such an approach, we derive interests from the existing literature and compare them with actual policies of redistribution.
The point of departure is a standard three-class model of redistribution pioneered by Persson and Tabellini (Reference Persson and Tabellini2000). The model assumes that individuals belong to a low-, middle-, or high-income class (which we refer to as L, M, and H) and that each class maximizes net income for itself, with due attention to the efficiency costs of taxation. Unlike the classic Meltzer–Richard model (Reference Meltzer and Richard1981), the three-class model has no median voter because taxes and transfers can be targeted to each class. With additional assumptions, however, there are coalitional equilibria in the model. Iversen and Soskice (Reference Iversen and Soskice2006) show that if two classes are required for a majority and policies are decided through Rubinstein bargaining, the possibility of stable equilibria arises because there is a cost of switching from one coalition to another (in Rubinstein bargaining theory this is the cost of a delay), so whichever coalition partner gets to make the first offer will ensure that this offer is marginally better than what the other player can get from an alternative coalition. The offer is accepted and the game ends. This logic applies to a proportional representation system with three class parties. In a majoritarian two-party system with an LM and MH party, the party that is more credibly committed to an M platform wins the majority.
The Iversen–Soskice model implies that the middle class is more likely to be part of a winning coalition than either the poor or the rich. Loosely speaking, this is because the interests of the middle class are better aligned with those of either the poor or the rich than the alignment of interests between the poor and the rich.Footnote 4 Consistent with much work on redistribution and the welfare state—from Baldwin (Reference Baldwin1990) to Esping-Andersen (Reference Esping-Andersen1990) to Rothstein (Reference Rothstein1998)—the model therefore predicts the middle class to have an outsized influence on policies, and middle-class interests consequently serve as a natural baseline against which we can evaluate actual outcomes.
Class Interests Defined
The three-class theory stipulates that each class wants to tax other classes up to the point where any additional taxation would reduce revenues because of tax disincentives, but in keeping with standard arguments about democracy we assume that “regressive” redistribution from lower to higher classes is not feasible. Theoretically, this can be justified if (advanced) democracy is a credible commitment to redistribution, as argued by Acemoglu and Robinson (Reference Acemoglu and Robinson2006). Empirically, there is also no country-year in our sample of advanced democracies with regressive taxation.Footnote 5 Assuming nonregressivity, the optimal tax rate of H is zero, whereas M wants to tax H at the maximum rate and transfer the proceeds to itself. The optimal policy for L is to tax both M and H at the maximum rate and transfer the proceeds to L.
With these assumptions, if M is politically decisive its net income,
 $ {y}_M^{net} $
, is
 $$ {y}_M^{net}\hskip0.35em =\hskip0.35em {y}_M+{T}_M\hskip0.35em =\hskip0.35em {y}_M+{t}_M^H\ast \cdot {y}_H, $$
where
 $ {y}_M $
is M’s pre-fisc income,
 $ {T}_M $
is the net transfer to M, and
 $ {t}_M^H\ast $
is the optimal tax rate imposed by M on H. The tax rate is broadly conceived to include all taxes on labor and capital income, property, and consumption plus mandatory social contributions.
We next define H’s rate of transfer as the net transfer from H divided by H’s net income (assuming M is decisive):
 $$ {\tau}_M^H(H)\hskip0.35em =\hskip0.35em \frac{-{T}_M}{\left(1-{t}_M^H\ast \right)\cdot {y}_H}\hskip0.35em =\hskip0.35em \frac{-{t}_M^H\ast \cdot {y}_H}{\left(1-{t}_M^H\ast \right)\cdot {y}_H}\hskip0.35em =\hskip0.35em -\frac{t_M^H\ast }{1-{t}_M^H\ast }. $$
If M has the power to tax at its optimal rate, H’s transfer rate is expected to be stable and unrelated to H’s income. On the other hand, if income buys influence (say through campaign contributions or lobbying) and if more income buys more influence, as arguments about the power of the rich would have it, H’s transfer rate should be declining in top-end inequality. In that case, the rich would contribute less to redistribution and the middle class would lose out. Any such drop in the transfer rate would be evidence of the rich growing more powerful.
Yet the power of money extends well beyond any direct influence on statutory tax rates and may work indirectly by undermining the government’s capacity to tax. Going back to Mirrlees (Reference Mirrlees1971), a standard assumption in the optimal taxation literature is that taxation creates work disincentives, but this is probably only a minor consideration for the rich.Footnote 7 The new tax responsiveness literature, pioneered by Feldstein (Reference Feldstein1995; Reference Feldstein1999), instead considers the ability of businesses and high-income earners to shift their consumption, income, and effort to offset higher taxes. For example, in response to a tax hike it may be possible to redirect income to lower-taxed foreign jurisdictions; or it may be possible to shift income to forms of renumeration—stock options, profit sharing, supplementary health or pension benefits, and so on—that are subject to lower tax rates; or it may cause some high-income earners to cut nonpaid hours of work in ways that reduce productivity and taxable income in their paid work. Such substitution effects result in deadweight losses and impose a constraint on fiscal policy makers. Recent studies from both the US and Europe confirm the existence of substitution effects and further show that they (unsurprisingly) increase in income and wealth (e.g., Gruber and Saez Reference Gruber and Saez2002; Saez, Slemrod, and Giertz Reference Saez, Slemrod and Giertz2012).
An unambiguous implication of the new tax responsiveness literature is thus that increasing top-end incomes incentivize the rich to engage in tax shifting. Yet, governments are not powerless. Indeed, Saez and Zucman (Reference Saez and Zucman2019) argue that constraints on governments’ taxable capacity (at least partly) reflect the tax structure itself, which is a function of past policy decisions. Therefore, for M to retain its political influence and keep up H’s transfer rate during periods of increasing top-end inequality, it must counter not only the “instrumental power” of the rich to shape the tax structure but also their “structural power” to evade taxation within any given tax structure. This presupposes that democratic governments continuously use their legislative and regulatory powers to plug tax loopholes and dissuade tax evasion. The difference between a constant and a falling H transfer rate is the difference between a politically resillient nonrich majority and an ascending rich minority. In a nutshell, this is what the contemporary debate about inequality and class power is all about.
The need of M to assert itself over fiscal policies when top-end inequality increases is perhaps more transparent when we define the transfer rate relative to M’s (net) income:
 $$ {\tau}_M^H(M)\hskip0.35em =\hskip0.35em \frac{T_M}{y_M+{T}_M}\hskip0.35em =\hskip0.35em \frac{t_M^H\ast \cdot {y}_H}{y_M+{t}_M^H\ast \cdot {y}_H}\hskip0.35em =\hskip0.35em \frac{t_M^H\ast }{\frac{y_M}{y_H}+{t}_M^H\ast }. $$
Compared with the H transfer rate, we see that constant M class power requires that the M transfer rate increases in top-end inequality.
Note that the need for M to continuously adjust policies to protect its interests in an inequalizing world means that policy stasis and path dependence are insufficient mechanisms for defending middle-class interests, in contrast to Pierson’s (Reference Pierson1996) classic argument. All countries in our sample have gone through multiple reforms of their tax and transfer systems to protect and expand the tax base while simultaneously adjusting policies to new circumstances and political demands (including cuts to marginal tax rates). Our goal is not to explain the content of these reforms but instead to track their cumulative fiscal implications under the assumption that changes in transfer rates reflect underlying changes in class power.
Extension (i): The Role of Public Goods
The baseline theory assumes that M wants to spend all tax proceeds on itself and L will consequently never see an off-setting transfer when top-end inequality increases (unlike M). However, certain types of public-goods spending do include L as a beneficiary. The classic example is national defense, but the assumption of cross-class sharing is approximated for a range of public goods paid out of general taxation. This is true for everything from public schooling to large-scale infrastructure to policing.Footnote 8 Therefore, including public goods in the analysis should make the transfer rate dependent on top incomes, with H contributing more and L now benefitting, when top-end inequality increases. For overall government spending, L should benefit more the higher the share of spending allocated to public goods.
This logic is captured by the classic Meltzer–Richard model because benefits are here assumed to be lump sum, whereas taxes are propotional. Under these assumptions, M’s optimal tax rate, and thus H’s transfer rate, increases with inequality. The problem with the Meltzer–Richard model is that there is no general justification for why M should impose taxes on itself for purposes of redistribution or why it would share the proceeds with L. But for pure public goods it is a good approximation.
Extension (ii): The Role of Insurance
In addition to public goods, M may also tax itself for purposes of social insurance, just as people may spend some of their income on private insurance (say life, property, or car insurance). Social insurance has long been understood as a major component of the welfare state (Baldwin Reference Baldwin1990; Moene and Wallerstein Reference Moene and Wallerstein2001; Rehm Reference Rehm2016), and it has broad consequences for distributive outcomes because insurance payouts go to those who have lost income. Even if L has no political power, many in L—including the sick, infirm, and unemployed—will benefit from M supporting spending for purposes of insurance. This logic extends across generations, where M may want to insure its children in case they experience downward mobility or M may want to insure its parents against poverty in old age. Such insurance will count as income for the poor (L).
We can account for the role of social insurance by assuming that people are exposed to a risk of downward mobility so that M benefits in some measure from transfers to L. The same is true of H, but those in the high-income group tend to be largely shielded from risks. In Moene and Wallerstein (Reference Moene and Wallerstein2001), for example, the rich are assumed to face no risks at all, and empirically, the risk of unemployment is strongly negatively related to income (Rehm Reference Rehm2016). Even if we allow the rich to have demands for insurance, those with high incomes tend to have better access to private insurance, which undermines any incentive of H to support public insurance (Busemeyer and Iversen Reference Busemeyer and Iversen2020).
Opportunities for upward mobility will in principle also shape redistributive preferences (by reducing them). Yet, for risk-averse voters, downward mobility should have a larger effect on welfare, and because upward and downward mobility cancel out in equilibrium, we focus on the risk of downward mobility.Footnote 9
Standard insurance models have two important results for our purposes. First, exposure to risk of downward mobility (from M to L) will cause M to support transfers that benefit L (the more so the higher the risk).Footnote 10 Second, higher low-end inequality will increase M’s demand for insurance.Footnote 11 The intuitions are simple: as the purpose of insurance is to smooth income across good and bad states of the world, the preferred level of insurance goes up as the risk of falling into the bad state increases and as the expected loss of income from such downward mobility goes up. The latter result stands in contrast to Lupu and Pontusson’s (Reference Lupu and Pontusson2011) social affinity argument as well as to Meltzer and Richard (Reference Meltzer and Richard1981), as in both models higher relative income of M should lead to less redistribution.Footnote 12
Above all, insurance is important for our understanding of redistribution because it helps us explain why L benefits even if it does not have any political power (analogous to the logic for public goods). Note, however, that this dependence also exposes L to the whims of middle-class preferences: if middle-class demand for insurance falls, so does redistribution to the poor. This would be true, for example, if labor markets are becoming more segmented (Alt and Iversen Reference Alt and Iversen2017).
Extension (iii): The Importance of “Who Governs?”
We have so far only considered the interests of the middle class under the assumption that it exerts a pivotal influence over government policies. The justification in the Iversen–Soskice model is that M is more likely to participate in government coalitions than either L or H. But we can refine the analysis by explicitly recognizing the difference between LM and MH coalitions, where the former is expected to be more conducive to L’s interests and the latter more conducive to H’s interests. Depending on bargaining power within the coalition, which we will approximate below by the share of seats controlled by government parties, M can ordinarily guarantee that it will emerge as a net beneficiary in either scenario. Of course, any influence of partisan coalitions presupposes that governments still have capacity to tax and transfer in the age of globalization and increasing inequality—something recent work questions (Huber and Stephens Reference Huber and Stephens2001; Piketty Reference Piketty2014; Rodrik Reference Rodrik2011; Streeck Reference Streeck2016).
Summary
The simple three-class theory of redistribution with M as a pivotal and self-interested actor implies that the benefits of redistributive policies will be concentrated in the middle class and mainly paid for by the rich. However, our focus is on dynamics because the current debate is mainly about the distributive consequences of neoliberalism and the increase in market inequality over the past four decades. The theory addresses those changes with the following set of testable hypotheses:
H1: (a) The H transfer rate is stable in the relative income of H; (b) it is (mildly) increasing when including public goods.
H2: When top-end inequality increases, (a) the M transfer rate also increases, whereas (b) the L transfer rate only increases when including public goods.
H3: As the share of spending on public goods and insurance increases in total spending, L benefits more from government spending.
H4: Bottom-end inequality leads to higher transfers to L.
H5: Center-left governments increase the L transfer rate; center-right governments reduce it.
A summary dynamic implication of the theory is that the middle class, via the democratic state, is powerful enough to ensure that its post-fisc income keeps up with the overall growth of the economy, despite increasing market inequality. This is countered in much contemporary scholarship by the twin conjectures that the political power of the rich is increasing with inequality and that the fiscal state is increasingly constrained by footloose capital.
Empirics
Data and Methods
To examine the dynamics of redistribution to and from different classes, we rely on newly released data from the WID. The WID combines data from household income surveys, tax returns, and national accounts to distribute total national income—GDP net of capital depreciation plus net foreign income—to individuals in a harmonized way across countries.Footnote 13
We focus on advanced democracies for which data are available on both pre- and post-fisc income. Our sample includes the following countries and years: Austria (2004–2016), Belgium (1991–2016), Denmark (1980–2016), Finland (1980–2016), France (1980–2017), Germany (1980–2016), Greece (1980–2016), Ireland (1980–2017), Italy (1980–2016), Netherlands (1980–2016), Norway (1980–2016), Portugal (1980–2016), Spain (1980–2016), Sweden (1980–2016), Switzerland (1982–2016), United Kingdom (1980–2017), and the United States (1980–2019).
For our purposes, the distributional national accounts series from the WID are superior to household income surveys, which most previous studies use, for several reasons. First, although surveys generally capture household income fairly well, total household income is far lower than total national income, which makes it difficult to compare with macroeconomic aggregates, such as GDP per capita growth. The WID accounts for all national income, making its income measures consistent with national accounts and enabling us to directly assess the distribution of macroeconomic growth over recent decades. This, in turn, permits us to test directly, and precisely, the broad implication of the baseline theory that the middle class, by using the fiscal levers of the state, can keep up with overall economic growth. Such a test can be performed only indirectly and inaccurately by using previous data.
Second, due to a combination of top-coding, and sampling and nonsampling errors, surveys systematically underestimate the income of top earners (Blanchet, Chancel, and Gethin Reference Blanchet, Chancel and GethinForthcoming). By combining data from the different sources, the WID can provide much more precise estimates of top incomes compared with surveys.
Finally, surveys capture only direct taxes, leaving out indirect taxes, and they also fail to account for the value of in-kind benefits, such as health care, education, child and elder care, defense, police, and other public goods. The WID accounts for all taxes, also indirect taxes, and it imputes the value of public goods and in-kind benefits to individuals, permitting us to assess the full redistributive effects of taxes and transfers.
All in all, the WID data permits us to go beyond existing studies by examining the targeting of taxes and transfers to different groups, with and without accounting for the value of in-kind benefits, as well as assessing the distribution of macroeconomic growth to different classes. That means we can directly measure all the key transfer rates defined in the theoretical section.
The WID’s measures of income refer to the adult population (20 years or older) and split income equally between spouses. Because the elderly population, which is typically excluded from analyses of redistribution, is included in the WID, the measures differ slightly from those used in most previous studies. In addition to labor and capital income, pretax income includes replacement income—which is taxable in most countries—notably pensions and unemployment benefits, net of contributions.Footnote 14 Because pensions are the primary income of the elderly (who typically have little or no market income), including pensions in posttax rather than pretax income would mechanically inflate redistribution in countries and years with large older populations, limiting the comparability of redistribution across countries and time.Footnote 15
Including unemployment benefits in pretax rather than posttax income does not matter for our evidence on posttax income growth, but it slightly biases our measures of redistribution to low-income individuals in a downward direction because benefits go to workers who would otherwise be coded as having zero pretax income. Yet, as unemployment spending accounts for only about 1.2% of GDP on average and because the overall generosity of unemployment programs have remained fairly stable in most of the countries in our sample, whether unemployment benefits are counted as pretax or posttax income has little effect on the trends in our redistribution measures.Footnote 16 To account for the little effect that there might be, we include a control for the unemployment rate in our statistical models.
The WID provides two measures of posttax income, which equal pretax income minus taxes (direct and indirect) plus transfers. The difference between the two measures is that one excludes the value of in-kind benefits (public goods) from transfers, whereas the other includes it. The value of in-kind benefits has yet to be fully incorporated into studies of redistribution, and it remains an important task for future research to explore ways of reliably doing so. We allocate public goods and in-kind transfers as an equal lump sum to all individuals, consistent with recent estimates computed by the Organization for Economic Co-operation and Development (OECD).Footnote 17 In Appendix D, Figures D1–D3, we examine redistribution under the alternative assumption that only spending on health has redistributive effects, whereas all other benefits are distributed proportional to posttax disposable income, as assumed in Piketty, Saez, and Zucman (Reference Piketty, Saez and Zucman2018) and Blanchet, Chancel, and Gethin (Reference Blanchet, Chancel and GethinForthcoming): this lowers the level of redistribution, but the trends are very similar to those in the scenario when all public goods are distributed in a lump sum.
Based on the pretax and posttax income measures, we calculate two measures of redistribution. The first captures cash transfers, net of taxes, whereas the second adds the value of in-kind benefits. Each of these measures can be expressed in either relative or absolute terms. The relative transfer rate is equivalent to the theoretical definition of transfer rates: it is the difference between a group’s pretax and posttax income expressed as a percentage of the group’s posttax (net) income. The absolute transfer rate expresses net transfers as a percentage of national income, and we use these to put the net transfers to each group in macroeconomic perspective.
We also follow the theory by calculating transfer rates for three groups: L, M, and H, which we define to consist of the bottom 20%, middle 20%, and top 1% of the income distribution. Although this grouping does not account for the entire income distribution, it better enables us to zero in on the targeting of taxes and transfers to and from different classes. The top 1% has of course also played a central role in the academic and public debate about inequality, and we want our findings to directly address that debate. We recognize the usefulness of accounting for the entire income distribution, but doing so does not substantively alter our conclusions (see Appendix A).
Redistribution Since 1980
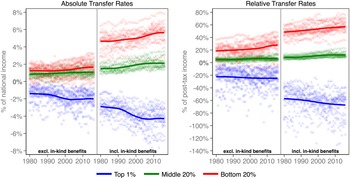
Figure 2 plots the absolute and relative transfer rates of L, M, and H from 1980 to 2016. The red, green, and blue dots (triangles) represent the transfer rates of the bottom 20%, middle 20%, and top 1% exclusive (inclusive) the value of in-kind benefits for each country-year observation. The colored lines are local polynomial smoothers, illustrating differences in average transfer rates between groups at any one point as well as trends over time.
Absolute and Relative Transfer Rates in 17 Advanced Democracies, 1980–2016
Note: In Switzerland the series starts in 1982, in Belgium in 1991, and in Austria in 2004. The results are similar when including only countries for which full time series are available.

Looking first at differences in levels of absolute transfer rates (left panel), we see that, on average, L and M are net beneficiaries of redistribution, whereas H is always a net contributor. We also see that on average transfers are strictly progressive with L’s average transfer rate being greater than that of M in all years. Yet in some country-years, the transfer rate of M is greater than that of L, which is mainly due to variation in L’s transfer rate. From a theoretical perspective, this is consistent with M exerting a stable influence on transfer rates, whereas L’s ability to redirect transfers to the bottom depends on its (varying) bargaining power. A contributing factor may be the business cycle, which tends to affect low-end market incomes disproportionately, resulting in more volatile transfer rates (Hoynes, Miller, and Schaller Reference Hoynes, Miller and Schaller2012).
The figure further shows, as expected, that accounting for the value of in-kind benefits increases L’s transfer rate significantly. It has a similar, though smaller, effect on transfers to M, whereas it increases the share of income that the rich give up to redistribution. Therefore, taking account of the redistributive effects of in-kind welfare programs is important to the study of redistribution.
A closer look at the trends over time reveals that the top 1% has given up an increasing share of total income to redistribution since 1980. Whereas the tax and transfer system reduced the income share of the top 1% by 1.4% of national income in 1980, its income share was reduced by 2.0% in 2016. When including in-kind transfers, the drop is more pronounced with an average change from 2.9% to 4.3%. By contrast, the middle-income quintile has increased its absolute transfer rate from 0.9% of national income in 1980 to 1.1% in 2016. Again, when we include in-kind transfers, we see a more pronounced change from 1.5% to 2.1%. Finally, the bottom-income quintile has, on average, experienced the greatest increases in transfer rates. In 1980, the national income share of the bottom 20% increased by 1.2% after taxes and transfers, whereas it increased by 1.6% in 2016. These numbers are 4.6% and 5.5% when including in-kind transfers.
If we measure net transfers relative to posttax income, we get a slightly different pattern because of variation across classes in pretax income (right panel). For H the cash transfer rate is essentially constant, mirroring the theoretical prediction when assuming that M sets the tax rate on H to maximize its post-fisc income (H1a), but when in-kind benefits are included, the transfer rate has been gradually increasing from 57% to 68% of H’s posttax income between 1980 and 2016. This result is also as expected because in-kind benefits approximate the Meltzer–Richard model assumption that benefits are lump sum and therefore should be increasing in inequality (H1b).
Because the pre-fisc income shares of L and M have been trending downward, the increases in absolute transfer rates make the trends in relative transfer rates even more pronounced; M has experienced an increase in cash transfers from 5% to 7% of its posttax income and L from 18% to 27%. The former is again as expected (H2a), but the improvement for L is more puzzling. It cannot be explained by increasing top-end inequality when in-kind benefits are excluded (see H2b), and many analyses of labor markets imply that risks have grown more bifurcated, with M becoming more secure and L less secure. That should lower the importance of insurance motives in the middle class (Alt and Iversen Reference Alt and Iversen2017; Rehm Reference Rehm2016; Rueda Reference Rueda2007). Increasing house prices, which have been a strong driver of wealth accumulation in the middle class, likewise suggest that demand for social insurance among middle-class homeowners has declined (Ansell Reference Ansell2014). On the other hand, as many in M drop into L when they retire, M’s incentives to insure themselves against illness and old age may be growing with aging populations. Health care benefits constitute a large and increasing fraction of public goods consumption in every country, and they are concentrated among the elderly who tend to live on relatively low retirement incomes. Indeed, the trend for L becomes more pronounced when in-kind benefits, such as those related to health care and nursing homes, are included. That is consistent with H2b.
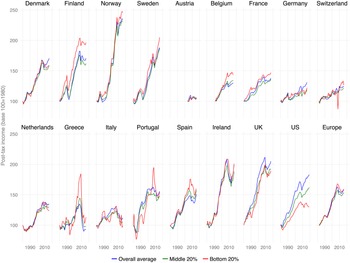
Overall, we find that the democratic state has played a major role in responding to increasing pretax income inequality since 1980.Footnote 18 The rich pay a roughly constant share of their (increasing) pretax incomes into the transfer system, and as a result L and M have been able to keep up with the overall expansion of the economy much better than one would have predicted from the evolution of pretax incomes. This is evident from Figure 3, which shows the evolution of real posttax income of L and M compared with the mean income in each country. On average, for European countries the income growth of L and M are within 5% of the mean income growth, which has exceeded 50% on average (last panel in Figure 3). Considering the increase in pre-fisc inequality, this has only been possible because of a highly redistributive state that has responded to the economic interests of the majority.
The Evolution of Low and Middle Incomes (Posttax) since 1980
Note: The figure shows the evolution of real posttax income (including in-kind transfers and public goods) for the bottom 20% and middle 20% compared with the mean income. In Austria, Belgium, and Switzerland the base 100 is 2004, 1991, and 1982. The graph for Europe includes all the European countries except Austria and Belgium and has base 100 in 1982.

However, the US is a major outlier. Although the overall economy expanded by 77% between 1980 and 2016, M and especially L experienced much lower growth rates of 56% and 33%. And contrary to Europe, L’s income growth in the US is largely driven by greater public goods provision. When we allocate in-kind spending on domains other than health proportional to posttax disposable income, thereby assuming that only in-kind transfers on health have redistributive effects, L’s income has grown just 13% in real terms since 1980 (the growth in M’s income drops marginally from 56% to 51%, see Appendix Figure D6). The US is the only advanced democracy in which greater economic prosperity has been distributed so unequally. We will consider likely violations of theoretical assumptions as causes for this deviation in the next section.
The Drivers of Change
What is driving changes in transfer rates over time? To answer this question, and more directly test the hypotheses laid out above, we estimate a set of general error-correction models (GECM). Using GECMs enables us to examine the causal dynamics of rates of transfers to and from each income class in both the short and long run, and they are therefore well-suited to test our hypotheses. Using GECMs requires that all series are either stationary or cointegrated, and augmented Dickey–Fuller and Levin–Lin–Chu tests indicate that the series are stationary. More concretely, we estimate a set of regressions of the following form:
 $$ \Delta {\tau}_{i,t}\hskip0.35em =\hskip0.35em \phi \cdot {\tau}_{i,t-1}+\sum \limits_{k=1}^K{\beta}_{1k}\cdot \Delta {x}_{k,i,t}+\sum \limits_{k=1}^K{\beta}_{2k}\cdot {x}_{k,i,t-1}+{\alpha}_i+{\varepsilon}_{i,t}, $$
where
 $ \Delta {\tau}_{i,t} $
denotes changes in transfer rates between year t − 1 and t in country i, τ
i,t–1 is the lagged level of the transfer rate, and
 $ \phi $
captures the speed with which transfer rates return to their equilibrium after a shock to the series.Footnote
19
To ensure that (overly) restrictive assumptions about how the effects of certain variables play out over time do not bias our inferences, all regressors, k, are included both as changes (
 $ \Delta {x}_{k,i,t} $
) and lagged levels (
 $ {x}_{k,i,t-1} $
).
 $ {\beta}_{1k} $
captures the short-run effect of a change in regressor k on the transfer rate, whereas the total long-run effect is given by
 $ \frac{\beta_{2k}}{\phi } $
(De Boef and Keele Reference De Boef and Keele2008). Because our interest lies in patterns of change over time, we include country-specific intercepts (
 $ {\alpha}_i $
); these also ensure that the results are not biased by time-invariant factors that correlate with both the transfer rates and regressors.Footnote
20
Finally, although the models we present here do not include time trends, we show in Appendix Tables E3 and E4 that the main results are substantively similar when doing so.
To enable tests of H1, H2, and H4, we include among the regressors measures of top- and bottom-end income inequality, which we measure as the pretax income share ratio between the top 1% and middle 20% (
 $ \frac{y_{p99p100}}{y_{p40p60}} $
) and that between the middle 20% and bottom 20% (
 $ \frac{y_{p40p60}}{y_{p0p20}} $
). For the models in which the dependent variable includes the value of public goods and in-kind transfers, we add a variable that captures public goods consumption as a share of national income, which allows us to test H3. To test the final hypothesis, H5, we include a cumulative measure of left-party participation in the government.Footnote
21
As controls, we include measures of capital market integration (Chinn and Ito Reference Chinn and Ito2006) and trade openness (sum of imports and exports as a share of GDP), which capture the potential influence of globalization on class power and transfer rates. We also include a measure of the marriage rate to control for changes in family structure over time and the unemployment rate to account for the effect of automatic stabilizers on net transfers.Footnote
22
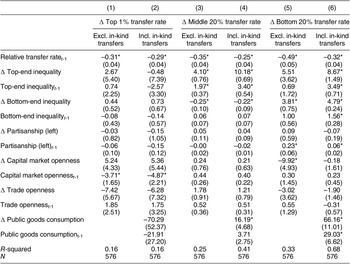
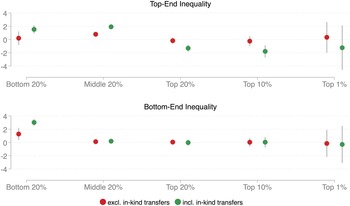
Table 1 reports the results for the relative transfer rate of the top 1% (models 1 and 2), middle 20% (models 3 and 4), and bottom 20% (models 5 and 6), excluding and including in-kind transfers.Footnote 23 We begin with the results for income inequality, which strongly support the theoretical predictions. To best see this, we illustrate in Figure 4 the total long-run effects of one-standard-deviation changes in top- and bottom-end inequality on net transfer rates, calculated from the estimates of Table 1 and Appendix Tables E7 and E8.
Determinants of Relative Transfer Rates

Note: Panel corrected standard errors in parentheses. All models include country-specific intercepts and controls for the marriage rate and unemployment. For the full set of results, see Appendix Table E9. *p < 0.05.
Long-Run Effects of Top and Bottom-End Inequality on Transfer Rates
Note: The figure shows the total long-run effect of a one-standard-deviation change in top- or bottom-end inequality on the relative transfer rate of a group with and without including in-kind transfers. The long-run multipliers are estimated using the Bewley (Reference Bewley1979) transformation based on the estimates in Table 1 and Appendix Tables E7 and E8.

The top panel of the figure shows that increasing top-end inequality does not affect H’s cash transfer rate. For the top 1%, there is (unsurprisingly) some uncertainty around the estimate, but for the larger top-10% and top-20% groups, the long-run multipliers are quite precisely estimated null effects. Yet because top-end inequality has been driven by H’s income increases, these null effects are in fact quite substantial in terms of national income. For a one-standard-deviation increase in top-end inequality, the top 1% pays about 0.2% more of national income into the system, whereas the top 10% and top 20% pay about 0.3% and 0.2% more.Footnote 24 These results are consistent with optimal taxation theory and H1a: when the rich get richer, their tax payments increase in absolute terms but remain stable relative to posttax income.
When we include public goods and in-kind benefits in net transfers, the effects of top-end inequality turn negative, as predicted by H1b. In this scenario, H’s transfer rate increases by about 1.2% of posttax income for the top 1% and about 1.8% and 1.3% for the top decile and quintile richest individuals. Again, these effects are large in terms of national income: The top 1% pays 0.6% more of national income into the system when top-end inequality increases by one standard deviation; the top 10% and top 20% pay about 0.9% and 0.8% more, respectively.
For M, a one-standard-deviation increase in top-end inequality increases its cash transfer rate by 0.8% of its posttax income; including the value of in-kind transfers, the increase in net transfers to M is 1.9%. These effects are equivalent to increasing M’s transfer rate by about 0.1% and 0.3% of national income, and they are consistent with H2a and the theoretical prediction that increasing top-end inequality drives up transfers to M.
Whereas increasing top-end inequality increases redistribution of income from H to M, the relative cash transfer rate of L remains unaffected. But as L also benefits from increased in-kind (nonexcludable) transfers to M and because such transfers increase with top-end inequality, increasing top-end inequality also increases L’s transfer rate when such benefits are included. The effect equals about 1.5% of L’s posttax income and 0.1% of national income. This supports H2b and suggests that recent decades’ increases in transfers to the poor are driven in significant measure by middle-class demand for public goods and social insurance, from which L cannot usually be excluded. We are not able to fully separate public goods spending from social insurance—health care spending, for example, has aspects of both—but it seems safe to assume that L has benefitted from both.
The bottom panel of Figure 4 shows that increasing bottom-end inequality increases transfers to L but has no other long-run effects. A one-standard-deviation increase in bottom-end inequality increases L’s cash transfer rate by 1.3% of L’s posttax income. When including in-kind transfers, L’s transfer rate increases by 3.0% of its posttax income, which is equivalent to about 0.1% of national income. These results corroborate H4 and the theoretical prediction that when bottom-end inequality increases, M is willing to pay a higher insurance premium. Interpreting insurance broadly, M is likely to want to ensure that it can always receive generous in-kind benefits, such as care in the case of illness, good elderly care for its parents, and retraining for its children, in case of downward mobility.
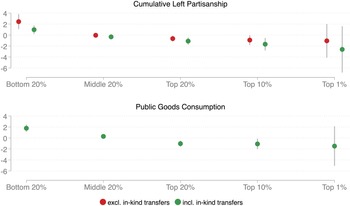
Turning to the effects of partisanship, the results of Table 1 corroborate H5 and show that who controls the government still matters in the post-1980 world, as left-party governments redirect transfers to L. As shown in the top panel of Figure 5, the magnitude of the effect suggests that a one-standard-deviation increase in left partisanship increases cash transfers to L by about 2.4% of L’s posttax income in the long run, which in terms of national income is a nontrivial effect of 0.2%. When we include in-kind benefits, the effect weakens to about 1% of L’s posttax income, yet it remains constant, and thus substantively similar, in terms of national income. This result suggests that the effect of left partisanship primarily reflects increases in cash transfer to L rather than in-kind public goods, which M tends to support regardless. For M, the results suggest that left partisanship is unrelated to the transfer rate, whereas for H they indicate that increasing transfers to L under left-party rule are paid for by greater tax payments by high-income individuals. Although the effects are imprecisely estimated for the top 1%, they are significant for both the top 10% and top 20%, despite being of slightly smaller magnitude. In Appendix B we show that left partisanship also reduces pre-fisc inequality, and we discuss likely sources of this reinforcing effect.
Long-Run Effects of Left Partisanship and Public Goods Consumption on Transfer Rates
Note: The figure shows the total long-run effect of a one-standard-deviation change in left partisanship or public goods consumption on the relative transfer rate of a group with and without including in-kind transfers. The long-run multipliers are estimated using the Bewley (Reference Bewley1979) transformation based on the estimates in Table 1 and Appendix Tables E7 and E8.

The findings for public goods consumption, shown in the bottom panel of Figure 5, demonstrate the importance of public goods for L’s transfer rate, with a one-standard-deviation increase in public goods consumption being associated with an increase in transfers to L by about 1.8% of L’s posttax income (an effect equivalent to 0.3% of national income). This result is consistent with H3 and helps explain the puzzling increases in transfers to L discussed above. Although the increases in public goods consumption that have occurred in most countries since 1980 have benefitted L, they are almost certainly not a result of increased power of L. Left governments are not becoming more common over time, and when they are in power, they mostly affect cash transfers to L (as we just saw). Rather, L benefits indirectly from the strong position of M to demand generous public goods provision and social insurance, notably education, health care, and nursing from which L typically cannot be excluded. Figure 5 also shows that increases in in-kind benefits tend to slightly increase H’s transfer payments, meaning that, as opposed to L and M, H is a net contributor of more generous in-kind benefit programs (again the coefficients are more precisely estimated for the top 10% and 20%).
Finally, the results for capital market openness and trade openness in Table 1 lend little support to the notion that globalization has undermined the power of the state or the middle class to tax the rich. In fact, greater capital market openness appears to be negatively associated with H’s relative transfer rate in the long run, meaning that opening up financial systems has gone hand in hand with an increased share of income that the rich contribute to taxes. These findings clearly contradict any simple “race to the bottom” globalization story.
In addition to the alternative model specifications already discussed, we show in Appendix E that our main results are substantively similar when (1) using one-way and two-way fixed effects models; (2) distributing only in-kind transfers on health as an equal lump sum; and (3) including additional controls for the share of elderly, female labor force participation, and union density. We also show that the results are robust to accounting for increasing house prices, which have contributed to increasing wealth accumulation and lowered demand for social insurance among middle-class homeowners (Ansell Reference Ansell2014).
The US Exception
Our examination of the data from the WID, by far the most comprehensive database on income distribution and redistribution, largely supports a simple theory of democracy where the middle class is pivotal and the poor benefits indirectly from spending on public goods and insurance against downward mobility. Democracy thus lifts all boats and ensures broad sharing of growing economic prosperity. Yet, the US stands out as a major outlier. Although the middle class has seen a significant increase in net incomes, it has not kept up with overall economic growth. The poor have done even worse.
American exceptionalism is important for three reasons. First, the gloomy predictions about the capacity of democracy to counter increasing inequality builds heavily on the US experience, but this experience cannot and should not be generalized. Second, although the US is an outlier, it is at the same time by far the largest country among affluent democracies, so it is of intrinsic interest. Finally, the case can help us understand the institutional conditions that need be satisfied for the simple theory of democracy to apply. In this section we briefly sketch an explanation of why the US is different, which draws on existing literature and helps highlight crucial theoretical assumptions. As most comparativists would agree, case studies are more useful in generating than in testing hypotheses, so our reflections are meant more as conjectures than as clinching evidence.
There are two obvious violations of the theoretical assumptions that strike us as important in accounting for the US case:
-
(1) Countermajoritarian institutions. The three-class theory assumes majoritarian rule with each vote counting equally, but American institutions accord overrepresentation to conservative rural areas in Congress and the Electoral College (Rodden Reference Rodden2019). Institutions are also designed to make policy change difficult by creating many veto points. For these reasons, the Republican Party has been able to govern with minority support, or to block majority rule, for long periods (Hacker and Pierson Reference Hacker and Pierson2010). This is not a new situation, of course, but it has made redistributive responses to increasing inequality politically fraught.
Two aspects of this institutional reality stand out in the context of the transition to a knowledge economy. First, there is an increasing urban–rural divide, with opposition to taxation and redistribution concentrated among the overrepresented rural districts and states (Hacker and Pierson Reference Hacker and Pierson2020). Second, the American lobbying system confers exceptional influence to business interests, and these interests are particularly influential in the Republican Party (Hacker et al. Reference Hacker, Hertel-Fernandez, Pierson and Thelen2021; Hertel-Fernandez Reference Hertel-Fernandez2018; Reference Hertel-Fernandez2019; Rahman and Thelen Reference Rahman and Thelen2019). Major new redistributive programs and progressive adjustments to the tax code stand less of a chance of passage in this context.
-
(2) Race. The theory assumes the political preeminence of class, but race is a widely recognized dimension of distributive politics in the US (Alesina and Glaeser Reference Alesina and Glaeser2004; Cramer Reference Cramer2016; Gilens Reference Gilens2009). Even though racism has been a constant feature of American politics, we believe it affects our results dynamically for two reasons. First, increasing poverty and risk of poverty have been concentrated among minorities, which has undermined the demand for insurance among the majority. Second, a declining marriage rate has been a source of inequality because poor household members are no longer supported by their spouses, and this decline has been more pronounced among poor minorities. Single Black mothers—the targets of Reagan’s racialized campaign against welfare—get little sympathy among the white majority. Many European countries have seen similar declines in marriage rates, but the state has compensated for the implied increase in inequality through increased family allowances and related child benefits.
This conjecture finds direct support in the WID data because when the effect of changing marriage rates is eliminated by assigning income to each spouse separately, the gap in posttax income growth for L and the mean income does not increase by nearly as much (Appendix Figure D9).
Again, our interpretation of American exceptionalism should be seen as conjectures rather than findings, but it does highlight that standard arguments about democracy, which are broadly captured by the three-class theory of redistribution, depend a great deal on the assumptions of majority rule and the high salience of economic interests.
Conclusion
Thomas Piketty, one of the researchers behind the data we are using, argued in his influential Reference Piketty2014 book that an increasing share of income was going to the richest 1% and that this implied a growing distortion or even subversion of democracy. This may be a reasonable inference to draw from the increase in market inequality, but advanced democracies look a lot better when we consider the role of the state in redistribution. Across rich democracies, increasing top-end inequality has increased the amount of taxes paid by the rich, and transfers to the middle, and usually also the bottom, have increased. This shift does not appear to be inhibited by economic globalization.
These findings suggest that as the rich become richer, the middle uses its power in the democratic state to ensure that the growing prosperity is shared. Relative to mean income, the position of the middle in the net income distribution is essentially constant in most advanced democracies. The findings are remarkably well accounted for by a simple three-class theory of democracy, and they are more consistent with classic notions of democracy than with the idea that capitalism subverts democracy.
Yet, the analysis also highlighted a puzzle and a major outlier. The puzzle is that redistribution to the bottom has been maintained, and even increased, over time in most countries, contrary to the widespread belief that the poor have lost out. The reason can hardly be political power—by all accounts the left and unions are weaker today than 30 years ago—and although the middle class will support transfers to the bottom out of concerns about services and downward mobility, most analyses point to lower mobility and concentration of risks in the bottom half of the distribution. The increasing availability of private alternatives in the middle classes should also reduce support for solidaristic welfare state spending, and so should increasing house prices and the associated accumulation of wealth in the middle class. This leaves a great deal of unexplained variance. After years of focusing on the top, renewed scholarly attention to bottom-end inequality is warranted.
The outlier is the US. Although the overall transfer rate from the rich has not dropped, the implied redistribution has been insufficient to sustain the position of the middle class in the post-fisc income distribution. The bottom-income quintile has fared even worse, and its declining relative position is dramatic compared with that in other advanced democracies. One may see this as validation of some of the gloomier predictions about capitalism undermining the democratic state. To us the evidence instead points to the resilience of a strong state in most advanced democracies where majority rule is more consequential than ever.
Supplementary Materials
To view supplementary material for this article, please visit http://doi.org/10.1017/S0003055422000867.
Data Availability Statement
Research documentation and data that support the findings of this study are openly available at the American Political Science Review Dataverse: https://doi.org/10.7910/DVN/IG6ICN.
Acknowledgments
We are grateful to the participants in the Unequal Democracies: Public Policy, Responsiveness, and Redistribution in an Era of Rising Economic Inequality Speaker Series, Vanderbilt University, 2021 and in particular to Larry Bartels, Noam Lupu, Jonas Pontusson, Paul Pierson, the editors, and four anonymous reviewers for their detailed comments and suggestions on earlier versions of this paper.
Conflict of Interest
The authors declare no ethical issues or conflicts of interest in this research.
Ethical Standards
The authors affirm this research did not involve human subjects.




Comments
No Comments have been published for this article.