Introduction
Ultrahigh-pressure metamorphic (UHPM) rocks of coesite and diamond stability fields have attracted the attention of researchers over the years, as they are unique objects for reconstructing the metamorphic history of subduction-related mineral associations (e.g. Schertl and Sobolev, Reference Schertl and Sobolev2013; Liou et al., Reference Liou, Tsujimori, Yang, Zhang and Ernst2014). Super-silicic titanite with coesite exsolution (Ogasawara et al., Reference Ogasawara, Fukasawa and Maruyama2002) and K2O-rich (up to 1.5 wt.%) clinopyroxene (Shimizu, Reference Shimizu1971; Sobolev and Shatsky, Reference Sobolev and Shatsky1990; Claoué-Long et al., Reference Claoué-Long, Sobolev, Shatsky and Sobolev1991; Zhang et al., Reference Zhang, Liou, Ernst, Coleman, Sobolev and Shatsky1997; Katayama et al., Reference Katayama, Maruyama, Parkinson, Terada and Sano2001; Mikhno and Korsakov, Reference Mikhno and Korsakov2013) suggest the host UHPM rocks formed at depths in excess of 200 km (Katayama et al., Reference Katayama, Zayachkovsky and Maruyama2000; Ogasawara et al., Reference Ogasawara, Fukasawa and Maruyama2002; Perchuk et al., Reference Perchuk, Safonov, Yapaskurt and Barton2002; Mikhno and Korsakov, Reference Mikhno and Korsakov2015). Subsequent rapid exhumation of these rocks at rates of tens of kilometers per million years is the accepted mechanism for returning the deeply-subducted material to the Earth's surface (Hacker et al., Reference Hacker, Calvert, Zhang, Ernst and Liou2003; Dobretsov and Shatsky, Reference Dobretsov and Shatsky2004; Liao et al., Reference Liao, Malusà, Zhao, Baldwin, Fitzgerald and Gerya2018).
Regardless of the profound knowledge of UHPM complexes, many aspects currently remain disputable. An ongoing problem for diamond-bearing complexes is the reconstruction of the prograde metamorphic history, which is usually erased during exhumation as a result of dehydration reactions, diffusion and anatexis. One of the minerals capable of providing insights into the UHPM rock evolution is zircon, which is widespread in UHPM assemblages and is a common host for inclusions of UHP minerals, preventing their phase transition during the exhumation of the geological unit (Sobolev, Reference Sobolev1994; Chopin and Sobolev, Reference Chopin, Sobolev, Coleman and Wang1995; Parkinson and Katayama, Reference Parkinson and Katayama1999; Rubatto and Hermann, Reference Rubatto and Hermann2007; Liu and Liou, Reference Liu and Liou2011).
A pioneer attempt to reconstruct the prograde evolution of the diamond-grade Kokchetav rocks was carried out on the basis of an investigation into mineral inclusions in zircon from different lithologies of the Kokchetav massif (Katayama et al., Reference Katayama, Zayachkovsky and Maruyama2000). The combined application of optical microscopy, cathodoluminescence (CL), Raman spectroscopy and electron probe microanalysis (EPMA) of zircon grains revealed their complex internal textures, i.e. the presence of cores with pre-UHP metamorphic inclusions (graphite, quartz, phengite and apatite) and mantles enclosing HP and UHP inclusions (garnet, omphacite, coesite and diamond). This zonal distribution of mineral inclusions in zircon has been interpreted as a prograde PT record of the UHP metamorphic evolution (Katayama et al., Reference Katayama, Zayachkovsky and Maruyama2000).
As the geological evolution of rocks proceeds, the zircon structural state can change to the metamict state characterised by a low order of atom arrangement (Caruba et al., Reference Caruba, Baumer, Ganteaume and Iacconi1985; Chakoumakos et al., Reference Chakoumakos, Murakami, Lumpkin and Ewing1987; Woodhead et al., Reference Woodhead, Rossman and Silver1991). Metamictisation is the process of radiation damaging the zircon structure by the recoil cores and α-particles formed during the α-decay of U and Th radionuclides (Murakami et al., Reference Murakami, Chakoumakos, Ewing, Clark, White and Machiels1986; Weber et al., Reference Weber, Ewing and Meldrum1997; Ewing et al., Reference Ewing, Meldrum, Wang, Weber, Corrales, Hanchar and Hoskin2003). To indicate and estimate the crystallinity degree of the zircon structure, the CL (Vavra, Reference Vavra1990; Hanchar and Miller, Reference Hanchar and Miller1993; Schaltegger et al., Reference Schaltegger, Fanning, Günther, Maurin, Schulmann and Gebauer1999; Nasdala et al., Reference Nasdala, Lengauer, Hanchar, Kronz, Wirth, Blanc, Kennedy and Seydoux-Guillaume2002; Campomenosi et al., Reference Campomenosi, Rubatto, Hermann, Mihailova, Scambelluri and Alvaro2020), back-scattered electron imaging (BSE; Nasdala et al., Reference Nasdala, Kronz, Hanchar, Tichomirowa, Davis and Hofmeister2006; Zamyatin et al., Reference Zamyatin, Shchapova, Votyakov, Nasdala and Lenz2017, Reference Zamyatin, Votyakov and Shchapova2019), X-ray absorption (Farges and Calas, Reference Farges and Calas1991) and infrared spectroscopy (Zhang et al., Reference Zhang, Salje, Ewing, Farnan, Ríos, Schlüter and Leggo2000; Zhang and Salje, Reference Zhang and Salje2001) techniques have been applied extensively. It has been shown that one of the most suitable in situ techniques to measure the metamictisation degree of zircon is Raman spectroscopy (Nasdala et al., Reference Nasdala, Irmer and Wolf1995; Palenik et al., Reference Palenik, Nasdala and Ewing2003; Marsellos and Garver, Reference Marsellos and Garver2010; Campomenosi et al., Reference Campomenosi, Rubatto, Hermann, Mihailova, Scambelluri and Alvaro2020). The change of zircon crystallinity has been reported to be reflected in downshifting, broadening and decrease of intensity of the ν3(SiO4) band that occurs at 1008 cm–1 in the zircon Raman spectrum (Nasdala et al., Reference Nasdala, Wenzel, Vavra, Irmer, Wenzel and Kober2001; Shimizu and Ogasawara, Reference Shimizu and Ogasawara2014; Campomenosi et al., Reference Campomenosi, Rubatto, Hermann, Mihailova, Scambelluri and Alvaro2020).
The objective of this study is a combined application of CL, Raman spectroscopy and EPMA techniques to zircon from diamondiferous kyanite gneisses of the Kokchetav massif (Northern Kazakhstan) in order to reveal the metamorphic history encoded within the zircon interiors and rims. The synthesis of these analytical approaches allowed us to identify mineral inclusions in zircon and reconcile their distribution within individual zircon domains. Together with temperature assessments yielded by conventional geothermometers, the obtained data were employed to reconstruct distinct stages of zircon growth throughout the PT record of the host UHPM gneissic assemblages. Our data show that the zircon internal textures revealed clearly correlate with distinct growth events. The combined methodology described here can be reproduced and used for zircon from other UHP complexes the world over.
Geological outline and sample description
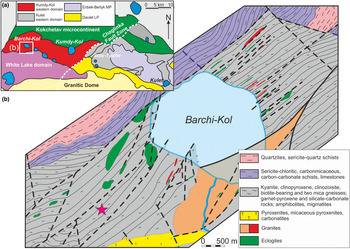
The Kokchetav massif is a mega-melange zone that consists of a series of units characterised by diverse PT conditions of formation (Dobretsov et al., Reference Dobretsov, Shatsky and Sobolev1995a,Reference Dobretsov, Sobolev, Shatsky, Coleman and Ernstb; Reference Dobretsov1998; Theunissen et al., Reference Theunissen, Dobretsov, Korsakov, Travin, Shatsky, Smirnova and Boven2000; Buslov et al., Reference Buslov, Dobretsov, Vovna and Kiselev2015). The massif is subdivided by the Chaglinka fault zone into two main blocks (diamond-free Kulet and diamondiferous Kumdy-Kol), which in turn include five terranes: Kumdy-Kol; Barchi-Kol; Enbek-Berlyk; Sulu-Tyube; and Kulet (Fig. 1a) (Dobretsov et al., Reference Dobretsov, Buslov, Zhimulev, Travin and Zayachkovsky2006). The peak metamorphic conditions for the diamond-bearing Kumdy-Kol rocks exceed 4 GPa and 1100°C (Sobolev and Shatsky, Reference Sobolev and Shatsky1990; Shatsky et al., Reference Shatsky, Sobolev, Zayachkovsky, Zorin and Vavilov1991; Dobretsov et al., Reference Dobretsov, Sobolev, Shatsky, Coleman and Ernst1995b; Mikhno and Korsakov, Reference Mikhno and Korsakov2015), whereas for the coesite-bearing Kulet rocks the values of >3 GPa and 720–760°C have been assessed (Shatsky et al., Reference Shatsky, Theunissen, Dobretsov and Sobolev1998; Ota et al., Reference Ota, Terabayashi, Parkinson and Masago2000; Parkinson, Reference Parkinson2000; Theunissen et al., Reference Theunissen, Dobretsov, Korsakov, Travin, Shatsky, Smirnova and Boven2000). A distinctive feature of the Kokchetav massif is a high mean rate (1.8 cm/year) of rock exhumation (Hacker et al., Reference Hacker, Calvert, Zhang, Ernst and Liou2003; Dobretsov et al., Reference Dobretsov, Buslov, Zhimulev, Travin and Zayachkovsky2006), which, in particular, has been considered as a reason for coesite preservation during exhumation (Mosenfelder et al., Reference Mosenfelder, Schertl, Smyth and Liou2005). The age of the peak metamorphism for the Kokchetav UHPM rocks estimated by U–Pb zircon methods (Claoué-Long et al., Reference Claoué-Long, Sobolev, Shatsky and Sobolev1991; Hermann et al., Reference Hermann, Rubatto, Korsakov and Shatsky2001, Reference Hermann, Rubatto, Korsakov and Shatsky2006; Katayama et al., Reference Katayama, Maruyama, Parkinson, Terada and Sano2001, Reference Katayama, Muko, Iizuka, Maruyama, Terada, Tsutsumi, Sano, Zhang and Liou2003; Katayama and Maruyama, Reference Katayama and Maruyama2009; Stepanov et al., Reference Stepanov, Rubatto, Hermann and Korsakov2016b) as well as by Sm–Nd mineral isochrons from the diamond-bearing rocks and associated rocks (Shatsky et al., Reference Shatsky, Jagoutz, Sobolev, Kozmenko, Parkhomenko and Troesch1999) is ca. 530 Ma.
Simplified maps of the Kokchetav massif (a) and Barchi-Kol terrane (b), compiled from Dobretsov and Shatsky (Reference Dobretsov and Shatsky2004) and Korsakov et al. (Reference Korsakov, Shatsky, Sobolev and Zayachokovsky2002), respectively. Magenta star indicates sampling location.

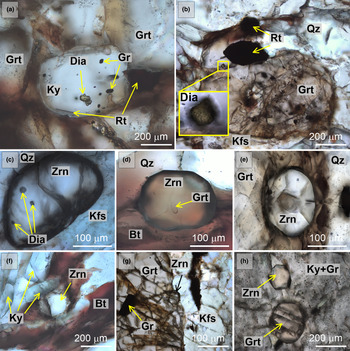
The diamond-bearing kyanite gneisses investigated (samples B-11-14 and B-16-14) were collected on the south-west extension of the Barchi-Kol terrane (Fig. 1b), described previously by Shatsky et al. (Reference Shatsky, Skuzovatov, Ragozin and Sobolev2015). The samples have a medium- to coarse-grained texture without obvious foliation. Rock-forming minerals are kyanite, garnet, quartz, phengite, muscovite, biotite, and feldspar. Accessory minerals are graphite, zircon, rutile, apatite, monazite, allanite, dumortierite, tourmaline, siderite, baryte, pyrrhotite and UHP relicts; diamond and coesite. A characteristic feature of these types of rocks is the abundance of diamond inclusions (up to 20 μm) in kyanite (Fig. 2a), garnet (Fig. 2b) and zircon (Fig. 2c). Zircon was identified in the samples studied as inclusions in garnet (Fig. 2e,g) and kyanite (Fig. 2h) as well as in the rock matrix (Fig. 2c,d,f). A more detailed petrographic description of the diamondiferous kyanite gneisses from the Barchi-Kol terrane is provided elsewhere (Shatsky et al., Reference Shatsky, Skuzovatov, Ragozin and Sobolev2015; Shchepetova et al., Reference Shchepetova, Korsakov, Mikhailenko, Zelenovskiy, Shur and Ohfuji2017).
Photomicrographs (transmitted light) of the investigated diamondiferous kyanite gneiss. Diamond was identified as inclusions in kyanite (a), garnet (b) and zircon (c). Zircon occurs in the rock matrix (c,d,f) and as inclusions in garnet (e,g) and kyanite (h). Mineral abbreviations are after (Whitney and Evans, Reference Whitney and Evans2010).

Methods
The rock samples were crushed, and the zircon separated by conventional heavy-mineral separation techniques were then placed in 25 mm diameter epoxy mounts. The zircons were ground to about half their thickness and polished with a diamond paste. The identification of mineral inclusions in zircon was carried out by optical microscopy using an Olympus BX-51 microscope combined with an Olympus COLOR VIEW III camera and by Raman spectroscopy with a confocal Horiba Jobin-Yvon LabRam HR 800 spectrometer at the Analytical Centre for multi-element and isotope research (Sobolev Institute of Geology and Mineralogy SB RAS, Novosibirsk, Russia). Raman imaging of zircon was undertaken using an Alpha300 AR confocal Raman microscope (WITec GmbH, Germany) at the School of Natural Sciences and Mathematics, Ural Federal University, Ekaterinburg, Russia. The acquisition parameters for the Raman imaging are given in Table 1. The determination of Ti concentrations in zircon for the ‘Ti-in-zircon’ geothermometer was performed at the Common Use Centre of the Ural Branch of RAS “Geoanalyst” (Zavaritsky Institute of Geology and Geochemistry UB RAS, Ekaterinburg, Russia) using a Cameca SX100 electron microprobe equipped with five wavelength-dispersive spectrometers. Titanium concentrations were registered simultaneously on four spectrometers for a 400 s acquisition time using PET and LPET analysing crystals. Accelerating voltage was 15 kV and sample current was 200 nA. The detection limit of Ti in zircon was 12 ppm. Panchromatic CL-images of zircon were obtained using a Cameca SX100 electron microprobe with a current of 4 nA. The contents of HfO2, ThO2 and UO2 were measured using a Jeol JXA-8100 electron probe microanalyser at the Analytical Centre for multi-elemental and isotope research SB RAS with a 20 kV accelerating voltage, 200 nA beam current, 2–3 μm beam spot and analysis time 20 s/20 s (peak/background) for HfO2 and 180 s/180 s for ThO2 and UO2. The detection limits of Hf, U and Th in zircon were 413, 19 and 20 ppm, respectively. To estimate temperature using the ‘Zr-in-rutile’ geothermometer (Watson et al., Reference Watson, Wark and Thomas2006; Ferry and Watson, Reference Ferry and Watson2007; Tomkins et al., Reference Tomkins, Powell and Ellis2007), Zr concentrations in rutile grains derived from the same rock samples were measured using a Jeol JXA-8100 electron probe microanalyser equipped with five wavelength-dispersive spectrometers (accelerating voltage of 20 kV, beam current of 150–200 nA, beam spot of 2–3 μm, and analysis time 180 s/90 s). The detection limit of Zr in rutile was 19 ppm.
Experimental parameters for 2D Raman mapping by an Alpha 300 AR confocal Raman microscope

Results
Zircon characterisation
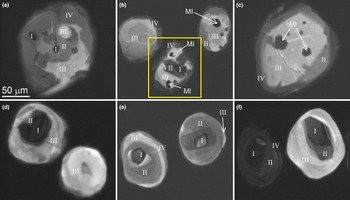
Zircon from the examined separates occurs as rounded grains 50–200 μm in size. Our combined CL, EPMA and Raman spectroscopy investigation revealed noticeable internal heterogeneity. In the CL mode, the zircons consist of a series of distinct domains that form ‘spotted’ zonation (Fig. 3a), or, occasionally, concentric zoning patterns (Fig. 3b–f). A summary of the zircon domain characteristics obtained by the study of 40 grains is provided in Table 2 and a detailed description of each zone is given below.
Cathodoluminescence images of zircon with ‘spotted’ (a) and concentric (b–f) zoning patterns. MI – mineral inclusions, Roman numerals I–IV denote distinct zircon domains. The zircon outlined by a yellow rectangle was selected for 2D Raman mapping.

Key characteristics of the distinct zircon domains.

bdl – element concentration is below the detection limit.
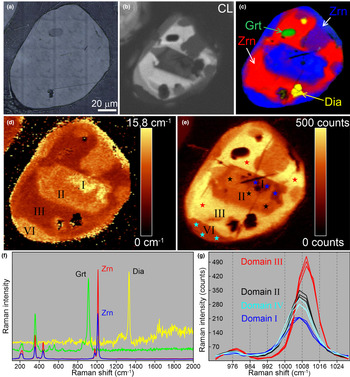
We have subdivided zircon into four domains, based on their CL signature. Domain I represents rounded zircon cores visible in transmitted light (Fig. 2e). These cores are up to 30 μm in diameter and host inclusions of low-pressure (LP) minerals (graphite and quartz). Occasionally, the zircon cores show oscillatory zoning (Fig. 3e). The cores are commonly surrounded by radial fractures and display low CL intensity (Fig. 3), suggesting a greater degree of metamictisation compared with other domains. The zircon cores can also be distinguished in the Raman maps (Fig. 4) of the ν3(SiO4) band by the highest values of the full width at half maximum (FWHM) (15.5–15.7 cm–1) (Fig. 4d) and the lowest values of the peak intensities (Fig. 4e,g). The cores have the highest U (up to 1494 ppm) and HfO2 (up to 2.15 wt.%) concentrations of all the zircon domains, whereas Ti content is below the detection limit (<12 ppm) and Th amounts range up to 115 ppm (Table 2).
Graphical representation of the analytical data for a representative zircon from the diamondiferous gneiss: (a) reflected-light image, (b) CL image; (c) 2D Raman spectra map showing zircon-hosted inclusions (green, garnet; yellow, diamond; red and blue, host zircon); (d) 2D Raman map of the ν3(SiO4) peak full width at half maximum variations (cm–1); (e) 2D Raman map of the ν3(SiO4) intensity variations (counts) with star symbols indicating single point Raman measurements; (f) representative Raman spectra of garnet (green) and diamond (yellow) inclusions in the zircon (red and blue); (g) representative Raman spectra of different zircon domains; the colour of each spectrum corresponds to the colour of the stars in (e). Mineral abbreviations are after Whitney and Evans (Reference Whitney and Evans2010).

Domain II comprises the inner mantles that surround the inherited cores. These inner mantles are devoid of inclusions and are undetectable in transmitted light, yet they were evidently distinguishable by CL and Raman imaging. This domain shows a moderate CL emission (Fig. 4b), high FWHM values of the ν3(SiO4) band (11.4–12.3 cm–1) (Fig. 4d) and a low ν3(SiO4) peak intensity (Fig. 4e,g). The inner mantles are characterised by lower U (196–242 ppm), Th (below detection limit) and HfO2 (up to 1.82 wt.%) concentrations compared with those in the cores, whereas Ti abundance reaches 44 ppm (Table 2).
Domain III represents the outer mantles hosting numerous inclusions of cuboctahedral diamond crystals (up to 20 μm) with subsidiary coesite, garnet, graphite and rutile (Fig. 4f). In CL images this domain appears as a zone with the highest CL intensity of the recognised domains (Fig. 4b), whereas in the Raman maps of the ν3(SiO4) band, Domain III can be identified by the lowest FWHM (9.6–10.5 cm–1) (Fig. 4d) and the highest peak intensity (Fig. 4e). The main ν3(SiO4) band in the Raman spectra of Domain III is clearly shifted to higher wavenumbers (Fig. 4g). The outer mantles also differ from the other domains by the absence of U and Th and the highest Ti levels (up to 64 ppm); the HfO2 content remains constant compared to the inner mantle (Table 2).
Domain IV constitutes inclusion-free overgrowths of Domain III and can be clearly identified in CL images by a dark signal (Fig. 4b). The Raman maps demonstrate high FWHM (13.4–13.5 cm–1) (Fig. 4d) and low values of peak intensities of the ν3(SiO4) band in this zone (Fig. 4e,g). U and Th contents vary from 97 to 696 ppm and from below detection limit to 447 ppm, respectively. The HfO2 content is between 1.62 and 1.89 wt.%. As in Domain I, the Ti abundance in Domain IV is below the limit of detection (<12 ppm) (Table 2).
There is a clear negative correlation between the FHWM of the ν3(SiO4) Raman band and its position in the zircon domains (Fig. 5). This relationship has been established recently for zircon inclusions in garnet megablasts from the Dora Maira massif (Campomenosi et al., Reference Campomenosi, Rubatto, Hermann, Mihailova, Scambelluri and Alvaro2020).
(a) 2D Raman map of the ν3(SiO4) peak full width at half maximum variations (cm–1) with star symbols indicating single point Raman measurements; (b) FWHM vs. Raman shift of the ν3(SiO4) band (~1008 cm–1) of different zircon domains. The representative Raman spectra of distinct zircon domains were acquired using an Alpha300 AR confocal Raman microscope (diffraction grating of 600 gr/mm, excitation wavelength = 488 nm)

Raman spectroscopy of diamond included in zircon
The FWHM values and peak position of the main Raman band (1332 cm–1) of the diamond inclusions in zircon vary from 5.8 to 6.8 and from 1332.5 to 1333.5 cm–1, respectively. These values are similar to those obtained previously for diamond crystals from various types of rocks within the Kokchetav massif (Perraki et al., Reference Perraki, Korsakov, Smith and Mposkos2009; Shimizu and Ogasawara, Reference Shimizu and Ogasawara2014; Korsakov et al., Reference Korsakov, Toporski, Dieing, Yang and Zelenovskiy2015). In the FWHM vs. peak position plot (Fig. 6), the points form a distinct field that partially overlaps with the data of Perraki et al. (Reference Perraki, Korsakov, Smith and Mposkos2009). Compared to possibly radiation-damaged microdiamond inclusions in zircon cores from tourmaline-rich quartzofeldspathic rock (Shimizu and Ogasawara, Reference Shimizu and Ogasawara2014), the main Raman peak of the diamonds examined here is generally shifted to higher wavenumbers (Fig. 6). In addition to the main diamond Raman band (1332 cm–1), we have also identified less intensive peaks at ~1490 cm–1 and ~1630 cm–1. The appearance of the two additional peaks in the diamond Raman spectrum might result from radiation damage of diamond inclusions during α-particle emission from radioactive decay of U and Th in host zircon (Orwa et al., Reference Orwa, Nugent, Jamieson and Prawer2000; Shimizu and Ogasawara, Reference Shimizu and Ogasawara2014).
Plots of FWHM vs. peak position of the main Raman band (1332 cm–1) of microdiamonds. The occurrence (host mineral) of microdiamond is indicated in the legend.

Discussion
The combined application of the CL, Raman spectroscopy and EPMA techniques revealed complex internal zoning patterns of zircon from the diamondiferous kyanite gneisses studied. As a rule, ‘spotted’ zoning in zircon (Fig. 3a) is hard to interpret, as such zircons contain very few inclusions and the size of distinct domains is too small to allow reliable in situ isotope-geochemical studies to be performed. By contrast, zircons with concentric zoning are favourable for the reconstruction of their growth stages, as it is possible to obtain temperature estimates for each domain via the application of the Ti-in-zircon geothermometer.
The experimental studies performed at high PT parameters showed Ti content in zircon exhibits a linear dependence on temperature (Watson et al., Reference Watson, Wark and Thomas2006; Ferry and Watson, Reference Ferry and Watson2007). The low Ti concentrations (<12 ppm) in the zircon cores (Domain I) and rims (Domain IV) indicate formation temperatures below 760°C using the Ti-in-zircon geothermometer of Ferry and Watson (Reference Ferry and Watson2007). The temperatures obtained for the inner inclusion-free mantles (Domain II) range from 760 to 880°C, whereas for the diamond-bearing outer mantles (Domain III) the temperatures are 900 ± 30°C.
Note, however, that the Ti-in-zircon geothermometer is based on an experimental data set at pressures of ~1 GPa. At higher pressures (e.g. those required for the formation of the diamond-grade kyanite gneisses examined here) this geothermometer is known to give overestimated temperature values (Tailby et al., Reference Tailby, Walker, Berry, Hermann, Evans, Mavrogenes, O'Neill, Rodina, Soldatov and Rubatto2011; Stepanov et al., Reference Stepanov, Rubatto, Hermann and Korsakov2016b). The Zr-in-rutile geothermometer based on the solubility of ZrO2 in rutile coexisting with zircon and quartz is also extensively applied to estimate peak metamorphic temperatures (Watson et al., Reference Watson, Wark and Thomas2006; Ferry and Watson, Reference Ferry and Watson2007; Tomkins et al., Reference Tomkins, Powell and Ellis2007). A study of pressure dependence of the Zr-in-rutile geothermometer revealed that a correction of temperature values is needed at pressures exceeding 4 GPa (Tomkins et al., Reference Tomkins, Powell and Ellis2007; Stepanov et al., Reference Stepanov, Rubatto, Hermann and Korsakov2016b). Taking into account the corrections proposed by Stepanov et al. (Reference Stepanov, Rubatto, Hermann and Korsakov2016b) for UHP conditions, high Zr contents in rutile grains from the kyanite gneisses studied (up to 900 ppm) yield temperature values of 900 ± 30°C (for 5 GPa).
In the following discussion we reconcile the temperature estimates obtained with the inclusion mineralogy within particular zircon domains and literature data. The first detailed studies of zircons from the Kokchetav UHPM rocks were performed ~30 years ago (Claoué-Long et al., Reference Claoué-Long, Sobolev, Shatsky and Sobolev1991; Sobolev et al., Reference Sobolev, Shatsky, Vavilov and Goryainov1991). Zircon cores from biotite-garnet diamondiferous gneiss with radiometric ages of ca. 1981 Ma were interpreted as being of detrital or pre-metamorphic origin (Claoué-Long et al., Reference Claoué-Long, Sobolev, Shatsky and Sobolev1991). Subsequently, Katayama et al. (Reference Katayama, Zayachkovsky and Maruyama2000, Reference Katayama, Maruyama, Parkinson, Terada and Sano2001), Hermann et al. (Reference Hermann, Rubatto, Korsakov and Shatsky2001), and Stepanov et al. (Reference Stepanov, Rubatto, Hermann and Korsakov2016b) supported this suggestion by a study of inclusions of LP minerals in inherited zircon cores from diamondiferous rocks of the Kokchetav massif. The presence of oscillatory zoning in zircon is commonly regarded as a signature of magmatic origin (e.g. Corfu et al., Reference Corfu, Hanchar, Hoskin, Kinny, Hanchar and Hoskin2003; Wu and Zheng, Reference Wu and Zheng2004); such zoning patterns have also been observed in this study (Fig. 3e). In contrast, some zircon cores from the diamondiferous Kokchetav rocks described by Katayama et al. (Reference Katayama, Maruyama, Parkinson, Terada and Sano2001) and Shimizu and Ogasawara (Reference Shimizu and Ogasawara2014) contain microdiamonds, indicating formation of these cores under UHP conditions. Generally, zircons cores from Kokchetav diamondiferous rocks have ages of 520–1981 Ma (Claoué-Long et al., Reference Claoué-Long, Sobolev, Shatsky and Sobolev1991; Katayama et al., Reference Katayama, Maruyama, Parkinson, Terada and Sano2001; Hermann et al., Reference Hermann, Rubatto, Korsakov and Shatsky2006; Stepanov et al., Reference Stepanov, Rubatto, Hermann and Korsakov2016b); however, Rubatto and Hermann (Reference Rubatto and Hermann2007) proposed that the cores could be “isotopically disturbed” and thus had yielded unreliable ages. There is also an issue of radiometric age determination accuracy for relatively old metamorphic rocks, namely that the ages of distinct metamorphic stages overlap within the value of radiometric age determination uncertainty (Rubatto et al., Reference Rubatto, Liati and Gebauer2003; Hermann et al., Reference Hermann, Rubatto, Korsakov and Shatsky2006).
Nevertheless, the zircon cores examined here (Domain I) appear to be of detrital origin, which is inferred from their low Ti abundances, inclusions of LP minerals and oscillatory zoning patterns. Katayama et al. (Reference Katayama, Zayachkovsky and Maruyama2000) and Hermann et al. (Reference Hermann, Rubatto, Korsakov and Shatsky2001) showed that zircon cores are surrounded by mantles with coesite and diamond inclusions providing evidence for the UHP formation of the mantles. In our study, the inherited (probably magmatic) zircon cores (Domain I) are surrounded by the inclusion-free inner mantles (Domain II), which, however, have relatively high Ti contents (up to 40 ppm) testifying to their formation at the temperatures up to 880°C, i.e. during the prograde metamorphic stage. Some zircon grains do not contain cores (Domain I) or inner mantles (Domain II), which can be explained by different grain size, and, therefore, different cross-section depth.
However, the inclusions of UHP mineral indicators, coesite and diamond, were identified in the outer mantles (Domain III) and unambiguously indicate that the outer mantles crystallised near the peak metamorphic conditions. The temperature estimates obtained using the Ti-in-zircon geothermometer for Domain III (900 ± 30°C) are consistent with those afforded by the Zr-in-rutile geothermometer for the diamondiferous rocks of the Kokchetav massif (900 ± 30°C; Stepanov et al., Reference Stepanov, Rubatto, Hermann and Korsakov2016b), which further proves the outer mantles of the zircon grains to have been formed near the peak of metamorphism.
Finally, the low Ti content in the zircon rims (Domain IV), as well as the absence of diamond/coesite inclusions in this zone, probably indicates their formation on the retrograde metamorphic stage during exhumation and cooling (Stepanov et al., Reference Stepanov, Hermann, Rubatto, Korsakov and Danyushevsky2016a). This conclusion is convincingly supported by the U–Pb ages of Kokchetav zircon rims that are much younger than the peak of metamorphism (Hermann et al., Reference Hermann, Rubatto, Korsakov and Shatsky2001; Katayama et al., Reference Katayama, Maruyama, Parkinson, Terada and Sano2001).
Summary
The comparison of CL and Raman spectroscopy data revealed that the discrete zircon domains detected in the CL images are reproduced clearly in the Raman maps of the 1008 cm–1 peak FWHM and position. Hence, zircon internal textures can also be deciphered by Raman spectroscopy, especially for the case of unexposed zircon grains, whose study by CL methods is impossible. The evidence we have obtained on the complex internal zircon texture implies a close genetic link between the observed zircon domains and episodes of its growth. The heterogeneity of the zircon interior together with the distribution of mineral inclusions in individual domains implies multi-stage crystallisation. The cores (Domain I) are of pre-metamorphic (magmatic) origin (<760°C), inner mantles (Domain II) were formed during the prograde metamorphic stage (760–880°C), diamond-bearing outer mantles (Domain III) crystallised near the peak metamorphic conditions (900 ± 30°C), and rims (Domain IV) were formed during the retrograde stage (<760°C). The combined application of CL, Raman spectroscopy and EPMA techniques to zircon is thus regarded as a powerful approach in revealing distinct growth events recorded by this unique mineral.
Acknowledgements
This work was performed within the IGM SB RAS and IGG UB RAS (No. AAAA-A19-119071090011-6) state assignment projects. Financial support was provided by RFBR project no. 19-35-90002. D.I.R. was supported by the research grant program of the President of the Russian Federation for young Russian scientists (МК-971.2020.5). The equipment of the Ural Centre for Shared Use “Modern Nanotechnologies”, Ural Federal University, and the Common Use Centre of the Ural Branch of RAS “Geoanalyst” was used. We thank journal editor Roger Mitchell for efficient handling of the manuscript and Tatsuki Tsujimori and an anonymous reviewer for their helpful comments and suggestions that improved the quality of the report.