1. Introduction
Most actuarial calculations and demographic projections involve assumptions about the future. In life insurance in particular, the future trajectories of mortality trends are of crucial importance because unanticipated mortality improvements (Willets, Reference Willets1999) can have detrimental effects not only on the planning of national social programs but also on the financial stability of the insurance industry, including pension plans and annuities.
Various mortality projection models have been proposed and developed successfully, including the Lee–Carter model and its extensions (Lee & Carter, Reference Lee and Carter1992; Renshaw & Haberman, Reference Renshaw and Haberman2006; Brouhns et al., Reference Brouhns, Denuit and Vermunt2002; Delwarde et al., 2007; Debón et al., Reference Debón, Martnez-Ruiz and Montes2010), the Cairns-Blake-Dowd model and its extensions (Cairns et al., Reference Cairns, Blake and Dowd2006; Cairns et al., Reference Cairns, Blake, Dowd, Coughlan, Epstein, Ong and Balevich2009; Plat, 2009), and P-splines smooth models (Currie et al., Reference Currie, Durban and Eilers2004; Currie et al., Reference Currie, Durban and Eilers2006; CMI, 2006; Djeundje & Currie, Reference Djeundje and Currie2010; Biatat & Currie, Reference Biatat and Currie2010) among others. These models are built on different assumptions and they often yield different projected trends. Thus, in practice, using several projection models generally gives more insight into the potential directions of mortality improvements than using a single model; see Debón et al. (Reference Debón, Martnez-Ruiz and Montes2010), Woods (Reference Woods2016), Richards et al. (Reference Richards, Currie and Ritchie2014), and Richards et al. (Reference Richards, Currie, Kleinow and Ritchie2017) for discussion and illustration.
There is a role for flexible models that can integrate emerging information or expert opinions in such a way that the impact of these opinions can be switched on or off. Indeed, this would allow better understanding and greater scrutiny of the financial implications of potential mortality trajectories. However, a common feature of current mortality projection models is that they are extrapolative. That is, they are built on historical data and the resulting projected trends are continuations of past behaviour in mortality rates. As such, these models are not flexible enough to allow a direct incorporation of external opinions (or expert judgement) in the calibration process or in the exploration of 1-in-200 years type events.
The desire to incorporate opinions into mortality forecasting is not new (Janssen & Kunst, Reference Janssen and Kunst2007; Stoeldraijer et al., Reference Stoeldraijer, van Duin, van Wissen and Janssen2013). In this context, short-term projections are usually treated separately from long-term forecasts, and the former is based on the general principle that the near future resembles the recent past (Andreev & Vaupel, Reference Andreev and Vaupel2006). However, long-term projections are tricky and the outcome crucially depends on the choices made as part of the forecasting procedure. For example, it is well known that the use of general extrapolative mortality forecasting methods can yield unlikely future patterns in the long run (Currie, Reference Currie2015; Janssen et al., Reference Janssen, Van Wissen and Kunst2013).
One way to overcome these issues is to include information about the determinants of past trends in the mortality forecast. For example, several studies have attempted to incorporate epidemiological information into mortality forecasting; see French & O’Hare (Reference French and O’Hare2014), Janssen et al. (Reference Janssen, Van Wissen and Kunst2013) or Preston et al. (Reference Preston, Stokes, Mehta and Cao2014) among others.
In the context of longevity insurance, actuaries find alternative ways to account for expert opinions in their pricing and liability calculations. For longevity risk in the UK for instance, mortality opinions are often expressed in terms of long-term mortality improvements and are incorporated into the calculation process via a two-stage procedure. The first stage consists of fitting a mortality model without forecasting, and the second stage is to draw sensible lines between the fitted rates and the assumed long-term rate (CMI, 2006, 2016). However, there are caveats with this type of procedure. For example, it can lead to discontinuities as one moves from the past into the future. In addition, the speed or direction of travel are subjective. Furthermore, it is difficult to quantify the uncertainty around the projected mortality trends from such a procedure, unless one relies on some post adjustments of the output from a separate stochastic mortality model; see for example Cairns (Reference Cairns2017).
In this work, we present a direct method for the incorporation of deterministic opinions into the smoothing and forecasting of mortality rates. Our method is built in the framework of P-splines (Eilers & Marx, Reference Eilers and Marx1996; Currie et al., Reference Currie, Durban and Eilers2004) and the estimation methodology is adapted from the contained equations in Currie (Reference Currie2013).
The reason for choosing P-splines framework is that, not only does it allow the smoothing of the data and forecasting to be performed in one stage, but also, the framework is flexible enough to handle even extreme opinion specifications. Our contribution is (a) to show how to appropriately reparameterise deterministic opinions stated in terms of standard mortality metrics into the model, (b) to describe how to calibrate a P-splines mortality model in conjunction with opinion inputs in such a way that the resulting mortality trends are a combination of the signals from past trends and the expert opinions, (c) to quantify the amount of uncertainty around the central projected trends conditional on the opinion inputs, and (d) to apply our method to real-world mortality data under various opinion scenarios.
There are many alternative smoothing frameworks in the literature including kernel smoothing, splines smoothing, locally weighted regression, direct smoothing, etc. A comparison of some of these methods in the mortality context was carried out by Debón et al. (Reference Debón, Montes and Sala2006). More recently, Ludkovski et al. (Reference Ludkovski, Risk and Zail2018) described how mortality smoothing can be carried out through a kernel method within a Gaussian Process framework, and illustrated how this can be implemented in a Bayesian way using Markov Chain Monte Carlo method. An attractive feature of the Bayesian method resides in the possibility to incorporate stochastic prior information by specifying prior distributions for the model parameters.
In practice in the longevity industry however, the use of deterministic opinions remains very popular (CMI, 2006, 2016). In addition, prior opinions are often formulated on the scale of standard mortality metrics; the conversion of such prior specifications into prior distributions on model parameters is not always straightforward. Our work in this study focuses on the incorporation of deterministic opinions via penalty and constraints. In particular, we show how opinions stated directly in terms of popular mortality metrics can be built into a smooth mortality model using well-known statistical techniques. The method of P-spline is our underlying smoothing method. A detailed exploration of the benefits of P-splines compared to other smoothing methods can be found in Eilers & Marx (Reference Eilers and Marx2010). For example, the resulting smooth surface can be decomposed into an age component, a time component, and an interaction term through the underlying difference penalty. A thorough description and illustration of this within the spatio-temporal framework can be found in Lee & Durban (Reference Lee and Durban2011).
This paper is organised as follows. Section 2 provides a brief overview of mortality smoothing using the method of P-splines and discusses some practical challenges often encountered in the actuarial mortality context. Section 3 describes how to incorporate deterministic opinions into mortality smoothing and forecasting. Section 4 presents some applications of our method, and we close with some concluding remarks in Section 5.
2. Smoothing Mortality Data
Our approach to the incorporation of opinion inputs requires a flexible smooth modelling framework to start with.
Thus, in this section, we begin with a brief description of the flexible method of P-splines smoothing as it applies to mortality data, and set up some notation for the rest of the paper. For ease of presentation, we shall start in one dimension and then move to two dimensions.
2.1 Smoothing mortality data in one dimension
Let us consider mortality at a given age, x, for calendar years from
 $t_1$
to
 $t_{n}$
in ascending order, and let us denote by
 ${\textbf{D}}_x=(D_{1},...,D_{n})$
and
 ${\textbf{E}}_x=(E_{1},...,E_{n})$
the vectors of death counts and central exposed-to-risk, respectively.
A standard way to estimate trends from aggregated mortality data is based on the assumption that the death experience follows a PoissonFootnote 1 distribution with mean proportional to the exposed-to-risk:
 \begin{eqnarray}D_{j}\; \sim \; \mathcal{P}oisson \left(E_{j}\times\mu_{j}\right),\;g(\mu_j)=\mathcal{S}(t_j)\end{eqnarray}
where
 $\mu_{j}$
represents the force of mortality in calendar year
 $t_j$
, g is the link function, and
 $\mathcal{S}$
is a smooth function that we want to estimate and extrapolate.
There are several ways to estimate a smooth function, one of the most appealing approaches being the method of P-splines (Eilers & Marx, Reference Eilers and Marx1996; Currie et al., Reference Currie, Durban and Eilers2004).
The method shares several features with standard regression. In particular, it involves expressing the smooth function
 $\mathcal{S}$
as a linear combination of a basis of B-splines:
 \begin{eqnarray}\mathcal{S}(t) = \sum_{k=1}^{c} B^{\{k\}}(t)\,\times\, \theta_k\end{eqnarray}
where the
 $B^{\{k\}}(t)$
,
 $1\leq k \leq c$
, represent the values of the B-spline functions at time t, and the
 $\theta_k$
denote the regression coefficients associated with the B-spline basis.
In practice, the smooth aspect of the model is achieved by penalising differences in adjacent coefficients via the optimisation of the penalised log-likelihood,
 $\ell_P$
, given by
 \begin{eqnarray}\ell_P({\boldsymbol{\theta}}) = \ell({\boldsymbol{\theta}}) - {\boldsymbol{\theta}}'{\textbf{P}}_{\lambda}{\boldsymbol{\theta}}, \quad\text{with}\; {\textbf{P}}_{\lambda}=\lambda{\boldsymbol{\Delta}}'{\boldsymbol{\Delta}}\end{eqnarray}
In this expression,
 ${\boldsymbol{\theta}}=(\theta_1,...,\theta_{c})'$
represents the joint vector of coefficients,
 $\ell({\boldsymbol{\theta}})$
is the ordinary Poisson log-likelihood arising from (1),
 ${\textbf{P}}_{\lambda}$
is the roughness penalty matrix,
 $\lambda$
is the scalar smoothing parameter, and
 ${\boldsymbol{\Delta}}$
is the difference matrix operator. In practice, the second-order difference is often preferred because it produces sufficient flexibility over the data range, and when used for forecasting, the shape of the extrapolated spline coefficients ties reasonably well with that of the fitted coefficients, provided there is a sufficiently strong signal in the forecasting direction.
If we denote by
 ${\textbf{t}}$
the joint vector of time points, i.e.
 ${\textbf{t}}=(t_1,...,t_{n})$
, by
 ${\textbf{B}}_{{\textbf{t}}}$
the matrix of B-splines along the time points
 ${\textbf{t}}$
, i.e.
 ${\textbf{B}}_{{\textbf{t}}}=[B^{\{1\}}({\textbf{t}})\,:\cdots:\,B^{\{c\}}({\textbf{t}})]$
, then, the value of the coefficient vector that maximises the penalised log-likelihood in (3) is found by solving the following penalised version of the scoring algorithm:
 \begin{eqnarray}\left({\textbf{B}}^{\prime}_{{\textbf{t}}}\,\tilde{{\textbf{W}}}{\textbf{B}}_{{\textbf{t}}} \,+\, {\textbf{P}}_{\lambda}\right)\hat{{\boldsymbol{\theta}}}={\textbf{B}}^{\prime}_{{\textbf{t}}}\;\tilde{{\textbf{W}}}\, \tilde{{\textbf{z}}},\end{eqnarray}
where
 ${\textbf{W}}$
is the diagonal weight matrix and
 ${\textbf{z}}$
is the so-called working variable; tilde (
 $^{\sim}$
) refers to an approximate solution, and hat (
 ${\hat{\,}}$
) refers to an improved estimate (Currie et al., Reference Currie, Durban and Eilers2004).
Actuaries often need to forecast mortality into the far future when calculating present values of pension and annuity liabilities. With the method of P-splines, mortality projection is treated as a missing data problem, and the penalty is used to fill-in the missing data. For example, let us consider mortality data for calendar years
 ${\textbf{t}}=(t_1, ..., t_{n})$
. To forecast for r years into the future, these r future years are first appended to
 ${\textbf{t}}$
and the B-splines are computed along the augmented time vector
 ${\textbf{t}}_+=(t_1, ..., t_{n} , t_{n+1}, ..., t_{n+r})$
. Thus, the original
 $n\times c$
B-spline matrix
 ${\textbf{B}}_{{\textbf{t}}}$
becomes an augmented
 $(n+n_+{}) \times c_+$
matrix of B-splines in time. Accordingly, an augmented iterative system similar to (4) is solved, yielding estimates of the spline regression coefficients for both the data and forecasting regions.
So far, we have overlooked a very important issue: the choice of the smoothing parameter,
 $\lambda$
. To provide a reasonable balance between the conflicting characteristics of goodness-of-fit and parsimony,
 $\lambda$
is often selected as the minimiser of the Bayesian Information Criteria (BIC)given by
 \begin{equation}\text{BIC} = \text{Deviance} + \log(n)\times \text{ED}\end{equation}
where ED represents the effective dimension of the model.
2.2 Smoothing mortality data in two dimensions
Population mortality data are generally available in a two-dimensional form.
The P-spline machinery in this context works by analogy to the one-dimensional case.
Let us denote by
 ${\textbf{x}} = (x_1,...,x_{n_1})$
and
 ${\textbf{t}} = (t_1,...,t_{n_2})$
the vectors of age and year indices. Also, let
 ${\textbf{D}}$
represents the
 $n_1 \times n_2$
table of death counts and
 $D_{ij}$
the entry of
 ${\textbf{D}}$
corresponding to age
 $x_i$
in calendar year
 $t_j$
. Similarly, let
 ${\textbf{E}}$
and
 $E_{ij}$
represent corresponding quantities in the exposure data; i.e.
 ${\textbf{E}}$
is the
 $n_1 \times n_2$
matrix of exposed-to-risk of death, and
 $E_{ij}$
is its entry corresponding to age
 $x_i$
and calendar year
 $t_j$
. The basic model assumption (1) is extended to
 \begin{eqnarray}D_{ij}\; \sim \; \mathcal{P}oisson \left(E_{ij}\times\mu_{ij}\right),\;g(\mu_{ij})=\mathcal{S}(x_i, t_j)\end{eqnarray}
where
 $\mathcal{S}$
is now a bivariate smooth function.
To estimate
 $\mathcal{S}$
, we express it in terms of marginal bases of B-splines in age and time; i.e.
 \begin{eqnarray}\mathcal{S}(x_i, t_j) = \sum_{k=1}^{c_1} \sum_{l=1}^{c_2} B_1^{\{k\}}(t_j)\times B_2^{\{l\}}(x_i)\,\times\, \Theta_{kl}\end{eqnarray}
where the
 $B_1^{\{k\}}$
and
 $B_2^{\{l\}}$
are marginal B-splines in age and time, respectively, and the
 $\Theta_{kl}$
are coefficients to be estimated.
Let us denote by
 ${\boldsymbol{\Theta}}$
the
 $c_1\times c_2$
matrix whose entries are the
 $\Theta_{kl}$
. By analogy to the one-dimensional case, the smoothness of the model is achieved by penalising the rows and columns of
 ${\boldsymbol{\Theta}}$
. If we denote by
 ${\boldsymbol{\theta}}$
the
 $c_1c_2$
-length vector obtained by stacking the columns of
 ${\boldsymbol{\Theta}}$
, i.e.
 ${\boldsymbol{\theta}}=vec({\boldsymbol{\Theta}})$
, then, this two-dimensional penalisation of the rows and the columns of
 ${\boldsymbol{\Theta}}$
is equivalent to applying the penalty matrix
 ${\textbf{P}}_{\lambda_1,\lambda_2}$
on the coefficient vector
 ${\boldsymbol{\theta}}$
, where
 \begin{equation}{\textbf{P}}_{\lambda_1,\lambda_2} = \lambda_1\left({\textbf{I}}_{c_1}\otimes {\boldsymbol{\Delta}}^{\prime}_1{\boldsymbol{\Delta}}_1\right) + \lambda_2\left({\boldsymbol{\Delta}}^{\prime}_2 {\boldsymbol{\Delta}}_2 \otimes {\textbf{I}}_{c_1}\right)\cdot\end{equation}
In this expression,
 $\lambda_1$
and
 $\lambda_2$
are smoothing parameters in age and time;
 ${\boldsymbol{\Delta}}_1$
and
 ${\boldsymbol{\Delta}}_2$
are second order difference operators in age and time;
 ${\textbf{I}}_{c}$
is the
 $c\times c$
identity matrix, and
 $\otimes$
is the Kronecker product.
With this in place, model fitting is carried out as in the one-dimensional case, but, with death data given by
 $vec({\textbf{D}})$
, exposure data
 $vec({\textbf{E}})$
, regression matrix
 ${\textbf{B}}_{{\textbf{t}}}\otimes {\textbf{B}}_{{\textbf{x}}}$
, link function g, and penalty matrix
 ${\textbf{P}}_{\lambda_1,\lambda_2}$
. Projection can also take place not only in time, but also in age, by augmentation of the relevant marginal bases as described in Section 2.1. This shall be illustrated in Section 4.
One challenge with P-splines reported in the actuarial context is what is known as the edge effects. That is, the fitted mortality rates toward the edge of the data can be unduly influenced by the relative level of experience in that final year (CMI, 2006). One may argue that this can potentially lead to unrealistic mortality forecasts.
However, it is important to bear in mind that in any forecasting method, beside the data, forecasts are also controlled by a number of key parameters. With P-splines in particular, forecasts can be controlled by the splines knots spacing, the smoothing parameters and the difference order of the penalty. Stable mortality forecasts can be achieved through appropriate selection of these parameters. See for example Richards (Reference Richards2009) on the illustration of the importance of the knots spacing, Djeundje (Reference Djeundje2011, section 5.3) on the importance of appropriate smoothing parameters, or Carballoa et al. (Reference Carballoa, Durbán and Lee2017) on the quantification of the impact of individual data points on the forecast. In addition, the incorporation of opinion inputs into the estimation process (as we shall see in the next sections) does reduce the impact of the data at the edges on the direction of the forecast, especially as one approaches the opinion points.
3. Integrating opinions into the Model
Actuaries like to investigate mortality scenarios subject to some prior or expert opinions, in conjunction with scenarios produced by full stochastic mortality projection models. These investigations are usually carried out through various metrics, including the force of mortality, mortality rates, mortality improvements, or mortality reduction factors. In the projection method used by CMI (2006, 2016) for instance, an important component of the user’s opinions is specified in terms of long-term rates of mortality improvements.
In this section, we look at how to build deterministic opinions into mortality smoothing and forecasting. For ease of presentation, we shall assume that any opinions about mortality can be expressed clearly on the scale of the force of mortality (equivalently, mortality rates) or in terms of mortality improvements (equivalently, mortality reduction factors). We start in one dimension as in Section 2. Thus, let us consider mortality data
 ${\textbf{D}}_x$
and
 ${\textbf{E}}_x$
at a given age, x, for calendar years
 ${\textbf{t}}= (t_1,...,t_{n})$
.
3.1 Incorporating deterministic opinions about the force of mortality
On the scale of the force of mortality, we are interested in projection scenarios in which the force of mortality at age x in calendar years
 ${\textbf{t}}_o=(t_{o1},...,t_{ou})$
is known a priori, where u is an integer. We shall denote by,
 $\mathring{\mu}_{{}_{x,t_{ok}}}$
, the a priori value of the force of mortality at age x and calendar year
 $t_{ok}$
,
 $k=1,...,u$
.
For example, let us consider mortality data at age,
 $x=60$
, for calendar years,
 ${\textbf{t}}=(1970, \ldots, 2010)$
. We might want to fit a smooth line to these data and forecast the trend into future in such a way that the forecast values of the force of mortality at calendar years
 ${\textbf{t}}_o=(2025, 2030)$
are set to
 $\mathring{\mu}_{60,2025}=0.006$
and
 $\mathring{\mu}_{60,2030}=0.005$
.
In general, let us assume that we want to estimate and forecast a smooth mortality trend to the data as described in Section 2, but, such that the mortality trend fulfils the following conditions:
 \begin{equation} \mu_{{}_{x,t_{ok}}} = \mathring{\mu}_{{}_{x,t_{ok}}}, \; 1\leq k \leq u\end{equation}
where
 $ \mathring\mu_{{}_{x,t_{ok}}}$
are known values of the force of mortality at age x in calendar years
 $t_{ok}$
, and
 $\mu_{x,t_{ok}}$
denotes the fitted force of mortality. The
 $\mathring\mu_{{}_{x,t_{ok}}}$
represent prior opinion inputs on the scale of the force of mortality.
This prior opinion (9) imposes some restriction on the shape and trajectory of the fitted mortality trend. We will refer to this type of equations as the opinion constraints. There is no restriction on the time locations
 $t_{ok}$
’s of these opinion constraints.
The opinion constraints (9) can be expressed compactly as
 \begin{equation}{\textbf{B}}_{{\textbf{t}}_o}{\boldsymbol{\theta}}\,=\,g\left(\mathring{{\boldsymbol{\mu}}}_{x, {\textbf{t}}_o}\right)\end{equation}
where
 ${\textbf{B}}_{{\textbf{t}}_o}$
denotes the
 $u\times c$
sub-matrix of the B-spline matrix in (2) whose rows correspond to the opinion times
 ${\textbf{t}}_o$
; g is the link function as in (1), and
 $\mathring{{\boldsymbol{\mu}}}_{x, {\textbf{t}}o}=(\mathring{\mu}_{x,t_{o1}},...,\mathring{\mu}_{x,t_{ou}})$
is the joint vector of known forces of mortality.
Thus, we have defined a Penalised Generalised Linear Model with Poisson error (1)–(2), penalty matrix
 ${\textbf{P}}_{\lambda}$
, link function g, and deterministic opinions given by (10). The estimation process is described in Section 3.3 below.
3.2 Incorporating deterministic opinions about mortality improvements
Alternatively, one may want to investigate a mortality scenario in which the mortality improvement rates at a given age x in calendar years
 ${\textbf{t}}_o=(t_{o1},...,t_{ou})$
are known a priori. We shall denote by,
 $\mathring \imath_{{}_{x,t_{ok}}}$
, the a priori value of the mortality improvement rate at age x and calendar year
 $t_{ok}$
,
 $k=1,...,u$
.
For example, let us consider mortality data at age,
 $x=60$
, for calendar years,
 ${\textbf{t}}=(1970, \ldots, 2010)$
. We might want to fit a smooth line to these data and forecast the trend into future in such a way that the resulting forecast of the mortality improvement rates in calendar years
 ${\textbf{t}}_o=(2025, 2030)$
is set to
 $\mathring \imath_{60,2025}=1.5\%$
and
 $\mathring \imath_{60,2030}=1.1\%$
.
In general, let us assume that we want to fit and forecast a smooth mortality trend to the data as described in Section 2.1, but such that
 \begin{equation} \dfrac{q_{{}_{x,t_{ok}-1}} - q_{{}_{x,t_{ok}}}}{ q_{{}_{x,t_{ok}- 1}}}=\mathring \imath_{{}_{x,t_{ok}}}, \; 1\leq k \leq u\end{equation}
where
 $ \mathring \imath_{x,t_{ok}}$
are known values of mortality improvements at age x in calendar years
 $t_{ok}$
.
We propose two methods to express the opinion constraints (11) in a similar form as (10). The first method is an approximation whereas the second method is exact.
3.2.1 Approximate incorporation of mortality improvements opinions
The left-hand side of equation (11) can be expressed in terms of the force of mortality as
 \begin{align*}\dfrac{ q_{{}_{x,t_{ok}- 1}} - q_{{}_{x,t_{ok}}}}{ q_{{}_{x,t_{ok}-1}}}& = 1-\dfrac{ q_{{}_{x,t_{ok}}}}{ q_{{}_{x,t_{ok}-1}}} \nonumber \\[4pt]& = 1 - \dfrac{1-\exp\left(-\mu_{{}_{x,t_{ok}}}\right)}{1-\exp\left(-\mu_{{}_{x,t_{ok}-1}}\right)} \end{align*}
Applying the first-order Taylor expansion for “
 $\exp(y)$
" yields
 \begin{equation*} \dfrac{ q_{{}_{x,t_{ok}- 1}} - q_{{}_{x,t_{ok}}}}{\hat q_{{}_{x,t_{ok}-1}}} \approx 1- \dfrac{\mu_{{}_{x,t_{ok}}}}{ \mu_{{}_{x,t_{ok}-1}}} \nonumber \end{equation*}
Equation (11) becomes
 \begin{equation}1-\mathring \imath_{{}_{x,t_{ok}}} \approx \dfrac{ \mu_{{}_{x,t_{ok}}}}{ \mu_{{}_{x,t_{ok}-1}}}\end{equation}
Thus, assuming the Poisson canonical link, i.e.
 $g(\mu)=\ln(\mu)$
, the opinion constraints (11) can be rearranged compactly as
 \begin{equation}\left({\textbf{B}}_{{\textbf{t}}_o} - {\textbf{B}}_{{\textbf{t}}_o-\textbf{1}}\right) {\boldsymbol{\theta}}\,\approx\,\ln\left(\textbf{1}-\mathring {\imath}_{x, {\textbf{t}}o}\right)\end{equation}
where
 ${\textbf{B}}_{{\textbf{t}}_o}$
and
 ${\textbf{B}}_{{\textbf{t}}_o-1}$
denote the
 $u\times c$
sub-matrices of the B-spline matrix in (2) corresponding to the opinion time vectors
 ${\textbf{t}}_o$
and (
 ${\textbf{t}}_o-\textbf{1})$
, and
 $\textbf{1}$
is a vector of 1’s.
Hence, we have defined a Penalised Generalised Linear Model with Poisson error (1)–(2), penalty matrix
 ${\textbf{P}}_{\lambda}$
,
 $\log$
link, and deterministic opinions expressed in (13). The estimation process is described in Section 3.3 below.
3.2.2 Exact incorporation of mortality improvements opinions
Approximation (12) is valid only when the
 $\mu_{x,t_{o1}}$
and
 $\mu_{x,t_{o1}-1}$
are small. Therefore, the method in Section 3.2.1 might not be suitable for high mortality (e.g. the mortality of the very old). Alternatively, let us set the link function to
 $g(\mu) = \ln(1-\exp(-\mu))$
; that is
 \begin{equation}\ln\left(1-\exp\left(-{\boldsymbol{\mu}}_{x,{\textbf{t}}}\right)\right)={\textbf{B}}_{{\textbf{t}}}\,{\boldsymbol{\theta}}\end{equation}
The improvement opinions in (11) can then be rearranged and expressed compactly as
 \begin{equation}\left({\textbf{B}}_{{\textbf{t}}_o} - {\textbf{B}}_{{\textbf{t}}_o-\textbf{1}}\right){\boldsymbol{\theta}} = \ln\left(\textbf{1}-\mathring {\imath}_{x,{\textbf{t}}_{o}}\right)\end{equation}
Thus, we have a Penalised Generalised Linear Model with Poisson error (1)–(2), penalty matrix
 ${\textbf{P}}_{\lambda}$
, link function
 $g(\mu) = \ln(1-\exp(-\mu))$
, and deterministic opinions given by (15). In this case, the link function corresponds to the logarithmic transform of the mortality rates.
It is worth clarifying that although the approximate constraint equation (13) and its exact counterpart (15) have the same form, the underlying models use different link functions. An illustration of the difference arising from the two approaches will be shown in Section 4.
3.3 Fitting the model, standard errors, and extension to two dimensions
We have established that deterministic opinions can be expressed as a set of linear constraints on the regression or spline coefficients as in (12) or (15); that is,
 \begin{equation}{\textbf{C}}_o{\boldsymbol{\theta}} = {\textbf{z}}_o\end{equation}
where
 ${\textbf{C}}_o$
is a matrix made up of a simple combination of the rows of the B-spline regression matrix and
 ${\textbf{z}}_o$
is the joint vector of opinion inputs.
Thus, fitting the model under these opinions reduces to the optimisation of the penalised log-likelihood
 $\ell_P$
subject to the constraints (16). Many strategies have been developed for constrained optimisation problems; see for example Strang (Reference Strang1986), Bjørck (1996) and Currie (Reference Currie2013) among others. Here, we use the Lagrange multiplier method. Hence, we consider the Lagrange objective function
 \begin{equation}\mathcal{L}({\boldsymbol{\theta}}, {\boldsymbol{\delta}}) = \ell_P({\boldsymbol{\theta}}) +({\textbf{C}}_o{\boldsymbol{\theta}}-{\textbf{z}}_o)'{\boldsymbol{\delta}}\end{equation}
where
 ${\boldsymbol{\delta}}$
is the vector of Lagrange multipliers.
The value of (
 ${\boldsymbol{\theta}}, {\boldsymbol{\delta}}$
) that maximises
 $\mathcal{L}$
can be obtained using the Newton–Raphson method (Strang, Reference Strang1986; Currie, Reference Currie2013). In particular, by adapting the result in Currie (Reference Currie2013), it can be shown that the value of (
 ${\boldsymbol{\theta}}, {\boldsymbol{\delta}}$
) that maximises
 $\mathcal{L}$
corresponds to the solution of the following extended penalised scoring equations
 \begin{eqnarray}\left(\begin{array}{c@{\quad}c} {\textbf{B}}^{\prime}_{{\textbf{t}}}\;\widetilde{{\textbf{W}}}{\textbf{B}}_{{\textbf{t}}} + {\textbf{P}}_\lambda & {\textbf{C}}^{\prime}_o \\[4pt] {\textbf{C}}_o & {\boldsymbol{0}}\end{array}\right)\left(\begin{array}{c} \widehat{{\boldsymbol{\theta}}} \\[4pt] \widehat{{\boldsymbol{\delta}}}\end{array}\right)\approx\left(\begin{array}{c} {\textbf{B}}^{\prime}_{{\textbf{t}}}\;\widetilde{{\textbf{W}}}\, \widetilde{{\textbf{z}}} \\[5pt] {\textbf{z}}_o\end{array}\right)\end{eqnarray}
At convergence, the conditional effective dimension and conditional covariance matrix of the fitted mortality trend can be computed based on the inverse of the 2 by 2 block matrix on the left-hand side of (18). If we set
 ${\textbf{A}}={\textbf{B}}^{\prime}_{{\textbf{t}}}\;\widehat{{\textbf{W}}}{\textbf{B}}_{{\textbf{t}}} + {\textbf{P}}_\lambda$
, and apply the formula for the inverse of block matrices (Searle et al., Reference Searle, Casella and McCulloch2006), we obtain
 \begin{eqnarray*}\left(\begin{array}{c@{\quad}c} {\textbf{A}} & {\textbf{C}}^{\prime}_o \\[4pt] {\textbf{C}}_o & {\boldsymbol{0}}\end{array}\right)^{-1}=\left(\begin{array}{c@{\quad}c} {\textbf{A}}^{-1}-{\textbf{A}}^{-1}{\textbf{C}}^{\prime}_o ({\textbf{C}}_o{\textbf{A}}^{-1}{\textbf{C}}^{\prime}_o)^{-1}{\textbf{C}}_o{\textbf{A}}^{-1} & {\textbf{A}}^{-1}{\textbf{C}}^{\prime}_o ({\textbf{C}}_o{\textbf{A}}^{-1}{\textbf{C}}^{\prime}_o)^{-1} \\[4pt] ({\textbf{C}}_o{\textbf{A}}^{-1}{\textbf{C}}^{\prime}_o)^{-1}{\textbf{C}}_o{\textbf{A}}^{-1} & -({\textbf{C}}_o{\textbf{A}}^{-1}{\textbf{C}}^{\prime}_o)^{-1}\end{array}\right)\nonumber \end{eqnarray*}
Hence, the covariance of
 $\hat{{\boldsymbol{\theta}}}$
is
 \begin{equation}Cov\left(\hat{{\boldsymbol{\theta}}}\,|\,\text{opinions}\right) \,=\, {\textbf{A}}^{-1}-{\textbf{A}}^{-1}{\textbf{C}}^{\prime}_o \left({\textbf{C}}_o{\textbf{A}}^{-1}{\textbf{C}}^{\prime}_o\right)^{-1}{\textbf{C}}_o{\textbf{A}}^{-1}\end{equation}
and the effective dimension (ED) of the model is
 \begin{equation}\text{ED}\,|\,\text{opinions} = trace\left\{\, \left({\textbf{A}}^{-1}-{\textbf{A}}^{-1}{\textbf{C}}^{\prime}_o\left({\textbf{C}}_o{\textbf{A}}^{-1}{\textbf{C}}^{\prime}_o\right)^{-1}{\textbf{C}}_o{\textbf{A}}^{-1}\right) {\textbf{B}}^{\prime}_{{\textbf{t}}} \widehat{{\textbf{W}}}{\textbf{B}}_{{\textbf{t}}} \right\}\end{equation}
From expression (19), the covariance matrix of the estimator of the fitted mortality curve
 ${\textbf{B}}_{{\textbf{t}}}\hat{{\boldsymbol{\theta}}}$
can be computed as
 \begin{eqnarray} \nonumber Cov\left({\textbf{B}}_{{\textbf{t}}}\hat{{\boldsymbol{\theta}}}\,|\,\text{opinions} \right)&=& {\textbf{B}}_{{\textbf{t}}}\; Cov\left(\hat{{\boldsymbol{\theta}}} \,|\,\text{opinions}\right)\; {\textbf{B}}^{\prime}_{{\textbf{t}}}\\&=& {\textbf{B}}_{{\textbf{t}}} {\textbf{A}}^{-1}{\textbf{B}}^{\prime}_{{\textbf{t}}} -{\textbf{B}}_{{\textbf{t}}}{\textbf{A}}^{-1}{\textbf{C}}^{\prime}_o \left({\textbf{C}}_o{\textbf{A}}^{-1}{\textbf{C}}^{\prime}_o\right)^{-1}{\textbf{C}}_o{\textbf{A}}^{-1}{\textbf{B}}^{\prime}_{{\textbf{t}}} \end{eqnarray}
The square roots of the diagonal elements of expression (21) are the estimated standard errors of the fitted mortality trends. We shall illustrate these standard errors in Section 4.2.
In general, the deterministic opinions tend to reduce the spread of the confidence intervals around the estimated mortality curves. In particular, when the opinions are formulated on the scale of the force of mortality or mortality rates as in Section 3.1, the standard errors of the fitted mortality curves vanish at the opinion time points
 ${\textbf{t}}_o$
. Indeed,
 \begin{eqnarray}Cov\left({\textbf{B}}_{{\textbf{t}}_o}\hat{{\boldsymbol{\theta}}}\,|\,\text{opinions}\right)& = & {\textbf{B}}_{{\textbf{t}}_o}\; Cov\left(\hat{{\boldsymbol{\theta}}}\,|\,\text{opinions}\right)\; {\textbf{B}}_{{\textbf{t}}^{\prime}_o} \nonumber \\& = & {\textbf{B}}_{{\textbf{t}}_o} {\textbf{A}}^{-1}{\textbf{B}}_{{\textbf{t}}^{\prime}_o} -{\textbf{B}}_{{\textbf{t}}_o}{\textbf{A}}^{-1}{\textbf{C}}^{\prime}_o \left({\textbf{C}}_o{\textbf{A}}^{-1}{\textbf{C}}^{\prime}_o\right)^{-1}{\textbf{C}}_o{\textbf{A}}^{-1}{\textbf{B}}_{{\textbf{t}}^{\prime}_o} \\& = & {\boldsymbol{0}} \quad \text{if} \quad {\textbf{C}}_o = {\textbf{B}}_{{\textbf{t}}_o} \nonumber \end{eqnarray}
We emphasise that the standard errors arising from (19) must be interpreted with caution because they are conditional on the opinion inputs. This is illustrated and discussed in Section 4.2.
So far we have described how to build deterministic opinions into the model in one-dimensional settings. This can be extended to two dimensions. As in Section 2.2, let us consider mortality data
 ${\textbf{E}}$
and
 ${\textbf{D}}$
, each stored in a matrix form for ages
 ${\textbf{x}} = (x_1,...,x_{n_1})$
and calendar years
 ${\textbf{t}} = (t_1,...,t_{n_2})$
. Without loss of generality, let us suppose that one is interested in modelling and forecasting mortality rates under the assumption that mortality improvements in given cells
 $(x_{o1}, t_{o1}),...,(x_{ou},t_{ou})$
are known a priori. That is, one would like to fit a mortality surface to the data such that
 \begin{equation}1-\dfrac{ q_{{}_{x_{ok},t_{ok}}}}{ q_{{}_{x_{ok},t_{ok}-1}}}= \mathring {\imath}_{{}_{x_{ok},t_{ok}}}\end{equation}
where the
 $\mathring {\imath}_{x_{ok},t_{ok}}$
are known values of the mortality improvements, and the
 $q_{x,t}$
are fitted mortality rates.
Note that the deterministic opinions can be formulated on different scales as in Section 3.1. Also, there is no restriction on the locations
 $(x_{ok},t_{ok})$
of the opinion constraints in the sense that some opinion cells
 $(x_{ok},t_{ok})$
can be within the data regions as well as outside of the dataregion.
If we denote by
 ${\boldsymbol{\Theta}}$
the matrix of spline coefficients as in Section 2.2, by
 ${\textbf{C}}_o$
the matrix obtained by stacking the rows of the one-row matrices
 ${\textbf{B}}_{t_{ok}} \otimes {\textbf{B}}_{x_{ok}}, \;1 \leq k\leq u$
, on top of each other, and we set
 ${\boldsymbol{\theta}}=vec({\boldsymbol{\Theta}})$
and
 ${\textbf{z}}_o = (\mathring {\imath}_{x_{o1},t_{o1}},\, \mathring { \imath}_{x_{o2},t_{o2}},\,...,\mathring {\imath}_{x_{ou},\,t_{ou}} )$
, then, the two-dimensional opinion (23) takes the matrix form of (16).
Hence, the fitted mortality surface encapsulating the data and the opinion inputs is obtained by solving an augmented system of iterative equations as in (18), but with
 ${\textbf{B}}_{{\textbf{t}}}$
replaced by the two-dimensional B-splines basis
 ${\textbf{B}}_{{\textbf{t}}}\otimes{\textbf{B}}_{{\textbf{x}}}$
, and
 ${\textbf{P}}_{\lambda}$
replaced by the penalty matrix
 ${\textbf{P}}_{\lambda_1, \lambda_2}$
definedin (8).
Furthermore, the conditional covariance matrix and effective dimension of the fitted mortality surface can be computed as in (11), but, with
 ${\textbf{B}}_{{\textbf{t}}}$
and
 ${\textbf{P}}_{\lambda}$
substituted by
 ${\textbf{B}}_{{\textbf{t}}}\otimes{\textbf{B}}_{{\textbf{x}}}$
and
 ${\textbf{P}}_{\lambda_1, \lambda_2}$
.
We close this section by noting that setting very dissimilar opinion inputs in adjacent ages/years can yield an unsmooth mortality surface, especially in the vicinity of the opinion locations. Also, setting a large number of opinion inputs (e.g. opinions at every single age/year) can cause singularities in the extended penalised scoring equation (18). These problems can be tackled by adding a small ridge penalty to the penalty matrix (Hoerl et al., 1970), by selecting a subset of the opinion inputs to work with, or by increasing the number of B-splines.
3.4 Similarities and differences with CMI projection approach
The Continuous Mortality Investigation (CMI) carries out research into mortality and morbidity experience on behalf of the Institute and Faculty of Actuaries, and produces practical tools for mortality projection that are widely used in the insurance industry to support the pricing and valuation of pension and annuity business. The projection methodology used by CMI has evolved over time, taking into account relevant literature on the mechanisms that determine ageing and longevity, including empirical features such as cohort effects (Willets, Reference Willets2004), as well as latest work on mortality forecasting methods.
In the most recent CMI projection models (CMI, 2014; CMI, 2016; CMI, 2020), the basic approach is to project mortality improvement rates by interpolating between current improvement rates and some assumed long-term improvement rates. The current improvement rates are estimated from historical data whereas the long-term improvement rates are set by users of the CMI model. This interpolation process is carried out separately for the age period and cohort components, and these components are then summed to give the overall mortality improvements. In this process, the shape of the projected rates is driven by a large number of parameters, including the initial direction of travel of mortality improvements, the convergence period, and the proportion of the remaining improvements at the midpoint. The users of the tools can then control projected mortality improvement patterns by playing with these parameters.
Some of features of the CMI approach can be found in the method presented in this paper. In particular, the initial and long-term improvement rates in the CMI approach can be fed into our framework as opinion inputs; the age-dependent convergence period can also be specified. By default, the initial direction of travel and the proportion of the remaining improvements at the midpoint are controlled by the smoothing process. However, the users of our approach can alter these defaults. For example, let us denote by
 $t_0$
the initial calendar year, by
 $T_x$
the age-dependent convergence period, by
 $i_{x,t_0}$
the initial improvement rates, and by
 $i_{x,t_0+T_x}$
the long-termimprovement rates. A proportion of remaining improvements of
 $a\%$
at midpoint is achieved within our framework by setting the deterministic input in equation (12) to
 \begin{equation}\mathring {\imath}_{x, t_o+\frac{T_x}{2}}= i_{x,t_0+T_x} + \frac{a\left(i_{x,t_0}-i_{x,t_0+T_x}\right)}{100}\end{equation}
A major criticism of the CMI projection methodology is that the shape of the forecast is subjective and comes without any uncertainty measure. The methodology presented in this paper (i) combines smooth patterns from the data together with the opinion inputs to derive forecasts and (ii) also allow us to compute the amount of uncertainty around the forecasts conditional on the input opinions. Moreover, unlike the CMI model, the approach presented in this study allows us to specify opinions not only in terms of mortality improvements, but also in terms of other mortality metrics by ages and calendar years. In the application Section 4.1 for instance, we shall specify opinion directly on mortality rates as well as on mortality improvements.
4. Applications
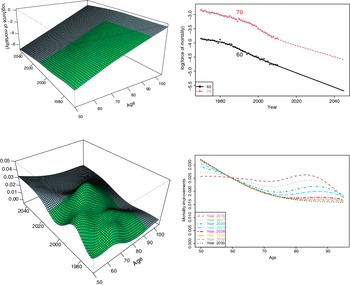
For illustrations, we use mortality data for UK males, ages 50–95 and calendar years 1970–2010 from the Human Mortality Database. We start by fitting and forecasting mortality in age and time without opinion constraints. We use cubic B-splines with 5-year equi-spaced knots in age and time, and apply second-order difference penalties to achieve smoothing. In the time direction, we project 35 years into the future, and in the age direction, we project from ages 95 to 105. The output of the fitted model is shown in Figure 1. This is broadly as expected: increasing mortality rates with age, and mortality reduction over time.
Output from the model without opinion constraints. Upper panels: fitted and projected mortality rates. Lower panels: mortality improvements.

4.1 Some scenarios involving opinion inputs
We now turn to the model involving opinion inputs, and we consider two scenarios. The first scenario states opinion inputs in terms of mortality improvement rates whereas the second expresses opinions in terms of mortality rates.
4.1.1 Scenario 1
In this first scenario, we set opinions about mortality improvements rates according to equation (25). In order words, we assume that the mortality improvement rate from age 50 to 85 in 2029 is set to
 $1.5\%$
, and then decreases linearly from that value of
 $1.5\%$
at age 85 down to
 $0.6\%$
by age 95. A similar pattern is used to set long-term improvements throughout the CMImodels.
 \begin{equation}\mathring \imath_{{}_{x,2029}}=\begin{cases}\quad\quad\quad 1.5\% & \text{if }\; 50\leq x\leq 85\\[5pt] \dfrac{(95-x)\times1.5\% \;\,+\;\, (x-85)\times 0.6\% }{10} &\text{if } \; 85 < x \leq 95\end{cases}\end{equation}
We then incorporate opinions (25) into the model using the exact method presented in Section 3.2.2.
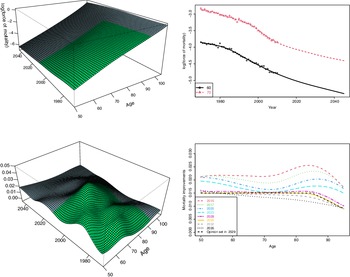
A comparison of the outputs from the model encapsulating these options is shown in Figure 2, against the output of the model without deterministic opinions shown in Figure 1. In particular, the lower panel on the right-hand side shows the convergence of the fitted mortality improvement rates towards the deterministic opinion pattern specified in equation (25). Comparing this panel to the corresponding panel in Figure 1 illustrates the impact of the opinion inputs (25) on the fitted mortality improvement rates. Similarly, the resulting impact in terms of mortality rates is visualised by comparing the upper panels of Figures 1 and 2.
Outputs from the model with opinions on improvements according to equation (25). Upper panels: fitted and projected force of mortality. Lower panels: mortality improvements.

4.1.2 Scenario 2
In a second scenario, we set opinion inputs in terms of mortality rates according to Table 1. These rates were obtained by projecting the “NLT16-18 (E
 $\&$
W)" mortality base table through the CMI model with core values specifications and a long-term mortality improvement rate of
 $1.5\%$
.
Opinion inputs about mortality rates for scenario 2.

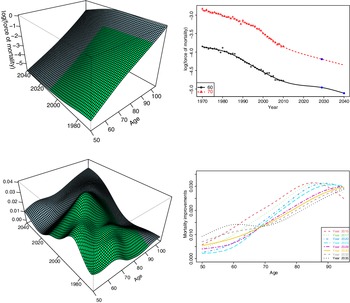
The output from the model encapsulating the deterministic opinions in Table 1 is shown in Figure 3. By contrasting the panels of this figure against corresponding panels in Figure 1 and Figure 2, we can see how various opinion inputs affect projections. In particular, the lower panel on the right in Figure 3 shows an overall upward pattern of improvement rates resulting from the fact that the improvement opinion rates at age 60 (in Table 1) are lower compared to those around the same age from the model without opinion constraint (shown in Figure 1).
Outputs from the model with opinions on mortality rates according to scenario 2. Upper panels: fitted and projected force of mortality; the blue dots correspond to the opinion inputs. Lower panels: mortality improvements.

4.2 Conditional uncertainty
An essential aid to the interpretation of estimated mortality trends is the uncertainty. The deterministic opinion constraints affect not only the fitted and projected mortality surface, but also its standard error as well.
In the one-dimensional case as in Section 3.3, the variances of the fitted mortality curve,
 $g(\hat\mu_{t})$
, are the diagonal elements of the covariance matrix (21), where g represents the link function used throughout Section 3. The computation is identical in the two-dimensional case, except that the B-spline matrix
 ${\textbf{B}}_{{\textbf{t}}}$
is substituted by its two-dimensional counterpart as described in Section 3.3.
In general, incorporation of opinion constraints tend to reduce the spread of the conditional standard error around the projected mortality curves; this is illustrated in Figure 4. Many comments can be made about this figure.
Illustration of the uncertainty around
 $\log(\hat\mu_{x,t})$
arising from fitting models to UK mortality data for males from calendar year 1970–2010. Top left: model without opinion constraints. Top right: model with opinion inputs on mortality improvements – See equation (25). Bottom: model subject to opinion constraints on mortality rates – See Scenario 2 in Table 1.

First, the panel on the top-left shows that the standard error about the projected trends from the model without opinion constraints increases over time, as expected: as we travel further into the future, the projected trends become more uncertain.
Second, the top-right panel on the shows increasing standard errors during the early years of projection and then a slowdown and flattening of these standard errors due to the incorporation of opinions constraints on mortality improvements in calendar year 2029.
Third, this slowdown of standard errors is also seen in the bottom panel. In particular, this panel shows that imposing deterministic opinion constraints on mortality rates implies that one is claiming to know the exact values of mortality rates at the opinion locations, and as a result, the standard error around the projected mortality rates decrease and vanishes as we approach the opinion locations.
In general, imposing deterministic opinion constraints on a given mortality metric causes standard error about the fitted/projected values of that metric to reduce and to vanish at the opinion locations. However, the standard errors in respect of other resulting mortality metrics do not necessarily vanish. For example, the top-right panel in Figure 4 reveals that, although deterministic constraints are placed on mortality improvements, there are still some amounts of uncertainty around the fitted mortality rates at the opinion locations. This can be ascribed to the fact that the value of the mortality improvement rate in a given year is driven by a combination of mortality rates in two successive years.
4.3 Exact method versus approximate method
In Section 3.2, we presented two ways to integrate opinions on the scale of mortality improvements. In practice, the difference between these two approaches is relatively small. For illustration let us reconsider the opinion inputs in Scenario 1 – See Equation (25).
An illustration of the difference between the exact method and the approximate method based on the opinion specification of scenario 1 is shown in Figure 5. On this graphic, the continuous lines correspond to the exact method and the dashed lines represent the approximate method. Although the exact method appears to be more accurate at hitting the targets, this graphic indicates that the difference between the two methods is relatively small. Nonetheless, the approximate method is slightly easier to implement because it uses the Poisson canonical linkfunction.
Illustration of the difference between the exact method (continuous lines) and its approximate counterpart (dashed lines), from model fitted under Scenario 1. The dots represent the opinion inputs in 2029.

4.4 Impact of deterministic opinion on the edges
Opinion input about future mortality rates can potentially impact the in-sampling smoothing of historical data, especially towards the edge of the data region. In this section, we illustrate the magnitude of such influence using the two opinion scenarios shown in Section 4. Under each scenario, we compared the fitted mortality rates at the edge of the data (that is ages 50–95 in calendar year 2010) to the fitted mortality rates from the model without opinions. This comparison is shown on graphics in Figure 6.
Illustration of the impact of opinion inputs at the edge of the data region (i.e. calendar year 2010) under the deterministic opinions in scenarios 1 and 2. Scenario 0 refers to the model without opinion inputs. The dots represent the observed data in 2010. Left-hand panel: fitted mortality rates. Right-hand panel: change in the fitted mortality rates relative to Scenario 0.

These graphs highlight that the impact of the opinion inputs on the in-sampling smoothed surface is relatively minor under the two scenarios considered (except perhaps at ages 50–60 for scenario 2). A further investigation using more extreme opinion specifications yielded a similar conclusion. The choice of the smoothing parameters plays a role here. On the one hand, large values of the smoothing parameters would tend to yield a smoother mortality surface and this could increase the remote impact of opinion inputs on the in-sampling smoothing. On the other hand, lower smoothing parameters increase the roughness/flexibility of the fitted mortality surface and, therefore, tend to reduce the remote impact of the opinion inputs. In our experience, selecting smoothing parameters through BIC adjusted for overdispersion allows us to reduce the remote impact of the opinion inputs. Nonetheless, it is good to bear in mind that a very extreme opinion specification near the edge of the data could yield a larger impact especially on the edges.
5. Concluding remarks
The main objective of this work was to present a simple way of integrating deterministic opinions into flexible mortality projection models. This has been achieved by expressing the opinion inputs as a system of constraints, and building them into the model using the standard machinery of iterative weighted least squares. This integrated approach addresses many limitations of current deterministic projection methods. In particular, the fitted and projected mortality trends arising from our method are driven by a combination of the speed of improvements from the data and the opinion inputs. Additionally, our approach provides a statement of conditional uncertainty around the mortality trends.
In this paper, we have focussed on opinion inputs expressed in terms of the actual value of widely used mortality metrics. Other types of constraint can be considered. For example, incorporating opinion constraints on the gradient of mortality rates has the potential to address the problem of crossing over of mortality forecasts at adjacent ages often found in some mortality models. Also, extending the work presented in this paper to account for non-deterministic opinion will be a valuable addition to the topic of mortality forecasting.
Acknowledgements
I am grateful to Paul Eilers, Iain Currie and Stephen Richards for useful comments on the early draft of this paper. I also thank two anonymous reviewers for their helpful comments.