I. INTRODUCTION
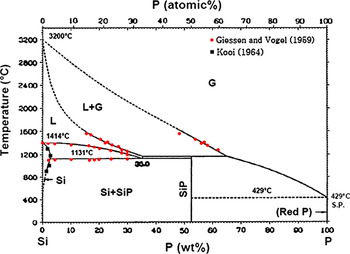
In the late 1950s, the silicon–phosphorus phase diagram was constructed by Giessen and VogelReference Giessen and Vogel1 in a wide composition range. They melted pure silicon in a large graphite crucible and then added pressed phosphorus to the melt, while the melt was mixed by a graphite rod. They obtained alloys containing high phosphorus concentrations through cutting the phosphorus poor layers on the outer and bottom sides of the solidified alloy in the crucible. They constructed the phase diagram through melting the alloys and applying thermal and microscopic analysis. The liquid–vapor phase boundaries were determined by lever rule calculations from the analysis of the alloys quenched from liquid–vapor region. A eutectic composition was established at 35 ± 3 wt%P by extrapolation of the measured liquidus curve to the eutectic temperature of 1131 ± 2 °C.
Zaitsev et al.Reference Zaitsev, Shelkova and Kodentsov2 studied the vapor composition and the thermodynamic properties of the Si–P melts with the phosphorus contents from 0.09 to 26.5 at.% in the temperature range of 1234–1558 °C. They did their study by using Knudsen effusion mass spectrometry for the alloys with phosphorus content less than 10.5 at.%P and a static method for the P-rich alloys. The thermodynamic characteristics as function of temperature and composition were approximated by the ideal associated solution model under the assumption that SiP and Si2P complexes exist in the melt. They computed the boundaries of liquid phase stability on the Si–P phase diagram by their experimental data and the applied model. According to their calculations, the lines of equilibrium of the melt with solid silicon and vapor intersect at the eutectic point of 1166 °C and 32.51 wt%P.
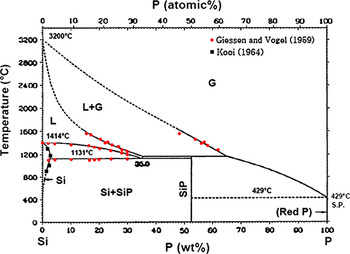
The solubility of P in silicon at elevated temperatures has been investigated through many studies.Reference Olesinski, Kanani and Abbaschian3–Reference Schwettmann and Kendall19 The measurements of P solubility in solid silicon done by KooiReference Kooi4 and the experimental data of Giessen and VogelReference Giessen and Vogel1 were used by Olesinski et al.Reference Olesinski, Kanani and Abbaschian3 to establish the Si–P phase diagram in Fig. 1. Low phosphorus concentration part of this diagram has been determined using a few experimental measurements and they can be in low accuracy, particularly above the eutectic temperature. Hence, this study focuses on determining the liquidus and solidus on the silicon-rich part of Si–P system.
The phase diagram for Si–P system established by Olesinski et al.Reference Olesinski, Kanani and Abbaschian3
II. EXPERIMENTAL PROCEDURE
A part of this study was dedicated to prepare Si–P alloys and their characterization. High temperature phase transformations in the alloys were then studied by simultaneous thermogravimetry (TG) and differential thermal analysis (DTA).
A. Preparation of Si–P alloys
Regarding large difference between the melting point of silicon (1414 °C) and the sublimation point of red P, which was used in this study, it is difficult to alloy Si and P. The sublimation point of the red phosphorus has been reported to be around 41720 and 429 °C.Reference Barin, Knacke and Kubashevski21
In this study, different fractions of pure silicon (+99.9999 wt%) and pure red phosphorus (99.999 wt%) particles were mixed to make silicon containing 1, 2, 3, 4, 5, 7, 10, 15, 20, 30 wt%P, which are called samples A–J, respectively. The mixtures were put in quartz tubes of 10-mm diameter and 120-mm length. Subsequently, they were isolated from the air through closing the tubes under vacuum. Silicon–phosphorus alloys were then produced through the melting of samples in a rapid heatable furnace. Quartz tubes were heated up to 1450 °C in 10 min and cooled rapidly down in air after 5-min holding time. The quartz tubes were then broken and the solidified alloys were separated.
Cross sections from few pieces of the produced alloys were prepared and their microstructure was studied by EPMA. The chemical composition of each individual phase was measured by wavelength dispersive spectroscopy over 3–12 points of each phase.
B. Thermal analysis
Simultaneous TG and DTA techniques (SETSYS Evolution 2400 TG–DTA; Setaram Techn., Buchen-Hettingen, Germany) were applied to study the phase transformations in the alloys at elevated temperatures. Graphite crucible with the dimensions of 8 mm H × 5 mm O.D. × 4 mm I.D. was used to hold the Si–P samples and a reference material. The experiments were carried out using 70 ± 2 mg of Si–P alloys and the reference material. Pure Ar gas (+99.9999%) with the flow rate of 20 mL/min was flashed in the apparatus chamber during the experiments.
The reference material with known melting point at elevated temperatures is required to correct the measured temperatures to actual temperatures. Pure cobalt was saturated by carbon through its melting in graphite crucible and then was used as the reference material. This alloy has a melting point at 1320 °C and a magnetic transformation at 1037 °C.20 It was found that Ni–Csat alloy can be a better candidate with a melting point at 1326.5 °C.20 Therefore, pure nickel (99.995 wt%) was saturated in the same way as cobalt to use in the reference crucible. Fe–Csat alloy was also produced in the same way to use as the reference material for some experiments. This alloy absorbed the evaporated phosphorus from the Si–P samples and therefore the produced Fe–P–Csat alloy was used as the reference. With regard to the type of reference material and the heating profile, the thermal analysis experiments are categorized in four series as shown in Table I.
The experimental conditions for TG/DTA experiments.

TG, thermogravimetry; DTA, differential thermal analysis.
The mass changes (TG) and heat flow changes (DTA) were measured in the thermal analysis experiments. The TG/DTA curves were then corrected with regard to the related baselines. The baselines were extracted for the changes of the mass and the heat flows by using an empty graphite crucible and the graphite crucible containing the reference material. In this case, the same heating regime as applied for each series of experiments was applied. To correct the raw TG/DTA curves of samples, the baselines were first subtracted from the TG/DTA curves of samples. Thereafter, all the TG and DTA curves were corrected with regard to the melting point of the reference material. In this case, the difference between the observed melting point for the reference material in each individual run and its known melting point was added to all measured temperatures. The final phosphorus concentration in the Si–P alloys after TG/DTA analysis was eventually measured by ICP-MS.
III. RESULTS INTERPRETATION
The experimental results are described below.
A. Characterization of Si–P alloys
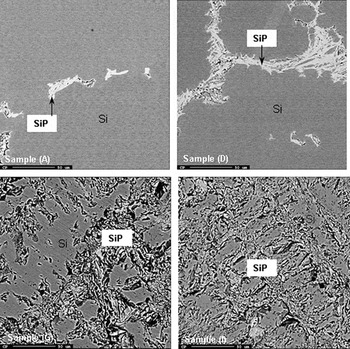
Two phases were always observed in the produced alloys as shown for some samples in Fig. 2; a gray phase and a bright phase. A nonuniform distribution of these phases was often observed, particularly for low P-containing samples. The averages of the measured chemical compositions of both phases in all samples are listed in Table II. Obviously, the gray phase is a solid solution of phosphorus in silicon. The relatively high concentration of P in this solid solution for samples G–J can be due to the involvement of the bright phase in the analysis. Silicon/phosphorus ratio of the bright phase indicates that it is the intermediate compound SiP as expected by the phase diagram.
As cast microstructure of the Si–P alloys.

The chemical composition of the phases in the Si–P alloys by EPMA (wt%).

The measured mass of the samples after thermal analysis, the total mass loss, and the concentration of P in the samples after the experiments in series 2–4 are listed in Table III. Moreover, the calculated initial P concentrations in the samples are also listed in this table. In general, samples containing higher initial P concentrations show larger total mass losses and higher amounts of the remained phosphorus. Some discrepancies are mainly due to the nonhomogeneous microstructure of the alloy samples.
Total measured mass loss, final mass, and phosphorus concentration of Si–P alloys in thermal analysis experiments and the calculated initial P concentration.

B. Thermal analysis of Si–P alloys
1. Experiment series 1
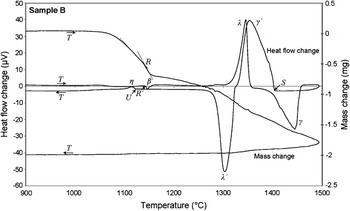
The Si–P alloys A–E were first analyzed using Co–Csat reference (Table I). The corrected TG and DTA curves obtained for sample B are shown in Fig. 3 as example. The upward peak λ and the downward peak λ′ on DTA curve are related to the melting and solidification of Co–Csat, respectively. The heat flow changes show that the temperature of the crucible reaches a maximum slightly below the melting point of silicon, and it is not high enough to melt the Si–P sample completely. Moreover, they show some unknown phase transformations at elevated temperatures as clearly seen within the cooling step. This may indicate that Co–Csat alloy is not a proper reference material. Hence, Ni–Csat alloy was used for the same samples with applying higher maximum temperatures.
The corrected thermogravimetry (TG) and differential thermal analysis (DTA) curves for sample B in experiment series 1.

The mass changes in Fig. 3 indicate a rapid mass loss in the heating step at temperatures around 1000 °C. This mass change is definitely due to the dephosphorization of sample. Hence, to decrease the rate of dephosphorization and to maintain more phosphorus in the samples at high temperatures, lump of the Si–P alloys and a faster heating rate were used in further experiments.
2. Experiment series 2 and 3
As an example, the corrected TG/DTA results for the sample B with using Ni–Csat reference are shown in Fig. 4. The mass changes indicate again a rapid mass drop around 1000 °C. On the other hand, TG curves show a change from rapid mass loss to much slower mass loss at the temperatures around 1140 °C. The mass decrease at higher temperatures than 1140 °C occurs with approximately a constant rate to the maximum temperature. The mass is minimally decreased through the cooling and leveled off after a while. The heat flow changes in Fig. 4 show three main phase transformations in heating and three phase transformations during cooling as well. The peaks related to the melting of Ni–Csat and Si–P alloys are indicated by λ and γ symbols, respectively. The solidification of these alloys within the cooling are also shown by λ′ and γ′ symbols, respectively. An endothermic reaction at temperatures around 1140 °C takes place in the Si–P alloys in the heating step (DTA curve, peak β). Moreover, an exothermic reaction at temperatures around 1120 °C takes place in the samples in the cooling step (peak η).
The corrected TG and DTA curves for sample B in experiment series 2.

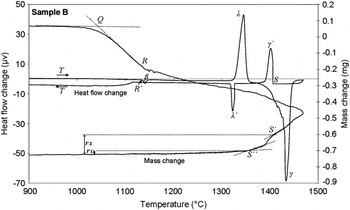
The DTA curves in the cooling step of experiment series 2 show wide exothermic peaks for the Si–P alloys solidification, i.e., sample B in Fig. 4. To gain more information about the solidification of the Si–P alloys, experiment series 3 were carried out similar to the experiment series 2 with 10 times slower cooling rate (Table I). A typical obtained TG/DTA result for these experiments is shown in Fig. 5. It is seen that a much narrower γ′ peak for Si–P solidification is appeared compared to rapid cooling (Fig. 4). The mass changes in experiment series 3 (Fig. 5) have approximately similar changes through the heating step as observed for the experiment series 2 (Fig. 4). However, the mass changes in the cooling step are different and the mass loss is increased with the start of solidification from point S′ in TG curve and leveled off after a while at point S″ as seen in Fig. 5. The observed exothermic reaction in the rapid cooling rate, peak η, at 1120 °C (Fig. 4) is not observed anymore through slow cooling rate (Fig. 5).
The corrected TG and DTA curves for sample B in experiment series 3.

3. Experiment series 4
It was found that a part of the evaporated phosphorus from the Si–P samples is absorbed by the Fe–Csat reference, and Fe–P–Csat alloy is formed. This alloy indicated a much lower melting point than the melting point of Fe–Csat (1154 °C). As mentioned before, this ternary alloy was used as the reference material. The difference between the melting point of Fe–P–Csat alloy and the melting point of Fe–Csat alloy was determined through thermal analysis with the same heating regime as experiment series 4. This difference was obtained as 223 °C. A temperature correction factor was then calculated for the experiments through the subtraction of the melting point of Fe–Csat (1154 °C) from the sum of the measured melting point for Fe–P–Csat and 223 °C (ΔT Corr. fac. = T meas. for Fe–P–Csat + 223 − 1154). This correction factor was in the short range of 17–22 °C for different samples.
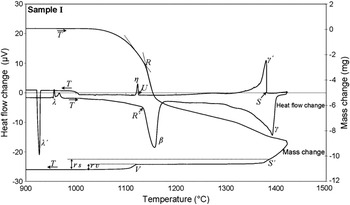
The corrected TG/DTA curves for sample I are shown in Fig. 6 as a typical result of the experiment series 4. The melting and solidification of the reference are again illustrated by λ and λ′ symbols in the heat flow changes. The phase transformations in the Si–P alloy on the heat flow change curve are similar to the experiment series 2 and 3. However, the previously endothermic reaction around 1140 °C in Figs. 4 and 5 takes much higher heat for samples with high P concentrations as observed in Fig. 6. Similarly, the exothermic reaction in the Si–P alloys at temperatures around 1130 °C in the cooling step (peak η) releases more heat for samples F–J compared to samples A–E in rapid cooling step (Figs. 4 and 6). According to the phase diagram in Fig. 1, this exothermic reaction is eutectic reaction where the remained liquid is transformed to solids of silicon and SiP.
The corrected TG and DTA curves for sample I in experiment series 4.

In summary, the phase transformations on the TG and DTA curves can be summarized as below:
(i) The changes in the mass loss rate at point Q: SiP dissociation.
(ii) Peaks λ and λ′: melting and solidification of the reference material.
(iii) Peak β: melting of SiP (this corresponds to point R in TG curve).
(iv) Peak γ and γ′: melting and solidification of Si–P alloy.
(v) Peak η: eutectic solidification.
IV. DISCUSSION
The observed phase transformations in the Si–P alloys through heat treatment are discussed below in detail.
A. Dissociation of silicon phosphide
The large mass drop in the TG curves at temperatures around 1000 °C (Figs. 3–6) is related to the dissociation of silicon phosphide. The existence of only Si and SiP phases in the alloys supports this idea that this significant weight loss is due to phosphorus evaporation due to the SiP dissociation. The comparison of the TG curve in Figs. 3–5 for the sample B alloy shows that the extent of the mass loss for the powder alloy (Fig. 3) is larger than the bulk alloy sample (Figs. 4 and 5). When powder is used, much higher surface area is provided for the gasification of phosphorus and it increases both the rate and extent of SiP phase dissociation within a constant heating rate. It has to be mentioned here that a direct relationship between the initial phosphorus concentration of the alloys and the magnitude of the mass loss at around 1000 °C was always observed. For instance, sample B indicates much smaller mass loss than sample I as found through the comparison of Figs. 5 and 6, where initial phosphorus concentrations are 4.5 and 22.5 wt%, respectively. The produced phosphorus due to SiP dissociation is immediately evaporated due to the high phosphorus vapor pressure, and the phosphorus in the gas phase can be tetratomic or diatomic. Hence, the SiP dissociation reactions can be written as:


The ΔG° of the above reactions was calculated for below 1673 K by HSC Chemistry software version 4.1 (Outokumpu Research OY, Pori, Finland). The changes in the Gibbs free energy of reactions (1) and (2), ΔG, were also calculated for different phosphorus partial pressures as shown in Fig. 7. The ΔG changes indicate that under standard conditions SiP decomposes at temperatures above 1260 °C. The thermal analysis experiments, however, were done with using Ar and atmospheric pressure. This maintains low phosphorus partial pressure in the system so that SiP is dissociated at lower temperatures. The effect of partial pressure of gaseous phosphorus on decreasing the dissociation temperature of SiP can be found through comparing the ΔG changes of reactions (1) and (2) at phosphorus partial pressures equal to 0.01 and 1 atm (Fig. 7).
The changes of the Gibbs free energy of reactions (1) and (2) with temperature for different phosphorus partial pressures.

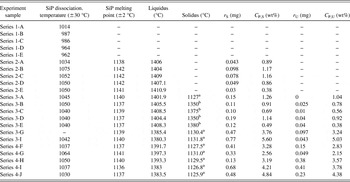
The SiP decomposition temperature can be calculated from the obtained TG curves for each experiment. The cross point of the tangents on the TG curve can be considered as the SiP dissociation temperature as shown by point Q in Figs. 3 and 5.Reference Brown23 This temperature for all experiments was extracted, and the results are shown in Table IV. It is seen that SiP is thermally decomposed between 962 and 1075 °C. This temperature range may be related to the different heating rates and form of materials. Under the present experimental conditions, the average SiP dissociation temperature is 1031 ± 30 °C.
The observed phase transformations through TG/DTA experiments.

a Eutectic temperature.
b Solid solution of P in Si ± 2 °C; r S, sample mass loss from the start of solidification (liquidus) at C P,S concentration; r U, sample mass loss from start of eutectic reaction (solidus) at C P,U concentration.
B. Melting of silicon phosphide
According to the phase diagram in Fig. 1, the first reaction in the Si–P alloys under equilibrium conditions in heating is the liquid formation from silicon and SiP solids at the eutectic temperature:

Regarding the rapid heating rate of the samples and the small difference between the melting point of SiP and the eutectic temperature, SiP is melted prior significant proceed of reaction (3). It must be emphasized that reaction (3) takes place between two solids and is essentially a slow reaction in comparison with the SiP melting, which is a simple melting phenomenon:

The observed turning point in the TG curves around 1140 °C in Figs. 4–6 is due to the melting of SiP. The existence of this endothermic reaction can be easily confirmed by the DTA curves, where an endothermic reaction in the sample (peak β) is observed at the same temperature that the turning point in the TG curve is appeared. Qualitative comparison of the downward peaks for the SiP melting for different samples shows that more heat is consumed for the higher P concentrations as clearly observed for samples B and I in Figs. 6 and 7. This is due to the higher amounts of SiP in sample I than in sample B. The decrease in the phosphorus evaporation rate slightly after SiP melting is as a result of the P activity drop in the coexisted liquid phase. This is due to the fast chemical reaction between the liquid SiP and solid silicon, which produces a Si–P melt containing lower P than the liquid SiP [reaction (5)]. Therefore, slower P evaporation takes place as the consequence of the SiP melting.

The melting point of SiP in all experiments was determined from the DTA curves and also by the same applied method for determining the SiP dissociation temperature (Table IV). Points R and R′ on the TG and DTA curves in Figs. 4–6 indicate the melting point of SiP and they show close temperatures in the same region. It is seen that the obtained results are very close for all experiments, and they give an average melting point for SiP at 1139 ± 2 °C. This melting point is close to the reported melting point 1140 °C.Reference Barin, Knacke and Kubashevski21, Reference Massalski22 No SiP melting point for the experiment series 1 was measured. This is due to complete dissociation of SiP before reaching its melting point, where powder materials and slower heating rate were used (Table I).
The occurrence of reaction (4) compared to the reaction (3) in the heating step can be explained with regard to the DTA curve data in both heating and cooling steps. Considering Fig. 6 for instance, the endothermic reaction in point R′ is related to reaction (3) or (4), and the exothermic reaction at point U in the cooling step is related to one of these reactions in backward. It was always observed that the measured temperature at R′ is higher than U (Table IV). This may support the point that the measured exothermic reaction at temperature R′ is related to the SiP phase melting, and the other one in the cooling step is related to the backward reaction (3), eutectic solidification, which is described below.
C. Solidification of Si–P alloys
The transformations related to the melting and solidification of Si–P alloys are observed in the heat flow curves in Figs. 4–6. Regarding the SiP dissociation and melting within the heating step and its simultaneous reaction with the solid silicon, it is complicated to use the DTA curve in the heating step to determine the melting temperatures of the alloys as it is not fully at equilibrium. However, the solidification temperatures of alloys from a homogeneous melt can be successfully determined as described below.
1. Start of solidification
The liquidus of Si–P alloys can be accurately determined from the DTA curves in the cooling step. This temperature is the temperature that the first upward peak in heat flow curve (peak γ′) is appeared as shown by point S in Figs. 4–6. This temperature was measured for all experiments in series 2, 3, and 4, and the results are listed in Table IV.
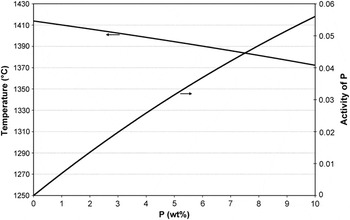
It was observed that for the experiments in series 3, a turning point is appeared in the TG curve with the start of solidification, i.e., point S′ in Fig. 5. The increase in the rate of mass loss is related to the faster P evaporation from the sample with the start of solidification. During solidification, the phosphorus atoms are pushed to the melt from the solid/liquid interface due to the lower solubility of P in solid silicon than that in liquid silicon. As a result, the P activity in the remained melt increases, but the temperature is decreased simultaneously. The changes in the activity of phosphorus along the liquidus in Si–P system from pure silicon were calculated using FactSage thermodynamic software version 6.2 as shown in Fig. 8. Obviously, the activity of phosphorus is more affected by the chemical composition and even during the solidification, the activity increases due to the increase in the phosphorus concentration in the remained melt. The start of solidification cannot be observed in the TG curves of experiment series 2 and 4. For the experiments in series 2, the cooling rate is high and the increase in the P activity is probably compensated by the large cooling rate. For the experiments in series 4, the P concentration in the melt is not changed significantly due to the higher P at the start of solidification and therefore the turning point on TG curve is not observed (Fig. 6).
The calculated P activity along the suggested liquidus by Giessen and Vogel.Reference Giessen and Vogel1

2. End of solidification
The solidus temperatures for the experiment series 3-B, 3-C, 3-D, and 3-E were determined from the TG curves. Considering the discussion about the appearance of the turning point S′ in the TG curves with the start of solidification described earlier, it may be acceptable to consider that the mass loss from the samples is leveled off with the completion of solidification, i.e., point S″ in Fig. 5. This temperature was measured for the above samples by the same method applied for determining SiP dissociation and melting temperatures, and the results are presented in Table IV.
The eutectic reaction in many experiments occurred within the cooling step. The eutectic temperature, which is the temperature at point U in Fig. 6, was determined from the DTA curves, and the results are listed in Table IV. Very close measured eutectic temperatures through experiment series 3-G and 4-G can confirm the temperature corrections made by two different reference materials. It is worth noting that a mass loss drop is observed in the TG curves from point V in Fig. 6, which is the eutectic temperature. This mass loss is due to the formation of SiP through the eutectic reaction [reaction (3) in backward] and its simultaneous decomposition. The measured eutectic temperatures give an average at 1129 ± 2 °C, which is close to the suggestions done by Giessen and Vogel (1131 °C).
It is worth noting that the eutectic reaction was observed for the experiment series 2-B, 2-C, 2-D, and 2-E as seen in Fig. 4 for sample B. However, the eutectic was around 10 °C lower (around 1118 °C). This eutectic reaction was not observed in the samples in experiment series 3-B, 3-C, 3-D, and 3-E, while the P content in the alloys is in the similar range. This may be due to the rapid cooling applied in the experiment series 2 so that it replaces the solidus in the system to lower temperatures and far from the equilibrium. Therefore, in this study, the solidus temperatures related to the experiment series 2 are not used to study the phase diagram.
D. Liquidus and solidus in Si–P phase diagram
The liquidus and solidus on the silicon-rich part of the Si–P phase diagram were calculated using the measured temperatures for the start and end of solidification and their corresponding phosphorus concentrations. These concentrations were determined as follows.
With regard to the small mass loss after the end of solidification, the final measured concentrations of P in Table III can be used as the concentrations for the measured solidus temperatures, i.e., experiment series 2. On the other hand, using the final mass of the samples, m f, and the final phosphorus concentration, C P,f, the phosphorus concentration at the liquidus (C P,S) and solidus (C P,U) can be calculated as:


where r S and r U are the measured mass loss from the start and end of solidification as illustrated in Figs. 5 and 6. The calculated C P,S and C P,U values for experiment series 3 and 4 are listed in Table IV.
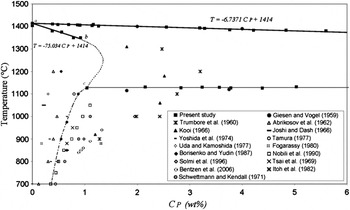
Based on the information in Table IV, the liquidus and solidus on the silicon-rich part of the phase diagram were determined as shown by solid lines in Fig. 9. The obtained liquidus [Eq. (8)] is close to the suggested liquidus by Giessen and Vogel,Reference Giessen and Vogel1 and it fits very well with their two measurements in low concentrations (Fig. 9). The solidus above the eutectic temperature is based on a few measurements and the known melting point of silicon. It is seen that there is a fairly linear relationship between the solubility of P in solid silicon and temperature for P concentrations below 1.04 wt%P [Eq. (9)].


The silicon-rich part of Si–P system. Solid lines indicate determined liquidus and solidus in this study; dash and dash point curves indicate estimated liquidus and solidus in this study; and symbols indicate experimental measurements of different studies.

where C P is the phosphorus concentration in wt%. The maximum solubility of P in solid silicon at the eutectic temperature obtained around 1.04 wt%P at the eutectic temperature, point c in Fig. 9. The measured solubility for P in silicon at high temperatures through many studies is also shown in Fig. 9.Reference Giessen and Vogel1, Reference Kooi4–Reference Mackintosh17 It is seen that lower and higher solubility than what is obtained in this study have been reported. The dashed line “b-c” in Fig. 9 is guessed with considering the obtained solidus “a-b” and the fix point of 1.04 wt%P as the maximum solubility at the eutectic temperature. It must be pointed out that the part “b-c” can have even a position more to the right. The dashed point curve for solid solubility below the eutectic point in Fig. 9 is estimated using the data of Borisenko and Yudin.Reference Borisenko and Yudin15
Phosphorus solubility in solid silicon has been measured by several techniques. The concentration of the electrically active atoms in equilibrium with SiP phase has been determined using sheet resistivity (SR) measurementsReference Yoshida, Arai, Nakamura and Terunuma5, Reference Tsai6, Reference Trumbore8–Reference Uda and Kamoshida10, Reference Nobili, Huff, Barraclough and Chikawa13, Reference Joshi and Dash14, Reference Itoh, Sasaki and Mitsuishi18, Reference Schwettmann and Kendall19 and combinations of SR and Hall effect (HE) measurements.Reference Solmi, Parisini, Angelucci and Armigliato11–Reference Nobili, Huff, Barraclough and Chikawa13, Reference Borisenko and Yudin15 The total solubility of phosphorus has been also determined by other methods such as neutron activation analysis (NAA),Reference Kooi4, Reference Nobili, Huff, Barraclough and Chikawa13 secondary neutral mass spectrometry (SNMS),Reference Solmi, Parisini, Angelucci and Armigliato11 secondary ion mass spectrometry (SIMS),Reference Bentzen, Christensen, Svensson, Holt, Poortmans, Ossenbrink, Dunlop and Helm16 and channeling-RBS.Reference Fogarassy, Stuck, Muller, Grob, Grob and Siffert12 Microhardness measurements were also done by Abrikosov et al.Reference Abrikosov, Glazov and Chen Yuan7 The solubility data for temperatures higher than 750 °C obtained by NAA, SNMS, and SIMS exceed many of those obtained by SR and HE. This is due to the fact that SR and HE techniques can measure only active phosphorus. There is, however, reported resistivity measurements data by TrumboreReference Trumbore8 that show high solid solubility of phosphorus (Fig. 9). It is worth noting that TrumboreReference Trumbore8 estimated the solubility data using the diffusion data obtained with applying SR measurements by Mackintosh.Reference Mackintosh17 The maximum solubility at eutectic temperature as 1.04 wt%P agrees well with lower solubility values reported in literature. Since different technique compared to the above applied methods is used in this study, it is hard to compare here the obtained maximum solubility with the other studies. It is worth mentioning that the higher phosphorus solubility determined by NAA, SNMS, and SIMS techniques (total concentration) can also be due to phosphorus in SiP precipitates, which coexist with silicon.
E. Phosphorus distribution coefficient
Concentration of a solute element introduced into a solid grown from a melt depends on its distribution coefficient, k 0, which is defined as the ratio of the concentration in the solid phase (C s) to that in the liquid phase (C l):

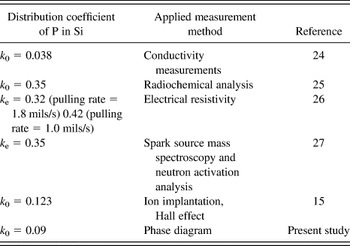
Equations (8)–(10) give a distribution coefficient of k 0 = 0.09, which is compared in Table V with the suggested k 0 values in literature.Reference Borisenko and Yudin15, Reference Hall24–Reference Davis, Rohatgi, Hopkins, Blais, Rai-Choudhury, Mccormick and Mollenkopf27 As observed, the distribution coefficient values vary in a range and the present result is closed to the measurements done by Borisenko and Yudin.Reference Borisenko and Yudin15 However, the frequently used distribution coefficient of P in Si is k 0 = 0.35. The obtained distribution coefficient in this study is based on assuming linear relationship for the solidus from around 0.4 wt%P to very low concentrations according to Eq. (9). The larger distribution coefficient obtained by Chokralski crystal growth techniqueReference James and Richards25–Reference Davis, Rohatgi, Hopkins, Blais, Rai-Choudhury, Mccormick and Mollenkopf27 may indicate that solidus cannot be linear from very low concentrations to around 0.4 wt%P. Thus, it is expected to have a continuous decrease in distribution coefficient with temperature from the melting point of silicon (1414 °C).
The measured distribution coefficient of P in Si at the melting point of silicon.

Parameter k e, which was measured by Huff et al.,Reference Huff, Digges and Cecil26 is the effective distribution coefficient and is dependent on the microscopic crystal growth rate, impurity concentration, interface orientation, and temperature gradients, as well as the stirring conditions in the melt.
V. CONCLUSIONS
Silicon–phosphorus alloys were produced through melting Si and P mixtures in closed quartz tube. Their characterization indicated that the alloys consisted of a solid solution of P in Si and the intermediate compound SiP without uniform phase distribution. Thermal analysis experiments indicated that SiP melting point is 1139 ± 2 °C. Phosphorus evaporation from the alloys is continuously occurred through their heating at elevated temperatures, and it is the highest above SiP dissociation temperature, whereas it decreases through SiP melting. The TG/DTA curves obtained through the cooling of silicon–phosphorus alloys were used to determine the liquidus and solidus on the silicon-rich part of the Si–P phase diagram. Fairly, linear liquidus and solidus relationships were obtained for P concentrations less than 6 wt%P and 1 wt%P, respectively. The maximum phosphorus solubility in solid silicon is around 1 wt% at the eutectic temperature of 1129 ± 2 °C. A distribution coefficient of P in Si equal to 0.09 was also obtained using the solidus and liquidus lines.
ACKNOWLEDGMENTS
The authors acknowledge Mr. Shawn Wilson in SINTEF Materials and Chemistry for TG/DTA experiments. The authors also acknowledge the project funds provided by the Norwegian Research Council through BASIC project.