In the September 2003 issue of this JOURNAL, we provided benchmark comparisons of U.K./U.S. income from 1870 to 1990.1
Ward and Devereux, “Measuring British Decline.”
In contrast to long-span projections from Angus Maddison and others, our estimates show the United States leading from 1870 in terms of income per capita and output per worker.
2 Maddison, Monitoring the World Economy and World Economy.
In a 12-page comment that accompanies our article, Professor Stephen Broadberry criticizes our work on three grounds.
3 Broadberry, “Relative Per Capita Income Levels.”
First, he charges our estimates are inconsistent with his U.K./U.S. sectoral productivity comparisons. Second, he chastises us on the grounds that our price benchmarks conflict with standard U.S. and U.K. price indices. Finally, he queries our nominal GDP estimates.
In reply, we provide new GDP comparisons based on sectoral productivity data for 1870, 1890, and 1910. As it turns out, Broadberry understates U.S. productivity for the key sectors of agriculture, construction, and trade by up to 100 percent.4
Broadberry, “Forging Ahead” and “How did the United States.”
After adjusting his estimates, we find that U.K./U.S. GDP implied by sectoral productivity data accord with our direct estimates. Next, we show Broadberry's criticisms of our price data stem from his misinterpretation of the methodology of international comparisons. Our price benchmarks compare price levels across space at a point in time. Broadberry, however, uses our price data to compare price levels over time.
5 Broadberry, “Relative Per Capita Income Levels.”
This leads him to misread disparities between domestic price indices and our U.K./U.S. price levels. We also address his concerns regarding our nominal GDP estimates.
SECTORAL PRODUCTIVITIES
Broadberry begins his comment with a discussion of sectoral productivity drawing on his earlier work.6
Broadberry, “Relative Per Capita Income Levels,” “Forging Ahead,” and “How did the United States.”
He claims his U.K./U.S. sectoral labor productivity estimates support the long-span U.K./U.S. projections over our direct estimates. We agree with Broadberry that it is important to reconcile our direct estimates with his sectoral comparisons. This section provides our reconciliation.
The appendix provides U.K./U.S. sectoral comparisons for overall GDP as well as for the nine sectors considered in Broadberry's 1997 article: agriculture, mining, manufacturing, construction, trade, transportation, public utilities, finance/services, and government.7
Broadberry, “Forging Ahead.”
As it turns out, Broadberry overstates U.K./U.S. output levels for agriculture, trade, construction, and transportation. After adjusting his estimates, the sectoral data provide powerful support for our direct estimates.
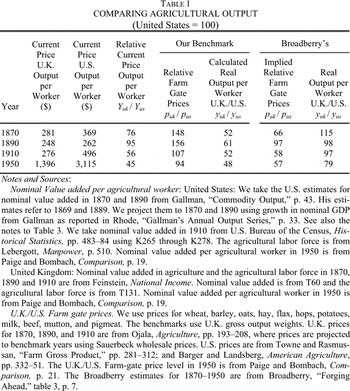
The problems with Broadberry's estimates are best seen for agriculture, which is central to U.K./U.S. productivity comparisons. Table 1 presents estimates of U.K./U.S. agricultural labor productivity in nominal and real terms for 1870, 1890, 1910, and 1950. Columns 2 and 3 give nominal U.K. (Yuk) and U.S. (Yus) value added per agricultural worker in U.S. dollars obtained from standard sources. Column 4 shows the ratio of U.K./U.S. value added per worker at market exchange rates, (Yuk/Yus). The United Kingdom has lower nominal value added for all years.
We provide U.K./U.S. farm-gate price level benchmarks (puk/pus) in column 5. These are direct comparisons of U.K./U.S. farm-gate prices. As we would expect, the United Kingdom has substantially higher farm prices before 1910. They are 50 percent higher in 1870 falling to 7 percent above U.S. prices in 1910. The levels and trends in our U.K./U.S. farm prices in Table 1 are consistent with other evidence on food price gaps for the 1870–1910 period.8
See O'Rourke and Williamson, Globalization.
We use the price benchmarks to calculate relative real output per worker in column 6, (yuk/yus). The results show U.S. output per worker at double U.K. levels for most years.
Column 8 gives Broadberry's estimates of U.K./U.S. real output per worker.9
Broadberry, “Forging Ahead.”
He derives his estimates by extrapolating Lazlo Rostas's 1937 agricultural benchmark with domestic output indices.
10. In contrast to our results, he finds the United Kingdom with a 15-percent lead in 1870. Labor productivity is roughly equal in 1890 and 1910 and the United States has a 20-percent lead in 1950. Column 7 gives the relative farm-gate price levels implied by his estimates. Remarkably, they imply U.K. farm-gate prices are 70 percent of U.S. levels in 1870 and 60 percent in 1910. This is impossible given the United States is an agricultural exporter.
Thus, Broadberry's estimates for agriculture appear to be off by a factor of up to 100 percent.11
Broadberry, “Forging Ahead.”
Two conclusions follow. First, his projections yield flawed measures of relative output per worker for agriculture.
12 What explains these differences? First, Broadberry (“Forging Ahead,” p. 7) relies on Rostas (Productivity), who appears to underestimate U.K./U.S. output per worker for 1937, see Clark, Conditions, p. 244. Broadberry (ibid., pp. 27–31) also checks his agricultural projections against agricultural benchmarks for 1870, 1890, and 1910. His nominal value-added estimates are close to ours for 1870 and 1890. For 1910, he uses output per worker for Great Britain ($378) rather than the United Kingdom ($276). In addition, his U.S. value-added estimates ($347) are lower than ours ($496). Finally, Broadberry provides agricultural PPPs for 1870 and 1890 based on wheat prices. His estimates imply a U.K./U.S. price level of 1.25 for 1869–1871 and 1.16 for 1889–1891. Leaving aside the merits of a PPP based on one commodity, we find larger gaps for wheat prices. More generally, Patrick O'Brien and Leandro Prados de la Escosura (“Agricultural Productivity”) outline the difficulties in projecting sectoral productivities for agriculture over long spans.
Second, he must overstate overall output per worker for the United Kingdom (relative to the United States) for 1870 and 1890 by a considerable margin.
13 Correcting agriculture and leaving all Broadberry's other sectoral estimates unchanged leads to a U.K./U.S. output per worker of 81 for 1870 as compared to his estimate of 108.
There are also problems with Broadberry's U.K./U.S. output levels for trade, construction, and transportation.14
Broadberry, “Forging Ahead.”
In each case, he overstates U.K./U.S. output levels. The appendix provides our direct benchmark estimates of U.K./U.S. GDP per worker.
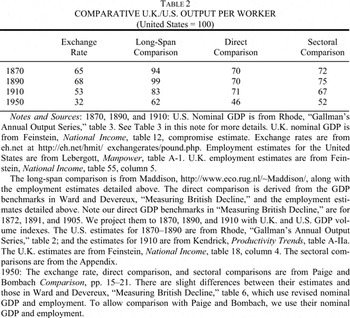
Table 2 pulls together estimates of U.K./U.S. output per worker from the various methodologies. The first column compares output per worker using market exchange rates. In nominal terms, U.S. output per worker is higher for all years. The second column gives output per worker derived from Maddison's long span GDP estimates.15
Maddison, Monitoring the World Economy and World Economy
. These show the United States with a slight lead in 1870 and 1890.
16 Our long-span estimates of U.K./U.S. output per worker are higher for 1870 than Maddison's, (World Economy) as we adjust his U.S. labor force estimates; see Ward and Devereux, “Measuring British Decline,” p. 841. Maddison, World Economy, p. 349, shows the United Kingdom as ahead for 1870.
The United States is well ahead in 1910 and 1950.
The next column provides the direct estimates derived from our article and criticized by Broadberry.17
Ward and Devereux, “Measuring British Decline,” and criticized by Broadberry, “Relative Per Capita Income Levels.”
In contrast to Maddison's estimates, they show the United States with a commanding lead in terms of output per worker from 1870.
18 Maddison, Monitoring the World Economy and World Economy.
The final column gives U.K./U.S. GDP per worker derived from the sectoral productivity estimates presented in the Appendix. After adjusting Broadberry's estimates, the sectoral estimates show U.K./U.S. output per worker that is similar to our direct estimates.
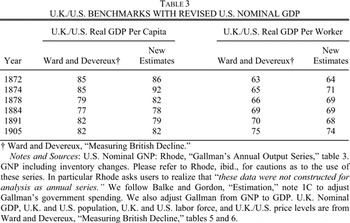
19 Broadberry, “Forging Ahead.” Paige and Bombach (Comparison, p. 112) discuss why sectoral productivity estimates tend to be favorable to the United Kingdom. The U.S. lead in output per capita is smaller due to lower labor force participation ratios; see Table 3.
Broadberry claims that sectoral comparisons conflict with our direct comparisons of U.K./U.S. GDP.
20 Broadberry, “Relative Per Capita Income Levels.”
In fact, they provide powerful independent confirmation of our work.
RELATIVE U.K./U.S. PRICE LEVELS
Next, Broadberry questions the validity of our price data.21
We will use this section to reply to his criticisms. We will then move to a general discussion of differences between direct and long-span estimates. At this point, it worth reminding our readers that we provide comparisons of U.K./U.S. real GDP at isolated points in time where U.K./U.S. nominal GDP is deflated using price comparisons based on goods and services that are directly comparable
between the United States and the United Kingdom in each benchmark year. This is the standard procedure in the international comparison literature from Milton Gilbert and Irving Kravis to the present.
22 Gilbert and Kravis, International Comparison.
Such price comparisons across space are distinct from price comparisons
over time in either the United States or the United Kingdom such as the CPI or the GDP deflator.
23 Dalgaard and Serensen (“Consistency,” pp. 6–7) provide a recent discussion of the conceptual differences between international comparisons over time and those across space.
Our U.K./U.S. price level benchmarks are for 1872, 1874, 1878, 1884, 1891, 1905, and 1930. For 1872 to 1891, we rely on a series of surveys associated with Carroll D. Wright.24
Wright pioneered field data collection techniques used in international comparisons when he served as the Chief of the Massachusetts Bureau of Statistics of Labor and later as the U.S. Commissioner of Labor. His work on international comparisons pre-dates the Board of Trade by 30 years. Furthermore the Board of Trade's mandate to collect retail price and wage statistics appears to have been the result of similar work completed in the United States under Wright's direction. See Phelps Brown and Browne, “Carroll D. Wright,” pp. 279–81.
For 1905 and 1930, we use the Board of Trade and International Labor Organization studies.
25 These studies do not cover all of consumption nor do they cover investment. We fill these categories from other sources, see Ward and Devereux, “Measuring British Decline,” pp. 830–31.
As far as possible, we tried to ensure our benchmarks covered broadly similar areas of consumption, that is food, rent, and so on at each point in time. Yet the price data differ across each benchmark in terms of compilation methods, coverage, and the specification of goods sampled.
26 There are similarities between our surveys for 1872, 1874, 1878, and 1884. Indeed our U.S. data for 1872, 1874, and 1878 are from the Weeks report used in the U.S. CPI. There are, however, large differences between these price data and those for 1884, 1891, 1905, and 1930.
This means that any comparison of price levels over time for the United States or the United Kingdom using our data is invalid.
27 For example, we form the 1891 price benchmark using 89 items as opposed to 33 items for the 1905 price benchmark. Furthermore the quality of the items compared is not constant across the benchmarks. Finally, we do not provide U.K. or U.S. clothing prices for each year rather we provide U.K./U.S. relative price indices.
Likewise, our benchmark comparisons of U.K./U.S. GDP do not allow us to determine U.S. or U.K. growth rates in isolation.
Broadberry's criticisms of our price data show his failure to grasp these fundamental points.28
Broadberry, “Relative Per Capita Income Levels,” does not reference the huge literature on international comparisons.
He devotes most of his comment to using our price data to compare price levels across time forming CPIs, GDP deflators, and domestic output indexes for the United States and the United Kingdom. He argues our price data are flawed as he finds differences between his new indexes on one hand, and U.S. and U.K. domestic CPIs, GDP deflators, and output indexes from standard sources.
29 Broadberry (ibid.) never discusses our price data. This is surprising given the lengths we go in our article to emphasize that we relied on price data collected specifically for purposes of international comparison. Furthermore, Broadberry refers to the “Ward and Devereux price index.” It should be clear that we compare prices across space. We do not provide domestic price indices and we never intended our data for use in this fashion.
There are two points to consider. First, our data are completely ill-suited for use in the manner that Broadberry uses them.30
We are not aware of any work prior to Broadberry, ibid., that uses the Board of Trade or ILO data to estimate inflation rates for either the United States or the United Kingdom. Nor are we aware of cases where researchers use data from the benchmarks of the International Comparison Project to compute inflation within an economy. One reason for Professor Broadberry's inappropriate use of our data is that we did not have the opportunity see his work prior to publication. Although he widely circulated his comment, we learned about it when it appeared next to our paper.
To repeat, our price data are to provide comparisons across space at a point in time. They cannot be used to compare prices over time. Second, contrary to Broadberry's claims, the differences between the growth-rate differentials implied by our benchmarks and national accounts data for the United States and the United Kingdom are not unusual. They are to be expected in all international comparisons. Robert Summers and Alan Heston, for example, discuss this point in reference to the Penn World Tables
31 Summers and Heston, “Penn World Table,” p. 340.
:
One should expect a problem to arise from working with intertemporal (national accounts) and interspatial (ICP) data sets that appear to view country-time interrelations in the same way but in fact do not. The problem at hand in part is one of merging different data sets not based on identical prices and goods… In fact the two data sets are far from being perfectly in accord. In many cases, a country's standings in consecutive benchmark studies—at the level of GDP or its components—imply a growth rate between the benchmarks years that differs significantly from the growth rate embedded in the constant price series of the country's national accounts.
Recently, such differences are documented in detail in reference to the various benchmarks studies of the OECD and Eurostat.32
Varjonen, “Consistency,” pp. 3–5 and 12–13, documents these differences for GDP and its components in 1993, 1996, and 1998. The differences are often large.
These differences have spurred research to identify procedures for reconciling the benchmarks with national accounts data, a process that is seen as essential to improving the comparability of national accounts.
33 See for example, Heston and Summers, “What can we Learn”; Aten and Heston, “Benchmark Reconciliations”; and Varjonen, “Improving the Quality.”
There is an important general point to be made here about the inevitability of some conflict between long-span and direct U.K./U.S. comparisons. It is well known in the literature that using national accounts data to project any benchmark international comparison of relative GDP to other years yields differences between other benchmark levels and the projected levels. The point to note is that these differences are not symptoms of problems with price data. Rather, they are an empirical reality that must be addressed by economic historians in any effort to develop consistent space-time international comparisons.
It is clear that work towards reconciliation of our pre-1950 benchmarks and national accounts data will be a fruitful area for future research. It is one that we plan to pursue. A comparison of our consumption benchmarks with the U.S. and U.K. CPIs provides some initial explanations for such differences. First, there are differences in weighting and coverage. Our benchmark weights are for overall consumption whereas the U.K. and U.S. CPIs use working-class weights. There are also large differences in coverage. For instance, the U.S. CPI does not cover travel or services and it covers alcohol only after 1890. As a result, price benchmarks will equal extrapolations from other price benchmarks only by chance. It seems fair to point out that Broadberry seems oblivious to such matters.34
Broadberry, “Relative Per Capita Income Levels.”
NOMINAL GDP
Finally, Broadberry is unhappy about our nominal GDP.35
We compared U.K./U.S. GDP using conventional measures of nominal GDP. Again this is the standard procedure in the literature. Broadberry, however, believes our nominal GDP estimates are flawed. As we understand it, his argument is that because we provide new price indices for each country we are also obliged to change nominal GDP. Broadberry and Douglas Irwin provide a clear statement of this principle in a recent working paper where they state
36 Broadberry and Irwin, “Labor Productivity,” p. 16.
:
To a large extent the value of nominal GDP in historical income accounts is obtained by reflating volume indicators using limited price information. If the price information set is expanded, it is appropriate to calculate new estimates of nominal GDP. It is incorrect to leave nominal GDP unchanged and to use the new price information to derive different estimates of real GDP.
Broadberry's comments reveal his misunderstanding of our methodology and, more generally, of the methodology of international comparisons.37
Broadberry, “Relative Per Capita Income Levels.” Furthermore, his comments would seem to apply equally to the Penn Tables and the various benchmarks of the International Comparison Project. To accept his points would cast doubt on all international expenditure comparisons.
To belabor the point made previously, we do not present new price indices for either economy. Rather we present U.K./U.S. comparative price benchmarks. As discussed earlier, our price data cannot be used to compare domestic price changes over time.
We are, however, grateful to Broadberry for drawing our attention to the general issue of nominal GDP and in particular to the U.S. data. The U.S. estimates before 1929 stem from the work of Simon Kuznets as extended by John Kendrick and Robert Gallman.38
Kuznets, National Product and Capital, as extended by Kendrick, Productivity Trends; and Gallman, “Gross National Product.”
Gallman provides the most complete series.
39 Broadberry (“Relative Per Capita Income Levels”) restricts his comments to Kuznets, NationalProduct and Capital. Gallman, “Gross National Product,” is, however, the basis for subsequent work, see Rhode, “Gallman's Annual Output Series,” pp. 15–16. As Rhode emphasizes, Gallman did not construct his series for analysis of business cycle issues. We do not see this as a problem in our work.
He builds his GNP series using nominal flows for commodity-producing sectors from William Shaw's estimates in producer prices.
40 Next he applies distributive and transportation mark ups along with estimates for services to obtain GNP in final prices. Only then does he form his real GNP series using deflators prepared by Dorothy Brady.
41 Brady, “Price Deflators.” We agree with Broadberry (“Relative Per Capita Income Levels”) about the frailties of the data on nominal GDP for early periods particularly with regard to estimates for nonbenchmark years. On the other hand, it is not clear to us why interpolation methods should systematically bias the estimates of nominal GDP in a particular direction for purposes of international comparison.
The Gallman nominal series is thus conceptually a nominal series. It is therefore appropriate for our purposes.
On the other hand, more recent U.S. GDP estimates of Christina Romer and of Nathan Balke and Robert Gordon follow different procedures.42
Both Romer, “Pre-War Business Cycle”; and Balke and Gordon, “Estimation,” accept the long-run trends in the Gallman series but they adopt different procedures to estimate noncommodity production. Furthermore, Balke and Gordon use new interpolators and a different GDP deflator. As a result, their series for nominal GDP do not correspond conceptually to the Gallman series.
To keep our sources consistent with Maddison's, we took U.S. nominal GDP for the late nineteenth century from Balke and Gordon's work.
43 Maddison, Monitoring the World Economy and World Economy; Balke and Gordon, “Estimation.”
Prompted by Broadberry's concerns, we now believe it is better to use Gallman's nominal series, which are available for 1870 to 1909 from Paul Rhode.
44 Rhode, “Gallman's Annual Output Series.”
shows that this modification in no way changes the central findings of our article.
SUMMING UP
In our article we used U.K./U.S. price-level benchmarks to derive new estimates of U.K./U.S. output per worker and income per capita from 1870 to 1990. Broadberry challenges our estimates on the grounds they are inconsistent with his U.K./U.S. sectoral productivity comparisons, that they conflict with U.S. and U.K. price indices, and that we mismeasure nominal GDP. In regard to his first point, our findings accord with estimates based on sectoral data when we adjust the estimates in Broadberry's earlier pieces.45
Broadberry, “Forging Ahead” and “How did the United States.”
We have also shown that his second and third criticisms arise from his misunderstanding of our methodology. In sum, we find nothing in Broadberry's note to suggest our original conclusions were mistaken.
Appendix: Sectoral Comparisons
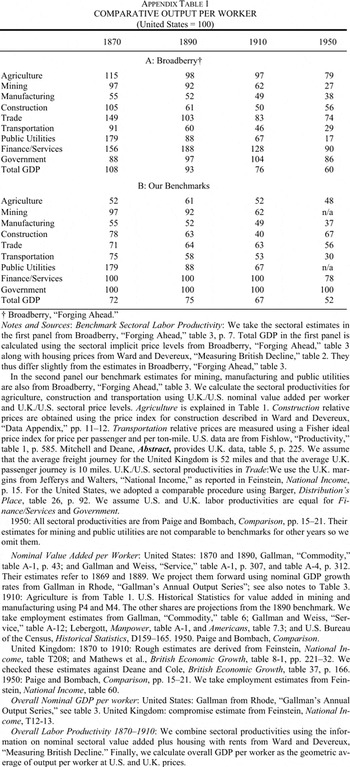
This appendix provides U.K./U.S. sectoral comparisons from 1870 to 1950 for overall GDP as well as for the nine sectors considered by Broadberry: agriculture, mining, manufacturing, construction, trade, transportation, public utilities, finance/services, and government.46
Broadberry, “Forging Ahead.”
The first panel in
Appendix Table 1 gives Broadberry's estimates of real output per worker.
47 These are projections from his 1937 benchmark.
We provide new estimates of sectoral productivity in the second panel. In contrast to Broadberry's estimates, our estimates are built around direct comparisons of output rather than projections.48
Ibid. See Ward and Devereux, “New Benchmark Estimates,” for the complete details.
We have already discussed our agricultural benchmarks. To compare output per worker in construction, we use relative nominal value added and a price benchmark of building wages and input prices. For transportation, we compare costs per passenger mile and per ton-mile. For trade, we form estimates of the quantity of goods flowing through wholesale and retail channels. For manufacturing, mining and public utilities, we accept Broadberry's estimates.
49 Broadberry, “Forging Ahead.
Finally, we assume that labor productivity is equal for finance/services and government.
50 Although this assumption is not ideal, it is widely used in the literature. Replacing our estimates for these sectors with those of Broadberry, “Forging Ahead,” has a small impact on overall GDP per worker.
Our U.S. labor productivities are higher for each of agriculture, construction, distribution, and transport. The new estimates have striking implications for overall U.K./U.S. output per worker. It is now below the United States for all benchmark years. It is 72 percent of U.S. levels in 1870. Although it increases to 75 in 1890, it falls back to 67 in 1910. By 1950, it is down to 50 percent of U.S. levels.
We would like to thank Michael Edelstein, Knick Harley, Alan Heston and Leandro Prados de la Escosura for valuable comments and suggestions. The usual disclaimer applies.