

American conservatives have been vocally critical of US free-trade policies since the first Trump administration. Those critiques are wide ranging but frequently based on the impact of trade on blue-collar male wage earners and the viability of family structures that depend on it.Footnote 1 Consider the following examples. Senator Josh Hawley (R-MO) addressed the National Conservatism Conference in 2021 as follows:
Over the last 30 years and more, government policy has helped destroy the kind of economy that gave meaning to generations of men….Domestic manufacturing once supported millions of American men with good wages, who in turn started and supported families. Now that industry lies all but dead on the altar of globalism. (Hawley Reference Hawley2021)
Senator Marco Rubio’s (R-FL) 2023 campaign book provides a similar if more restrained version of the same idea:
After years of globalization…[i]t is no longer possible for the vast majority of Americans to raise a family on a single earner’s wages. (Rubio Reference Rubio2023)
Although they are newly ascendant, these are not new ideas about trade and gender relations. Presidential consultant Patrick Buchanan’s Reference Buchanan1988 campaign book argued that:
…free trade drives down men’s wages, forcing more women into the workforce and leading to “broken homes…delinquency, vandalism, crime.” (Buchanan Reference Buchanan1988, 286)
These public pronouncements echo what trade-skeptical conservative policy makers at least occasionally claim among themselves. In internal communications, Peter Navarro, President Donald Trump’s long-time trade advisor, framed tariff increases not only as a salve for reduced manufacturing employment but also as a solution for lower fertility rates, lower marriage rates, and higher divorce rates.Footnote 2 By reestablishing prior patterns of male employment, trade restrictions can reestablish previously dominant modes of gender relations.
This article explores the relationship in the United States between conservative gender politics and support for protectionism. We first establish the breadth of that relationship. We show that the ideas reflected in the previous quotations are well represented in American public opinion. Gender-conservative Americans are especially skeptical of free trade, even controlling for various confounds. Second, we describe that relationship in greater detail. How long has trade skepticism been connected to gender-conservative politics? Is it a feature of the Trump era or is it longer standing? Is it specific to self-understood conservatives? To men? To what extent is this gender-based critique separable from other conservative critiques of free trade?
We answered these questions by analyzing multiple waves of the American National Election Studies (ANES). Our analysis revealed that gender conservatism—defined for our purposes as a preference for the male-as-breadwinner family model—is a longstanding and stable predictor of trade attitudes. It is not a feature of Trump-era politics. Although the Trump era has coincided with a dramatic shift in the association between conservatism and support for free trade, the relationship between gender conservatism and trade skepticism has remained stable since 2008. It also is broadly generalizable, holding across men and women and controlling for religiosity, economic conditions, and other plausible confounding factors, including a range of alternative indicators of social conservatism—all of which is to state that Americans form their trade attitudes in part through a gender prism. This dynamic is separable (and more enduring) than the more recent Trump-era recalibration of the Republican Party around trade skepticism. Moreover, this relationship is not limited to Republicans. Indeed, as Trump-era politics has more fully pushed Republicans toward trade skepticism, the role of gender politics has been more evident among Democratic voters.
These findings inform academic and practical understandings of trade politics. The main takeaway for scholarly understanding is that American trade-policy preferences are gendered beyond the well-documented gender gap.Footnote 3 The gender politics of American trade lies not only in distinctions between genders but also between Americans with differing views about gender.
This research contributes to the literature on the origins of trade attitudes beyond the Heckscher-Ohlin and Stolper-Samuelsson frameworks. Prominent scholarship in this vein include Mutz (Reference Mutz2021) on social dominance; Brutger and Rathbun (Reference Brutger and Rathbun2021) on fairness; and Kerner, Sumner, and Richter (Reference Kerner, Sumner and Richter2020) on preferences for social responsibility. Other scholars emphasize the importance of social identity and perceptions of how trade affects preferred social hierarchies and structures, as discussed by Baccini and Weymouth (Reference Baccini and Weymouth2021); Guisinger (Reference Guisinger2016); Mutz and Kim (Reference Mutz and Kim2017); and Mutz, Mansfield, and Kim (Reference Mutz, Mansfield and Kim2021). Americans’ opposition to free trade has roots in the threat that it poses to their preferred set of gender relations. Notably, the preference for a single-male-earner household was far more prevalent among our respondents than its actual occurrence, and we found little evidence that being in such a household had a substantial impact. Gender-conservative ideas are linked more strongly to trade skepticism than to material realities.
This finding points to a difference between our study and the previously mentioned research on social identity. “Gender-conservative” is not tightly rooted in ascriptive identity—certainly not in the same way as racial and gender identities. Women in our sample were almost as gender conservative as the men, and there were many gender-conservative Democrats in our sample. Religiosity was only weakly correlated with gender conservatism. In that sense, gender conservatives’ preferences for trade policies that uphold a favored gender order are unlike white Americans’ preferences for trade policies that uphold a favored racial order, and they are not as obviously linked to a desire to help “people like us.”
Because gender-conservative attitudes do not emerge exogenously from demographics, they are informed by experience; therefore, they plausibly reflect the social consequences of trade-related deindustrialization. This does not appear to hold in the aggregate; according to General Social Survey (GSS) data cited herein, American gender conservatism declined sharply as the country deindustrialized. However, at the individual level, people’s embrace of gender conservatism may be part of a broader conservative reaction to trade shocks and globalization (Autor et al. Reference Autor, Dorn, Hanson and Majlesi2020; Baccini and Weymouth Reference Baccini and Weymouth2021; Ballard-Rosa et al. Reference Ballard-Rosa, Malik, Rickard and Scheve2021; Colantone and Stanig Reference Colantone and Stanig2018a, Reference Colantone and Stanig2018b; Milner Reference Milner2021; Mutz Reference Mutz2017; Rodrik Reference Rodrik2021). The methodological implications of regressing political attitudes on other political attitudes are discussed in the methods section. Suffice it to say that whereas our data establish a clear gender component to American trade skepticism, it cannot precisely establish whether (or in what proportion) this represents a free-standing impact of gender conservatism on trade preferences or the adoption of gender conservatism as part of a broader reaction to trade-related deindustrialization (Agnolin et al. Reference Agnolin, Colantone and Stanig2025). We leave that to future research, but the correlation alone is informative for practical politics. American trade attitudes are profoundly intertwined with American gender politics. The Hawleys, Navarros, and Rubios of American politics are tapping into a persistent and broadly felt aspect of American trade politics.
The next section is a brief review of the literature and describes the link between trade skepticism and preferences for a “traditional” male-as-breadwinner family structure.
GENDER, IDEOLOGY, AND TRADE
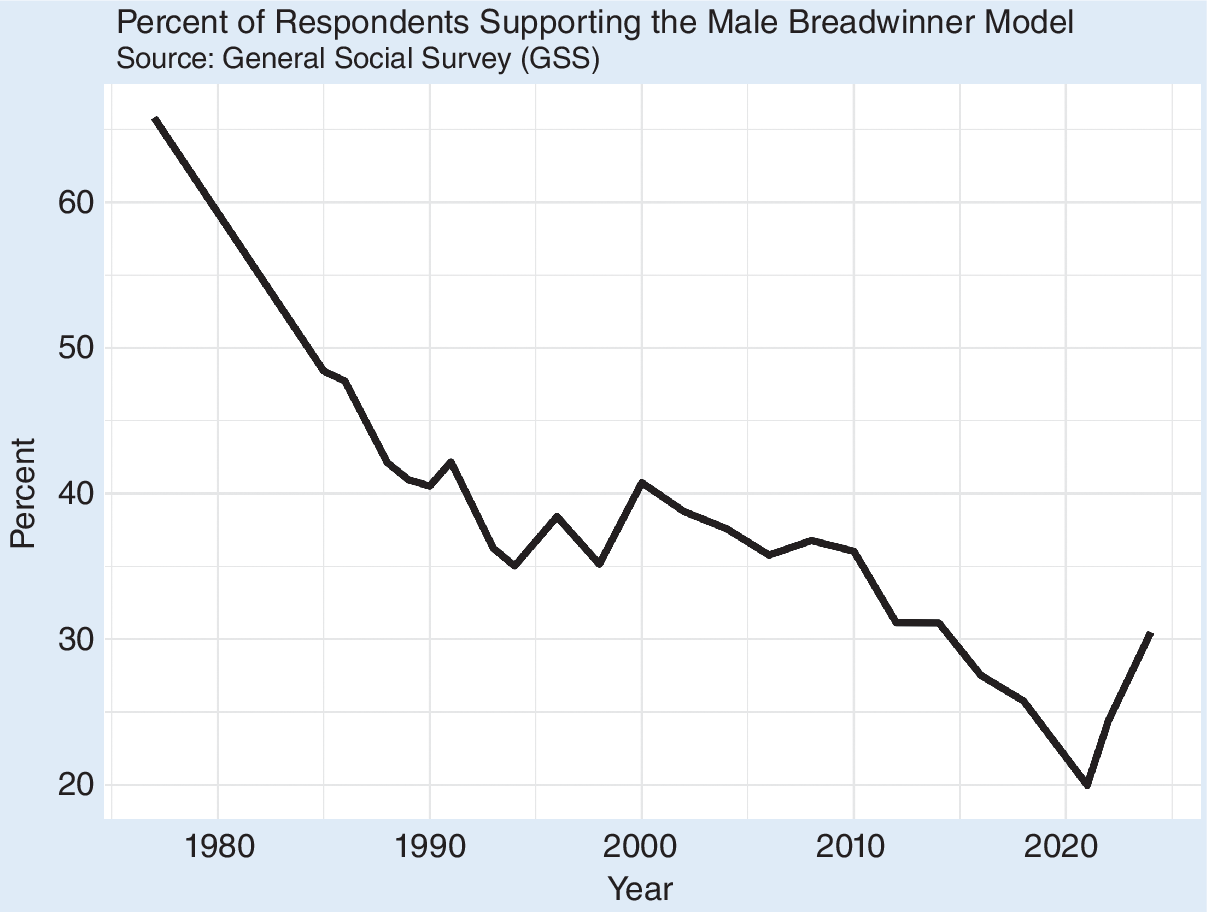
Gender is a key organizer of American social life, and many Americans have deeply held beliefs about which roles are “male” and which are “female.”Footnote 4 This is particularly true for family roles within the family. The introductory quotations evoke a preference for “traditional” family gender roles, including a breadwinner husband and a wife who cares for the home and children.Footnote 5 That traditional model is less popular now than in the past, but it remains popular among many Americans. Support for the male-breadwinner model declined between the late 1970s and the early 1990s, according to GSS data, but it has never been less than 20% (in 2022). Support again may be increasing: 2025 data suggest that it is at approximately 30% (figure 1).
Percentage of Respondents Supporting Male-Breadwinner Model
Percentage of respondents stating that they agree or strongly agree with the statement: “It is much better for everyone involved if the man is the achiever outside the home and the woman takes care of the home and family.” Data from the GSS between 1975 and 2024.

Figure 1 Long description
The horizontal X axis is labeled Year and ranges from 1980 to 2020 with major tick marks every ten years. The vertical Y axis is labeled Percent and ranges from 20 to 60. The data line begins at its highest point in 1977 at approximately 66 percent. It shows a steep linear decrease until the mid-1980s, reaching about 48 percent. From 1985 to 2000, the line continues to trend downward with minor fluctuations, including small peaks around 1991 and 1996, ending the century at roughly 40 percent. Between 2000 and 2010, the trend stabilizes slightly with a gradual decline to 36 percent. After 2010, there is a sharper drop, reaching an all-time low of 20 percent around 2021. The graph concludes with a sharp upward tick to approximately 30 percent by 2024.
The traditional-family model is rarer than preferences for it. According to GSS data, since 1994, approximately one third of Americans with at least one child living in the house consistently supported this model. However, data from the US Census suggest that during this period, a fairly constant 20% to 25% of American (opposite-sex) families had a stay-at-home parent.Footnote 6 This gap suggests that many Americans are unable to live according to their own or others’ preferred family model.
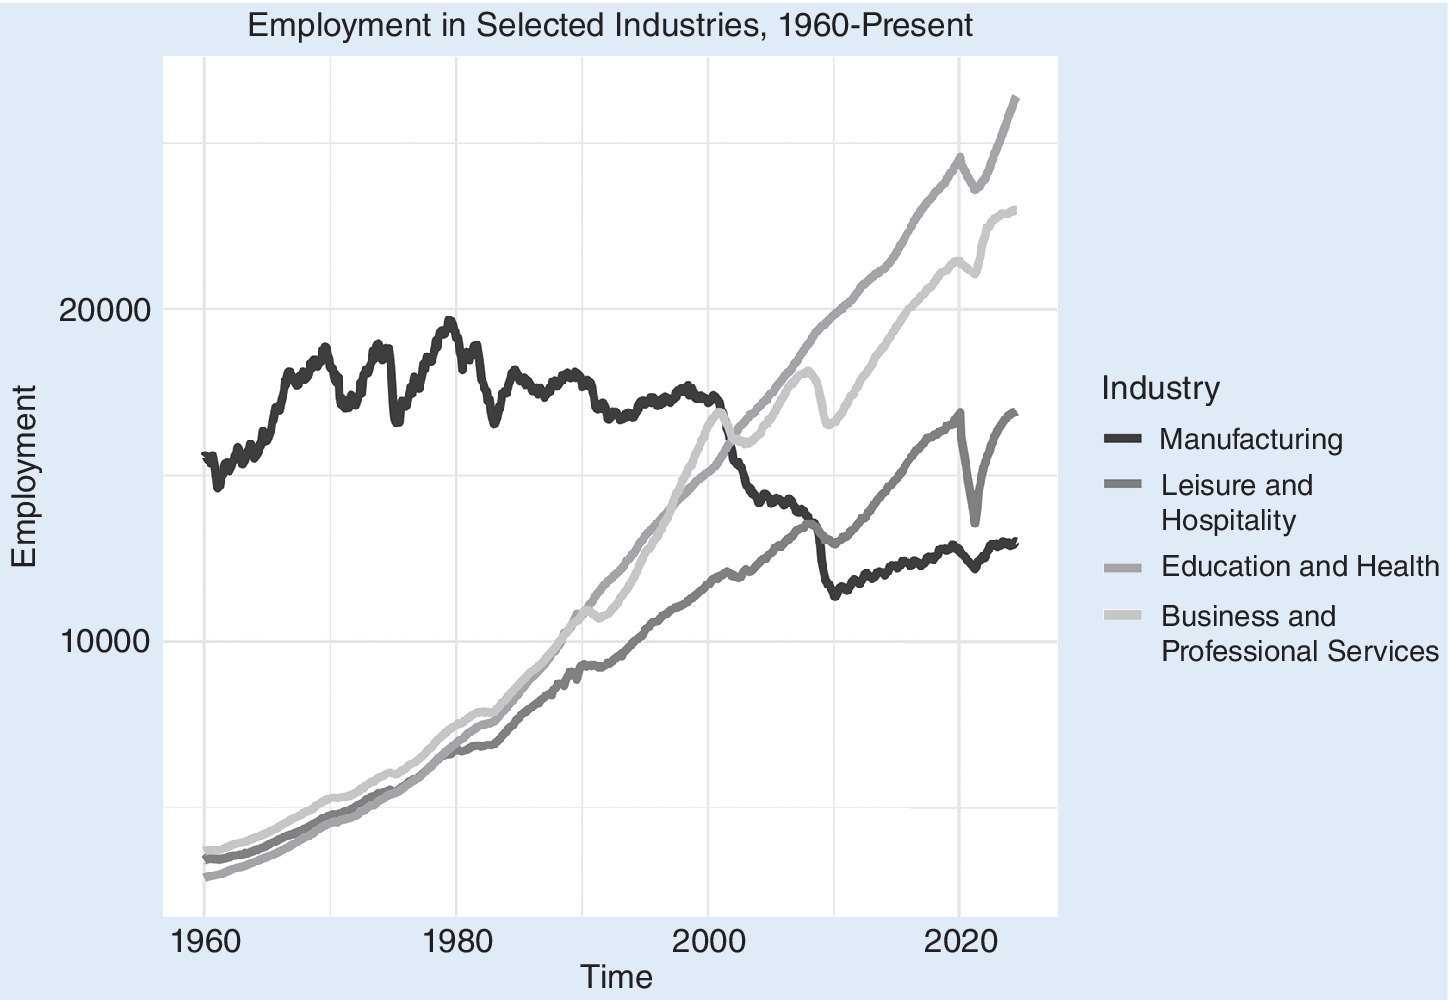
Many observers, including the conservatives quoted in the introduction, attribute that gap to declining blue-collar wages and, ultimately, to the loss of manufacturing jobs that previously supported those wages. In that narrative, male-as-breadwinner family models were more common in the decades following World War II, when the American manufacturing economy provided many mostly male workers without a college degree with a stable, high-paying job.Footnote 7 American manufacturing has been losing employees for decades, as higher-tech, capital-intensive production replaces lower-tech, labor-intensive production that mostly has moved offshore (Charles, Hurst, and Schwartz Reference Charles, Hurst and Schwartz2019). Figure 2 is a graphic depiction of the sharp decline in manufacturing employment beginning in the 1970s. Manufacturing workers as a percentage of total employment declined from a high of approximately 25% in the 1950s and the 1960s to approximately 8%, where it has remained largely stable since 2000. Many of those lost jobs were absorbed by a growing service sector, wherein employment is less stable with fewer opportunities for advancement and lower pay.Footnote 8 The income derived from those jobs often precludes families that are structured around a single breadwinner, male or female (Rose Reference Rose2018).Footnote 9
Employment in Selected Industries, 1960–Present
Data from Federal Reserve Economic Data. April 2020–March 2021 excluded for visibility.

Figure 2 Long description
The X-axis represents Time from 1960 to approximately 2024. The Y-axis represents Employment levels with major ticks at 10000 and 20000.
* Manufacturing: This line starts as the highest sector in 1960 at roughly 15000. It fluctuates with a general upward trend until 1980, peaking near 20000. After 1980, it enters a long-term decline with a sharp drop around 2000 and another around 2008, ending as the lowest sector at approximately 13000.
* Education and Health: This line shows the most aggressive growth. Starting near the bottom in 1960, it maintains a consistent linear increase, surpassing Manufacturing around 2002 and ending as the highest sector, well above 20000.
* Business and Professional Services: This line follows a similar upward trajectory to Education and Health. It starts low in 1960 and grows steadily, surpassing Manufacturing around 2005 and ending as the second-highest sector.
* Leisure and Hospitality: This line also shows a steady upward trend from 1960. It remains below the other service sectors but surpasses Manufacturing around 2010. It features a significant sharp V-shaped dip around 2020 before recovering.
All service-oriented lines show a brief gap or exclusion period between 2020 and 2021 as noted in the caption.
The impact of trade policy on those trends is debatable—and often debated. America’s relatively free-trade policies almost certainly contributed (Autor, Dorn, and Hanson Reference Autor, Dorn and Hanson2016, Reference Autor, Dorn and Hanson2019), but automation and the decline in American labor unions arguably played a larger role. Regardless, trade bears a disproportionate share of the blame (Baccini and Weymouth Reference Baccini and Weymouth2021; Wu Reference Wu2022a, Reference Wu2022b). The particular effect of trade on male-dominated industries makes it an obvious reference point for gender-related concerns.Footnote 10 Data from the US Bureau of Labor Statistics for 2020 indicate that American manufacturing employment is 70.5% male. “Iron and steel mills and steel product manufacturing,” which is particularly exposed to trade competition, is 87.9% male.Footnote 11 Trade shocks in these industries have been linked to declining male employment, higher rates of male idleness, and, consequently, lower marriage rates as well as higher rates of single parenthood (Autor, Dorn, and Hanson Reference Autor, Dorn and Hanson2019) and divorce (Banzhaf Reference Banzhaf2018). Barile, Pruitt, and Parker (Reference Barile, Pruitt and Parker2018); Classen and Dunn (Reference Classen and Dunn2012); Michaud, Crimmins, and Hurd (Reference Michaud, Crimmins and Hurd2016); and Pierce and Schott (Reference Pierce and Schott2020) similarly found that social pathologies associated with trade-related deindustrialization are clustered among men.
Viewed through this lens, tariffs serve to revive male fortunes and, through that, the male-as-breadwinner family model. We view gender-role traditionalism as a mediator between perceptions of trade threats to society as a whole and policy preferences. We are ambivalent about whether Americans learn about that threat through personal experience or by observing a political zeitgeist (including the types of speeches highlighted in the introduction) that reinforces male labor-market instability as a social cost of economic globalization. We assume that everyone is exposed to the idea that globalization trades off consumer surpluses against blue-collar male-employment stability and that gender-role traditionalists are especially unlikely to want to make that trade. That is, Americans perceive trade as threatening male employment stability and that gender-role traditionalists, who place particular value on that stability, favor trade restrictions to maintain it.
Viewed through this lens, tariffs serve to revive male fortunes and, through that, the male-as-breadwinner family model.
This is not to claim that the previous view is accurate or compelling, but this narrative clearly is prominent in political discourse. It is a central part of how conservative politicians and commentators speak about American trade policy. What we do not know is whether these ideas are mirrored in public opinion. Does enthusiasm for gender-role “traditionalism” drive trade skepticism or support for tariffs? For whom and for how long has it done so?
DATA
We answer these questions using data from the ANES. We used waves that included questions that capture our independent variable (i.e., gender conservatism) and our dependent variable (i.e., opposition to free trade), which allowed us to use the 2004, 2008, 2012, 2016, and 2020 waves (Sumner and Kerner Reference Sumner and Kerner2026). The most recent 2024 wave did not ask about trade policy. We analyzed these survey waves separately rather than pooling across them because of changes in question wording and response choices among waves.
INDEPENDENT VARIABLE
We constructed our independent variable using ANES questions that asked respondents whether they preferred a family defined by a male breadwinner and a female homemaker. The ANES has asked those questions since 2004.Footnote 12 The wording varies across waves, as shown in table 1.
Over Time Changes to the Question on Gendered Divisions of Labor

Table 1 Long description
The table consists of three columns: WAVES, QUESTION, and OPTIONS.
* The first row covers the years 2004 to 2008. The question asks respondents to rate their agreement with the statement: It is much better for everyone involved if the man is the achiever outside the home and the woman takes care of the home and family. The response options are Agree, Disagree, and Neither.
* The second row covers the years 2012 to 2020. The question asks: Do you think it is better, worse, or makes no difference for the family as a whole if the man works outside the home and the woman takes care of the home and family? The response options are Better, Worse, and Makes No Difference.
One change to the question wording relates to how it describes the male role. The 2004–2008 iterations referred to the man as “achieving” outside of the home, whereas the 2012–2020 version referred to him as “working.” Moreover, the earlier version characterized the male-breadwinner model as “much better,” whereas later versions omitted the word “much.” Those differences aside, we think the questions capture the same set of attitudes and preferences. The more consequential differences across ANES waves are in the response options. In 2004 and 2008, the ANES asked respondents to “agree, disagree, or neither agree nor disagree” with the pro-male-as-breadwinner prompt. Since 2012, the ANES has asked if the male-as-breadwinner model was “better, worse, or made no difference.” We generated a comparable measure across these questions by dichotomizing responses, with 1 indicating support for a male-as-breadwinner family model and 0 otherwise (i.e., ambivalence or opposition).
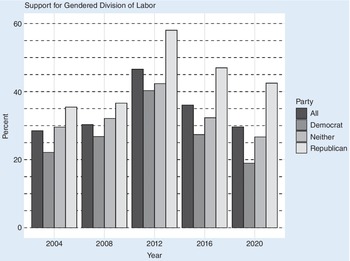
Figure 3 shows the percentage of respondents who, following that operationalization, we coded as gender conservative. We presented these data in the aggregate and broken down by self-reported partisan identification. Gender conservatism in these data increased from 2008 to 2012 but reverted to approximately 2008 levels by 2020. These preferences were driven only partly by partisanship. Republicans were consistently more gender conservative, but as much as 40% of Democrats supported the male-as-breadwinner family model (i.e., in 2012), and that percentage has never decreased much less than 20%.
Support for Gendered Division of Labor, 2004–2020

Figure 3 Long description
The X-axis represents the Year with intervals for 2004, 2008, 2012, 2016, and 2020. The Y-axis represents Percent, ranging from 0 to 60 in increments of 20. A legend on the right identifies four categories: All (darkest gray), Democrat (medium gray), Neither (light gray), and Republican (white).
* 2004: All is at 28 percent, Democrat at 22 percent, Neither at 29 percent, and Republican at 35 percent.
* 2008: All is at 30 percent, Democrat at 27 percent, Neither at 32 percent, and Republican at 37 percent.
* 2012: All is at 47 percent, Democrat at 40 percent, Neither at 42 percent, and Republican at 58 percent.
* 2016: All is at 36 percent, Democrat at 27 percent, Neither at 32 percent, and Republican at 47 percent.
* 2020: All is at 30 percent, Democrat at 19 percent, Neither at 27 percent, and Republican at 42 percent.
Across all years, Republicans show the highest support for gendered division of labor, while Democrats show the lowest. Support peaked for all groups in 2012 before declining in 2016 and 2020.
DEPENDENT VARIABLE
We constructed our dependent variable from a question about protectionism. The question begins with a prompt: “Some people have suggested placing new limits on foreign imports in order to protect American jobs. Others say that such limits would raise consumer prices and hurt American exports.” In the 2004, 2008, and 2012 waves and in half of the 2016 wave (i.e., 2016A), respondents could respond that they favored the statement, opposed it, or “haven’t thought much about this.” In the other half of the 2016 sample (i.e., 2016B) and the 2020 sample, the ANES forced a response by omitting the third option.Footnote 13
We coded our dependent variable as 1 if respondents favored the statement and 0 otherwise, thereby pooling respondents who opposed tariffs with those who had not thought about them. The affirmative support for tariffs captured by this measure was more consistent with our theory.Footnote 14
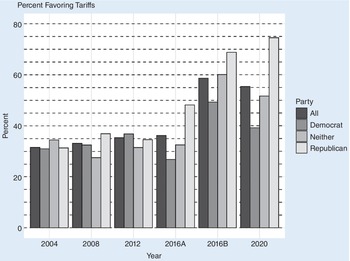
This operationalization choice has evident consequences. Figure 4 shows that support increased significantly from 2016B onward, but this mainly reflects that the survey question now forces a choice. Opposition also increased at a similar rate in subsequent surveys. There was no evidence that the noncommittal respondents favored either option. In fact, the percentage of support in 2016B (58.7%) was almost precisely what we would have observed in 2016A had half of the “had-not-thought-about-it” respondents opted instead to support it (58.5%). As an indicator of facial validity, there was little partisan divide in tariff attitudes before 2016, after which support for tariffs became more clearly a Republican position.
Percentage Favoring Tariffs

Figure 4 Long description
The vertical Y-axis is labeled Percent and ranges from 0 to 80 with increments of 20. The horizontal X-axis is labeled Year and includes the categories 2004, 2008, 2012, 2016 A, 2016 B, and 2020. Each year contains a cluster of four bars representing different groups.
* 2004: All groups are roughly equal between 30 and 35 percent.
* 2008: Support remains stable between 28 and 37 percent.
* 2012: Support remains stable between 32 and 37 percent.
* 2016 A: A slight divergence begins with Republicans rising to nearly 50 percent while Democrats drop below 30 percent.
* 2016 B: A sharp increase across all groups, with Republicans reaching approximately 70 percent and Democrats near 50 percent.
* 2020: A significant partisan gap appears. Republicans rise to roughly 75 percent, while Democrats drop to approximately 40 percent.
A legend on the right identifies the bar colors from darkest to lightest as All, Democrat, Neither, and Republican.
MODELING CHOICES
Estimating associations between gender-role traditionalism and support for tariffs is complicated by the fact that the former is correlated with other attitudes, demographics, and behaviors, many of which also are correlated with trade preferences. We addressed this by estimating multiple models with different combinations of control variables and samples, which allowed us to draw conclusions from trends in coefficient size and significance rather than relying on a single, contestable model specification.
These issues also highlight that the regression of attitudes on attitudes is fundamental to our research design, which comes with some costs. As Agnolin et al. (Reference Agnolin, Colantone and Stanig2025) noted, social attitudes often are informed by material conditions, including trade exposure. As such, “horse-race” models that feature an attitudinal variable in competition with a measure of material conditions cannot conclude that attitudes “matter” more than material conditions—at least to the extent that the attitudes are post-treatment. The result is that causal order can be difficult to ascertain, and we make no such claim in the analysis that follows. It is entirely possible that gender conservatism is at least partly the result of trade exposure. A significant correlation between gender conservatism and trade skepticism could indicate that a fully exogenous component of gender conservatism causes trade skepticism, or that trade exposure causes gender conservatism that in turn fuels trade skepticism, or some combination of both. We also make no claims about causal ordering and the relative extent to which material drivers shape American trade preferences. However, our data can clarify whether there is a gender component to American trade skepticism, which is an essential question in its own right. We tested our predictions using logistic regression with ANES-provided survey weights.Footnote 15
RESULTS
Our main results are presented in table 2, which reports estimates for our key independent variable (i.e., gender-role traditionalism) and our baseline set of controls. These controls include the following:
-
• partisan affiliation, coded as a set of binary indicators of partisan identification as Republican, Democrat, or Neither, with Republican as the omitted category
-
• gender, coded 1 for women and 0 otherwise
-
• race, a dummy variable coded 1 if the survey taker was white and 0 otherwise
-
• age, in years
-
• education, a dummy variable coded 1 if the survey taker graduated from a four-year college and 0 otherwise
-
• marital status, coded 1 if currently married and 0 otherwise
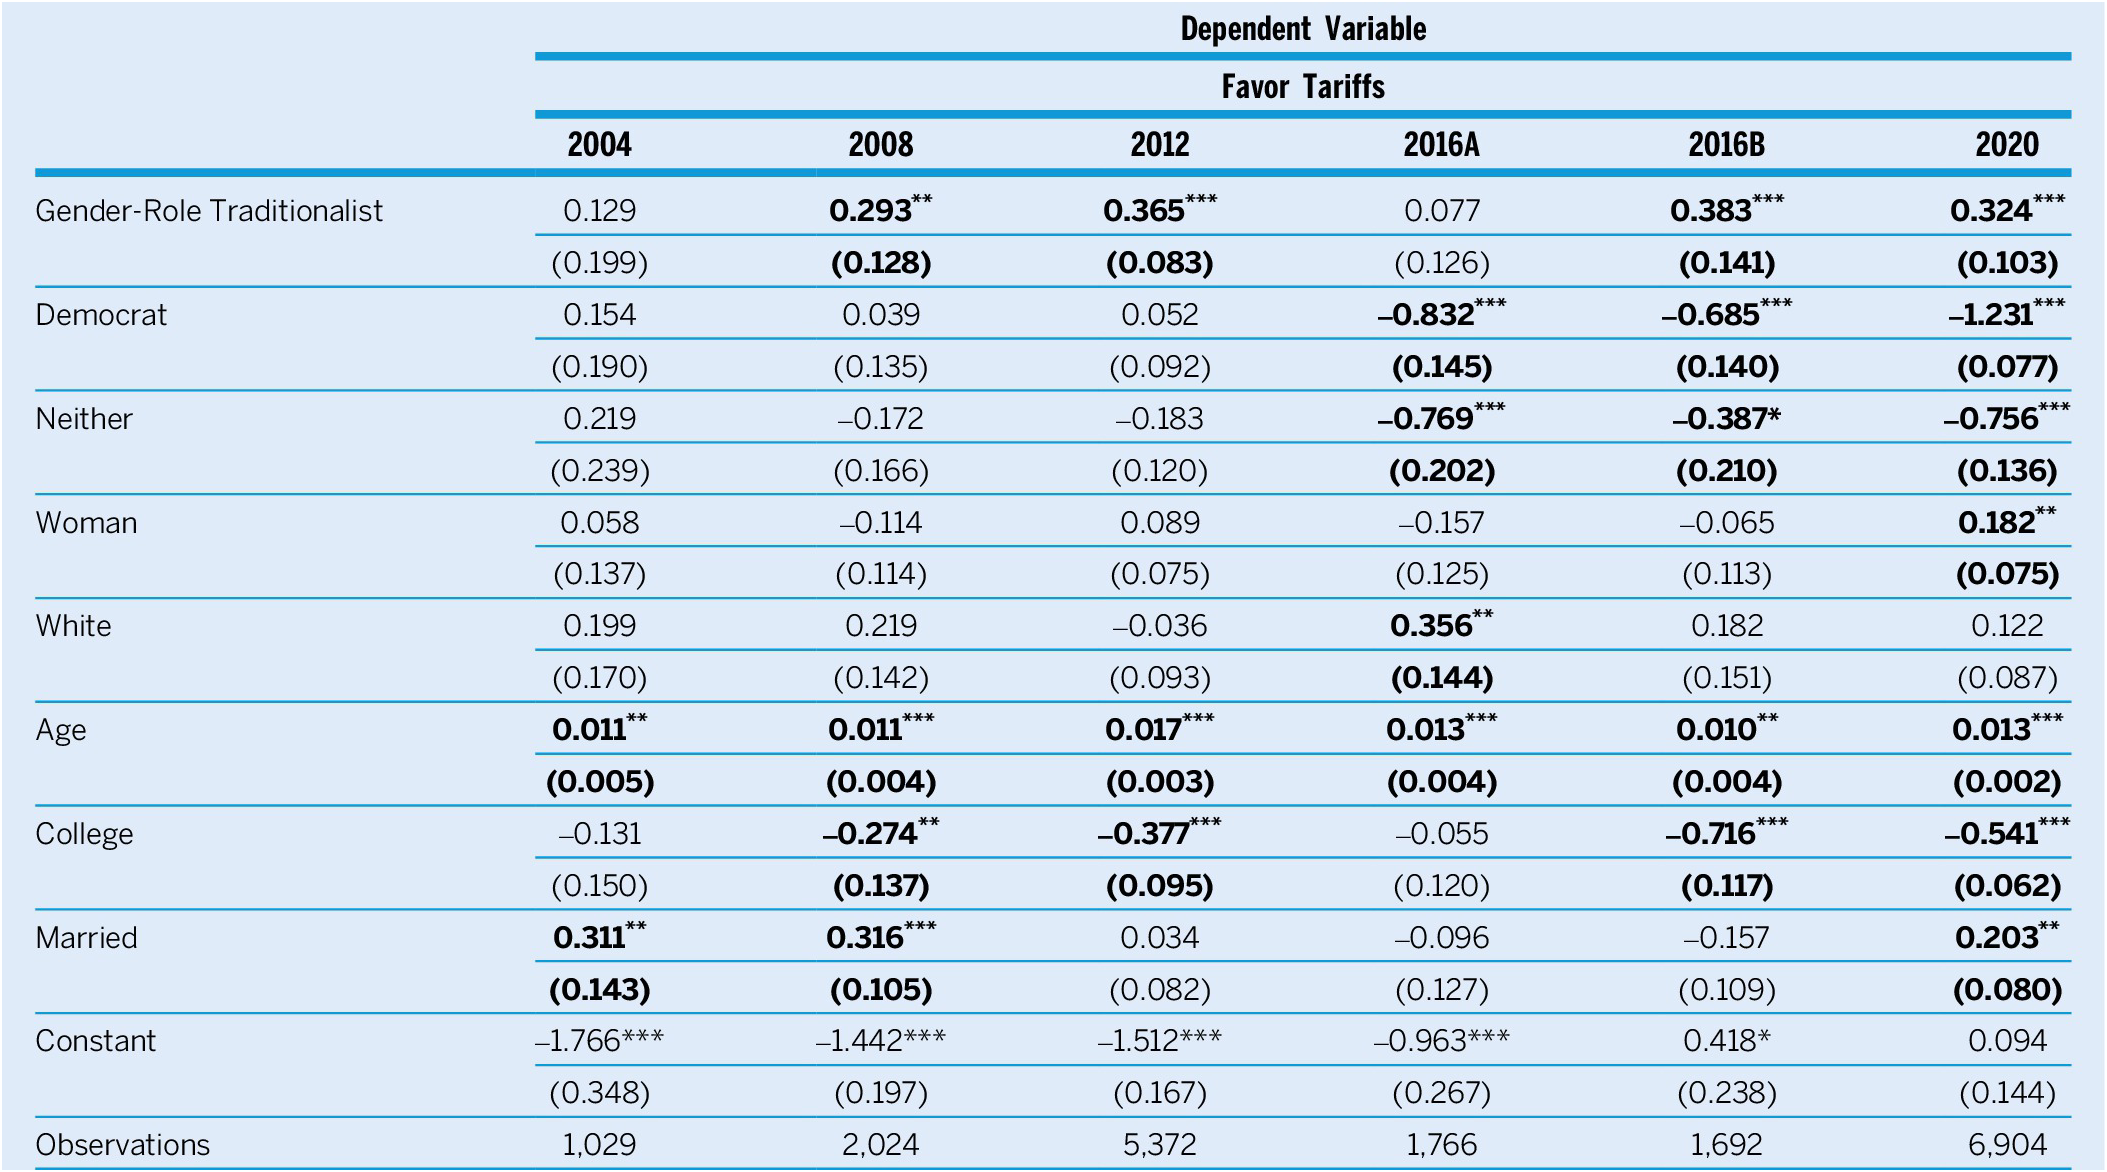
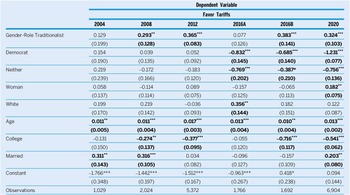
Table 2Results of Main Regression Specification for All Models

Table 2 Long description
The table presents logit regression results where the dependent variable is Favor Tariffs. The columns represent the years 2004, 2008, 2012, 2016 A, 2016 B, and 2020.
Key independent variables and their coefficients (with standard errors in parentheses) include:
* Gender-Role Traditionalist: Shows significant positive coefficients in 2008 (0.293), 2012 (0.365), 2016 B (0.383), and 2020 (0.324).
* Democrat: Shows a shift from non-significant positive values to highly significant negative coefficients in 2016 A (-0.832), 2016 B (-0.685), and 2020 (-1.231).
* Neither (Political Affiliation): Significant negative coefficients in 2016 A (-0.769), 2016 B (-0.387), and 2020 (-0.756).
* Woman: Only significant in 2020 with a positive coefficient of 0.182.
* White: Significant positive coefficient only in 2016 A (0.356).
* Age: Consistently significant positive coefficients across all years, ranging from 0.010 to 0.017.
* College: Significant negative coefficients in 2008 (-0.274), 2012 (-0.377), 2016 B (-0.716), and 2020 (-0.541).
* Married: Significant positive coefficients in 2004 (0.311), 2008 (0.316), and 2020 (0.203).
The number of observations increases over time, from 1,029 in 2004 to 6,904 in 2020. Significance levels are indicated by asterisks: * p < 0.1, ** p < 0.05, *** p < 0.01.
Notes: Each model is a logit regression with survey weights.
*p<0.1; **p<0.05; ***p<0.01.
We estimated this model separately for each wave of the ANES data.
The education indicator warrants special attention because it is intended to control indirectly for material drivers of trade preferences by proxying for class position. Notwithstanding its shortcomings (Hainmueller and Hiscox Reference Hainmueller and Hiscox2007), it remains that the impacts of trade have fallen primarily on workers without a college degree. Alternative employment-based indicators would be misleading. Our theory suggests that a portion of Americans who are dissatisfied with free trade will be in a labor-market position that differs from what they imagined would occur under greater protectionism—for example, men in the service sector who would rather work in manufacturing and women who work outside of the home who would rather work within it. We cannot directly measure this, but education can proxy for whether a person plausibly would be in a trade-sensitive part of the labor market.
Table 2 presents the results for this set of models. We found that gender-role traditionalism was correlated with support for tariffs in 2008, 2012, and 2020 and in the forced-choice portion of the 2016 sample. The coefficients were stable across those estimates. The basic set of findings—that is, support for our hypotheses in 2008, 2012, 2016B, and 2020—is largely consistent. Our findings among the control variables were largely predictable: Democrats were less favorable to tariffs beginning in 2016, older people were more favorable toward tariffs, and people with a college degree were less favorable toward tariffs.
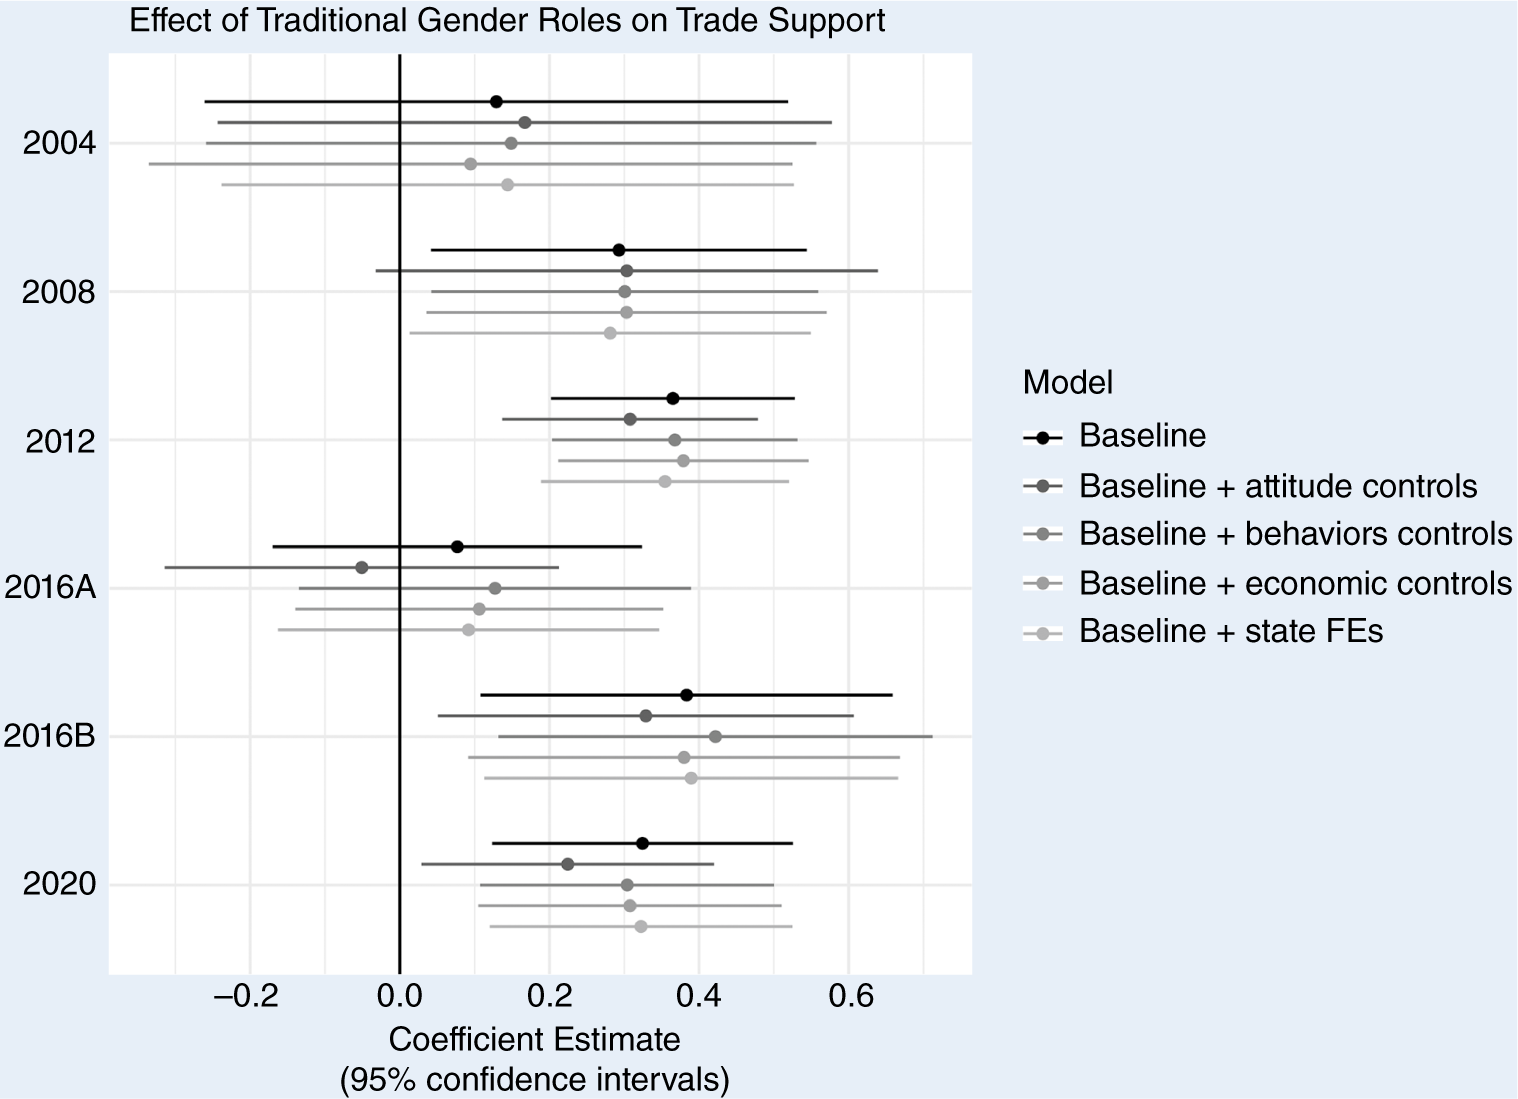
In addition to the baseline model, we ran four other models with different sets of controls. Due to space limitations, we summarized all additional models using the coefficient plot in figure 5. (Full results are in online appendix A.) Each dot on the figure represents the coefficient on gender-role traditionalism and the horizontal bars indicate the 95% confidence interval surrounding that estimate. These models are as follows:
-
• The second model contains social-attitude controls (i.e., hostile sexism, opposition to gun control, preference for decreased immigration, preference for abortion restrictions, and racial resentment).
-
• The third model controls for measures of behavior (i.e., union membership, owning a home, living in a household with a homemaker, owning a gun, and attending religious services at least weekly).
-
• The fourth model includes economic controls (i.e., household income, homeownership, living in a homemaker household, and being employed).
-
• The fifth model adds state fixed effects. The same basic results were obtained in each case.
Figure 5Effect of Traditional Gender Roles on Trade Support
Coefficient on gender-role traditionalism for each wave and each set of controls. All models are logit with dichotomous trade support as the dependent variable. 2016B and 2020 are forced choice.
Figure 5 Long description
A coefficient plot with a horizontal x-axis labeled Coefficient Estimate (95% confidence intervals) ranging from -0.2 to 0.6. The y-axis lists six survey waves: 2004, 2008, 2012, 2016 A, 2016 B, and 2020. A vertical baseline is set at 0.0.
For each year, five models are plotted as dots with horizontal error bars, shaded from black (top) to light gray (bottom). The legend on the right identifies the models as:
- Baseline (black)
- Baseline + attitude controls
- Baseline + behaviors controls
- Baseline + economic controls
- Baseline + state F Es (light gray)
Data trends:
- In 2004, 2008, 2012, 2016 B, and 2020, all coefficient estimates and their confidence intervals are positioned to the right of the 0.0 baseline, indicating a statistically significant positive correlation.
- In 2016 A, the estimates are closer to the baseline, with several confidence intervals crossing the 0.0 line, indicating non-significance for those specific models.
- The highest coefficient estimates are observed in the 2012 and 2016 B waves, peaking around 0.4.

It is not clear why none of the models using 2004 data supported a connection between a preference for traditional gender roles and trade skepticism. Perhaps the association began in 2008, or there may be something unusual about 2004 or the 2004 ANES wave.Footnote 16 The 2016 findings also were somewhat puzzling. The two 2016 samples differed only in whether the survey question forced respondents to choose. Our hypotheses performed much better in the forced-choice version, and it is not immediately clear why this was the case. Assignment to the forced-choice version was random and the samples were balanced, suggesting that differences emerged from a 2016-specific pattern in which non-Republicans were more likely than Republicans to report that they had not thought about the question. Future research on this form of non-response might shed important light on the question.
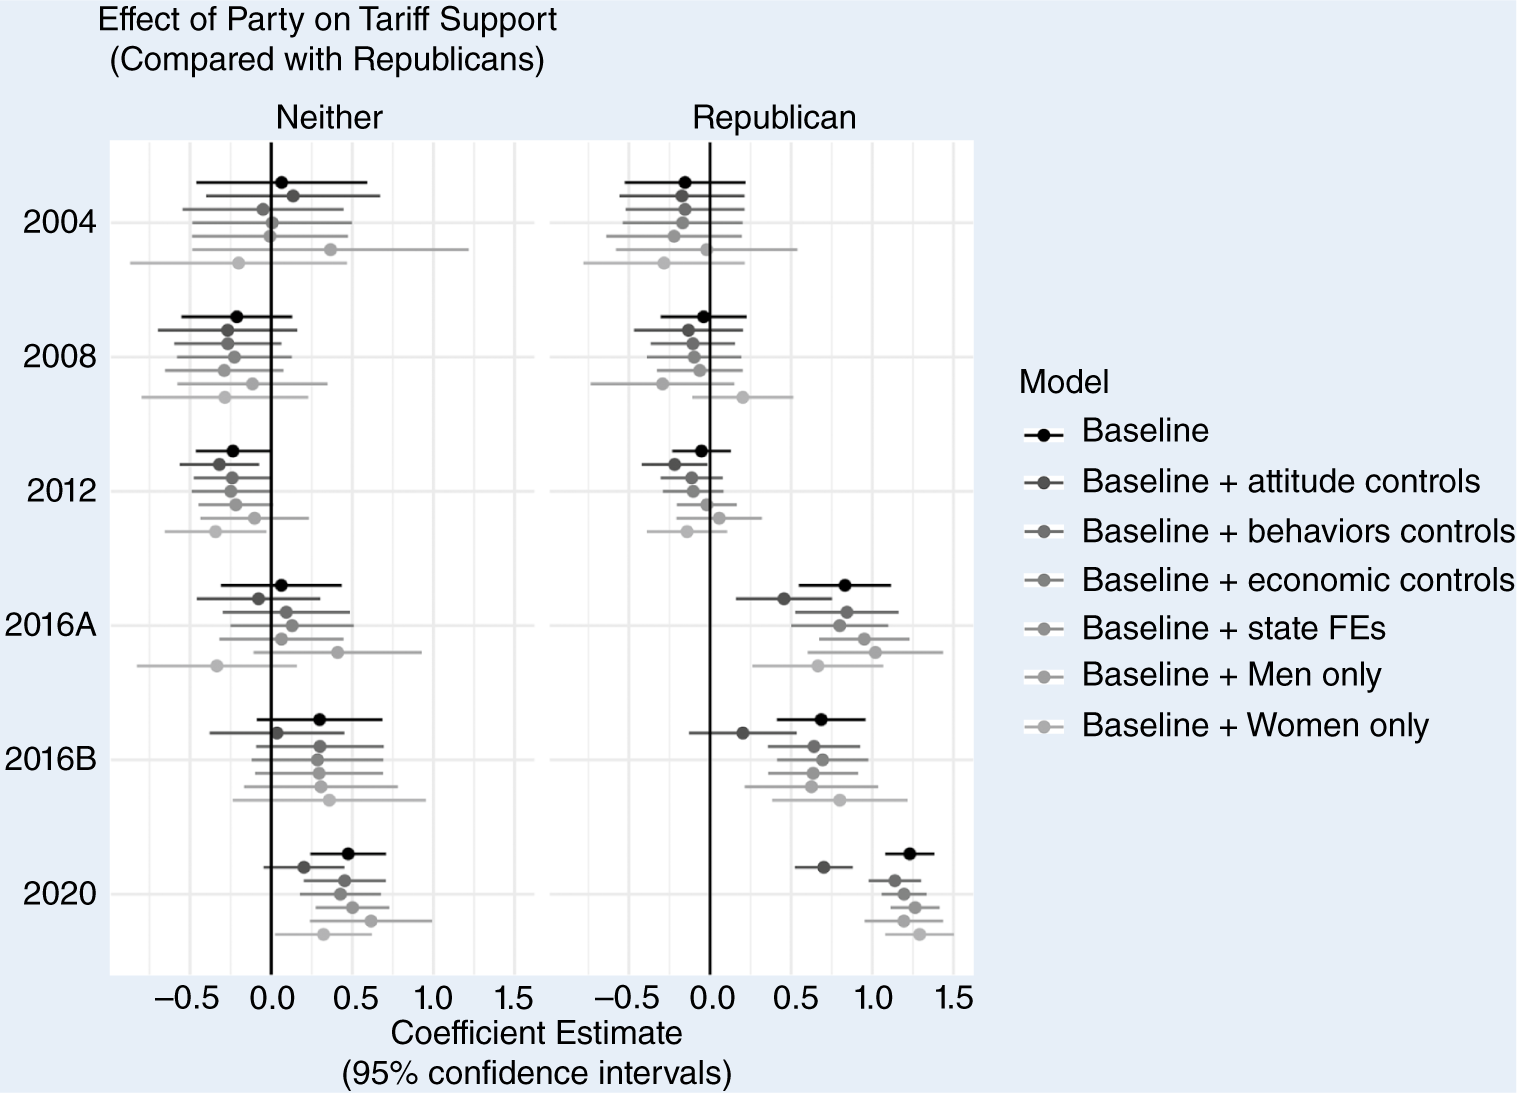
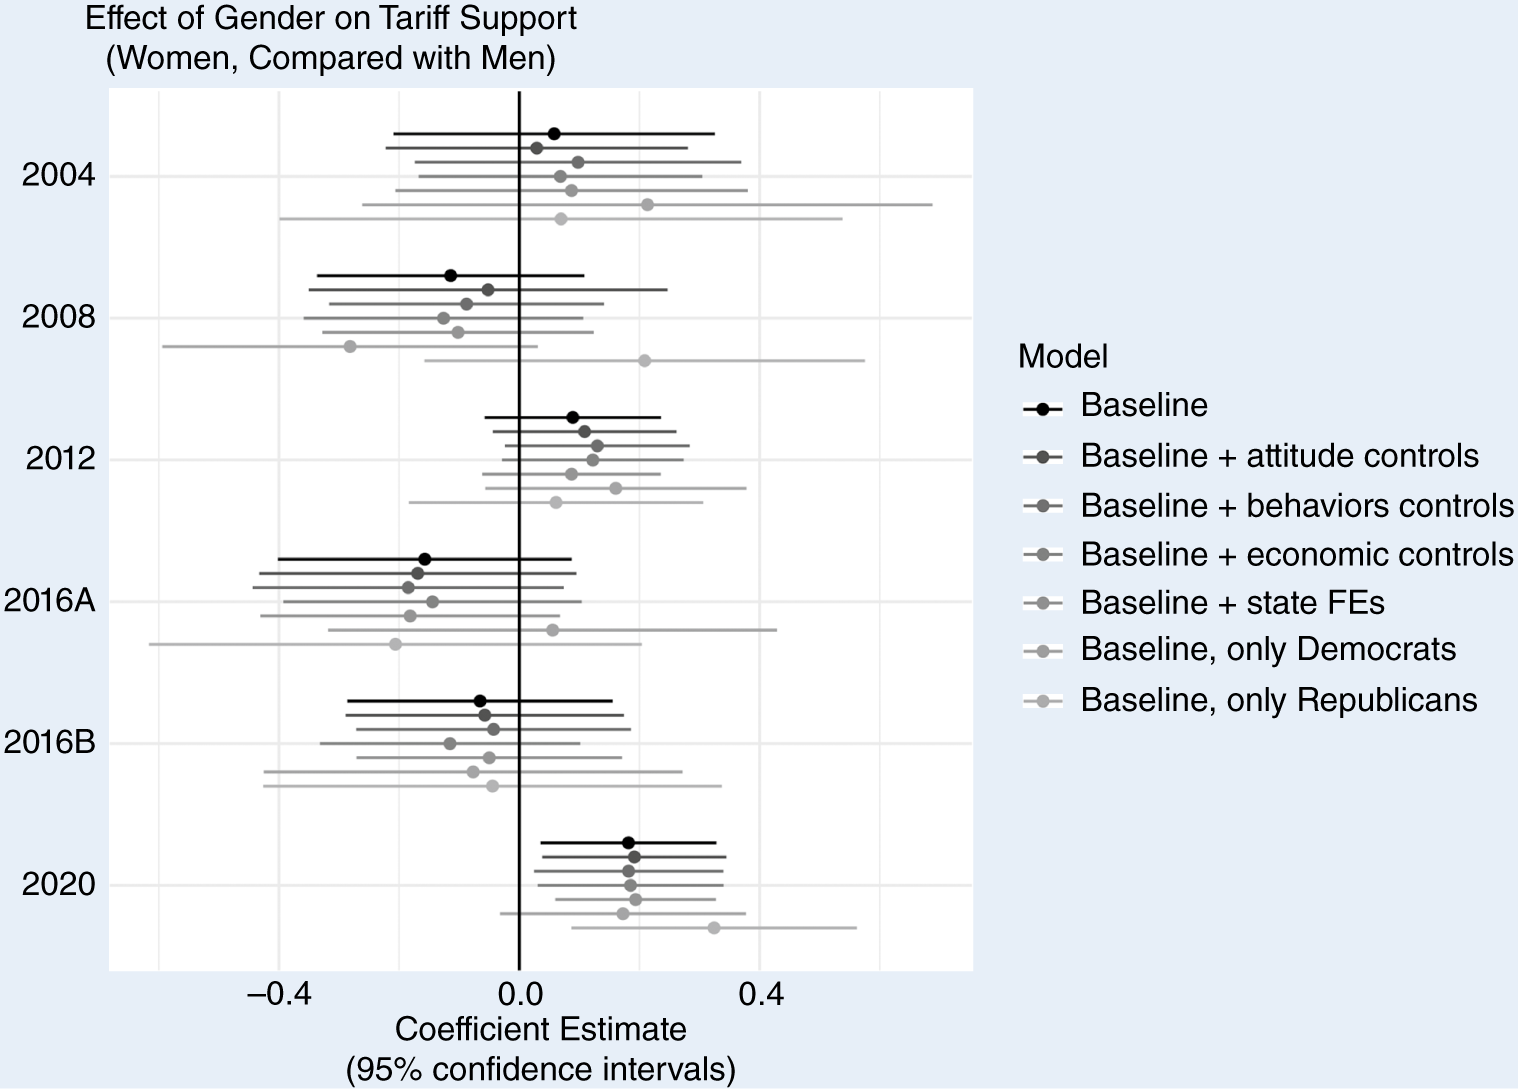
The partisanship and gender variables also are worthy of discussion. Regarding partisanship, the baseline model (see table 2) and the other models (figure 6) show that both Democrats and those who affiliate with neither party entered this period either slightly more in favor of tariffs than Republicans or with levels of support that were indistinguishable from Republicans. In 2016 and 2020, however, both Democrats and Neithers became notably less supportive of tariffs than Republicans. This is a sensible finding given the tenor of the 2016 presidential campaign. However, it also is notable that the effect of partisanship on trade policy varied over time, whereas gender conservatism remained stable. This strongly suggests that gender conservatism, as this study defines it, captures something quite different from conservatism in general. Moreover, we found little evidence in these data that women were consistently more protectionist (figure 7). This is due in part to how we coded our dependent variable. We would have reported more literature-consistent findings if we had modeled opposition to tariffs, thereby pooling survey respondents who reported no opinion with those who supported tariffs. However, it is worth noting that the coefficient on gender conservativism is not sensitive to these coding rules, which suggests that it is a particularly robust element of the relationship between American trade politics and gender.Footnote 17
Effect of Party on Tariff Support
Coefficient on “Democrat” and “Neither (party),” compared with Republican, for each wave and each set of controls. All models are logit with dichotomous trade support as the dependent variable. 2016B and 2020 are forced choice.

Figure 6 Long description
A multi-panel dot plot with horizontal error bars. The x-axis represents the Coefficient Estimate ranging from minus 0.5 to 1.5, with a vertical baseline at 0. The y-axis lists years 2004, 2008, 2012, 2016 A, 2016 B, and 2020.
Left Panel (Neither): Data points for all years and models cluster closely around the 0 baseline, indicating little to no significant effect on tariff support compared to Republicans.
Right Panel (Democrat):
- From 2004 to 2012, points cluster near 0.
- In 2016 A, 2016 B, and 2020, there is a distinct rightward shift. For 2020, all model estimates are positive, ranging between 0.5 and 1.3, with error bars entirely to the right of the 0 baseline.
Legend: Seven models are shown for each year, distinguished by grayscale shades from black to light gray:
- Baseline
- Baseline plus attitude controls
- Baseline plus behaviors controls
- Baseline plus economic controls
- Baseline plus state F Es
- Baseline plus Men only
- Baseline plus Women only
Horizontal lines through each dot represent 95 percent confidence intervals.
Effect of Gender on Tariff Support
Coefficient on “woman” (compared with men) for each wave and each set of controls. All models are logit with dichotomous trade support as the dependent variable. 2016B and 2020 are forced choice.

Figure 7 Long description
A coefficient plot with a vertical zero line. The x-axis represents the Coefficient Estimate with 95 percent confidence intervals, ranging from minus 0.4 to 0.4. The y-axis lists years: 2004, 2008, 2012, 2016 A, 2016 B, and 2020. For each year, seven models are plotted as dots with horizontal error bars, colored from black to light gray.
* The legend identifies the models: Baseline, Baseline plus attitude controls, Baseline plus behaviors controls, Baseline plus economic controls, Baseline plus state F E s, Baseline only Democrats, and Baseline only Republicans.
* In 2004, 2008, and 2016 A, most estimates are centered near or slightly to the left of the zero line, indicating a neutral or slightly negative coefficient for women compared to men.
* In 2012, 2016 B, and 2020, the estimates shift to the right of the zero line, indicating a positive coefficient.
* The 2020 data shows the most consistent positive shift across all models, with all dots and most error bars situated to the right of the zero line.
* The Baseline only Republicans model consistently shows the widest confidence intervals across all years.
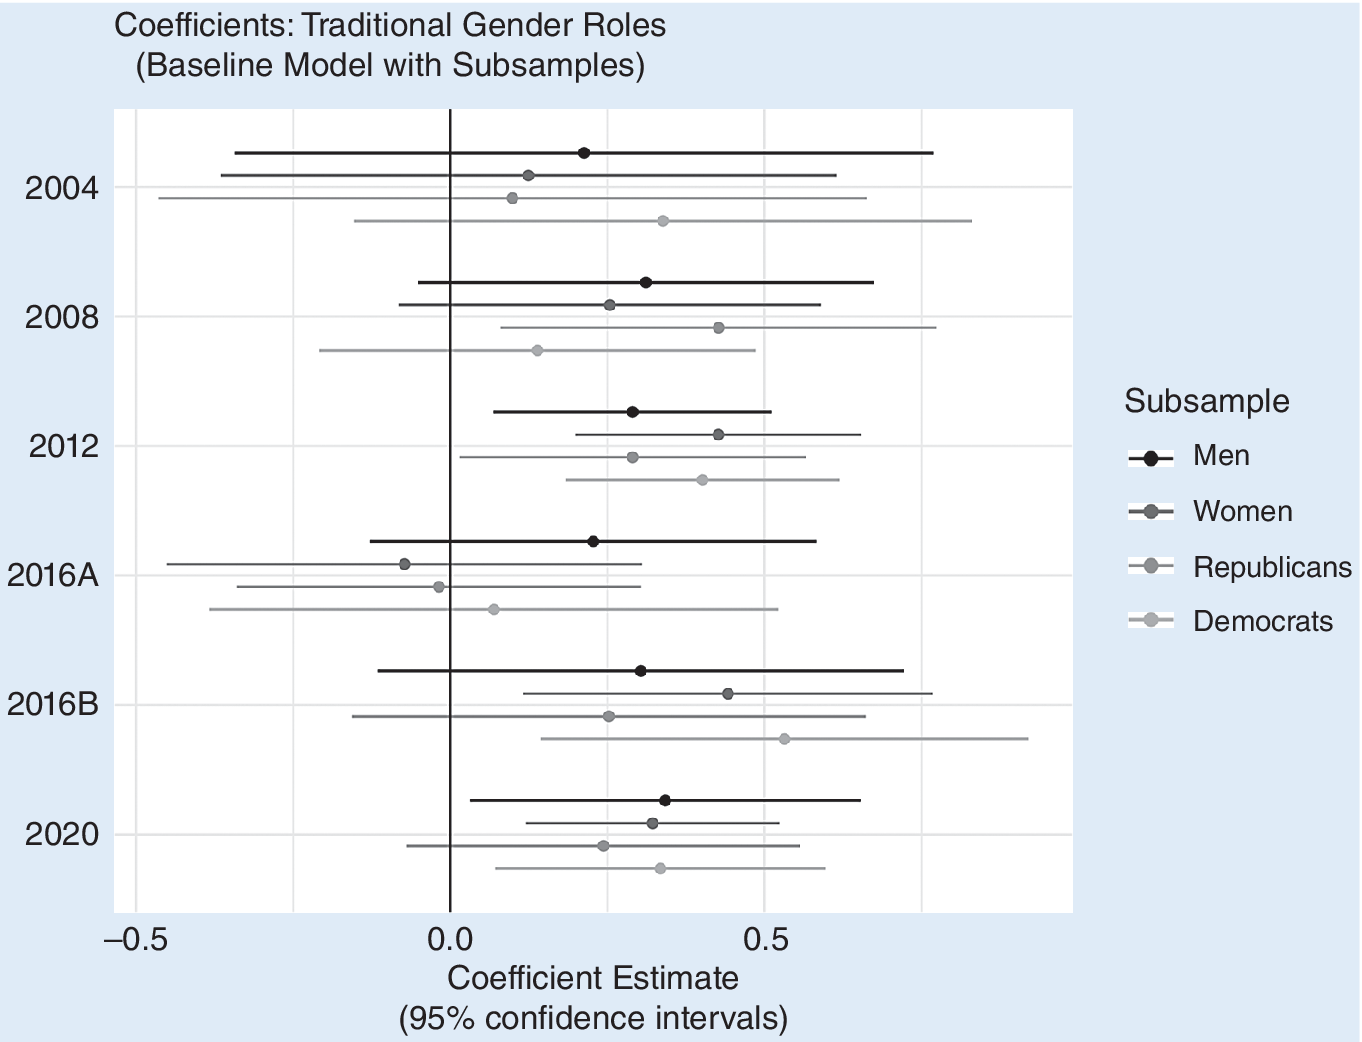
Our split-sample models were more mixed. Figure 8 shows the coefficients on support for traditional gender roles in subsamples of only men, only women, only Republicans, and only Democrats. The 2012 and 2020 data indicate that gender-conservative men were more trade skeptical than non-gender-conservative men. The data from 2012, 2016B, and 2020 suggest that women who preferred traditional gender roles, likewise, were more trade skeptical than women who did not prefer traditional gender roles. These results also were similar across the Democratic and Republican subsamples; however, the effect on Republicans was stronger and more significant than on Democrats in 2008 and smaller and statistically insignificant in the 2016 and 2020 samples. This finding is consistent with a compression effect, in which the strengthening relationship between being a Republican and being trade skeptical reduces the importance of other explanatory variables.
Coefficients: Traditional Gender Roles
Coefficient on gender-role traditionalism for four subsamples (i.e., men, women, Republicans, and Democrats) for each wave. All models are logit with dichotomous trade support as the dependent variable. 2016B and 2020 are forced choice.

Figure 8 Long description
The Y axis lists six time periods: 2004, 2008, 2012, 2016 A, 2016 B, and 2020. The X axis represents the Coefficient Estimate ranging from minus 0.5 to 0.5, with a vertical baseline at 0.0. Each year contains four horizontal error bars representing 95% confidence intervals with a central dot for the estimate.
* Subsample Legend: Men (black), Women (dark gray), Republicans (medium gray), and Democrats (light gray).
* 2004: Men are at approximately 0.25. Women and Republicans are slightly above 0.1. Democrats are near 0.35.
* 2008: Men are at 0.3. Women are at 0.25. Republicans are at 0.45. Democrats are at 0.15.
* 2012: Men are at 0.3. Women are at 0.45. Republicans are at 0.3. Democrats are at 0.4.
* 2016 A: This is the only period where estimates cross into negative territory. Men are at 0.25. Women are at minus 0.1. Republicans are at minus 0.05. Democrats are at 0.05.
* 2016 B: Men are at 0.3. Women are at 0.45. Republicans are at 0.25. Democrats are at 0.55.
* 2020: Men are at 0.35. Women are at 0.3. Republicans are at 0.25. Democrats are at 0.35.
Across almost all waves, the confidence intervals for Men are the widest, while the estimates for all groups generally remain to the right of the zero line, indicating a positive correlation.
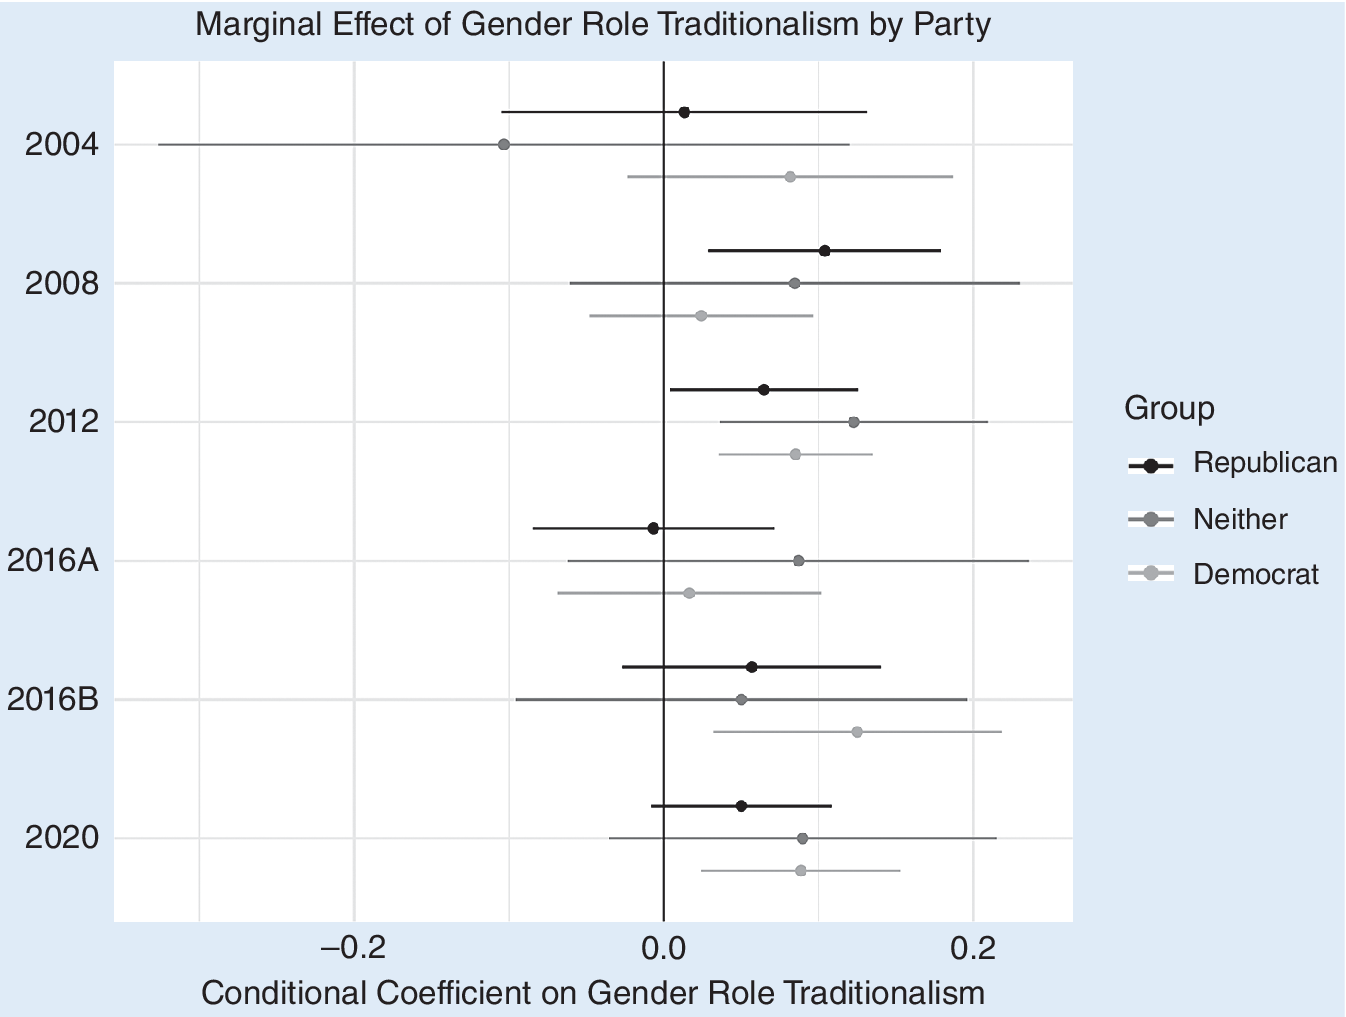
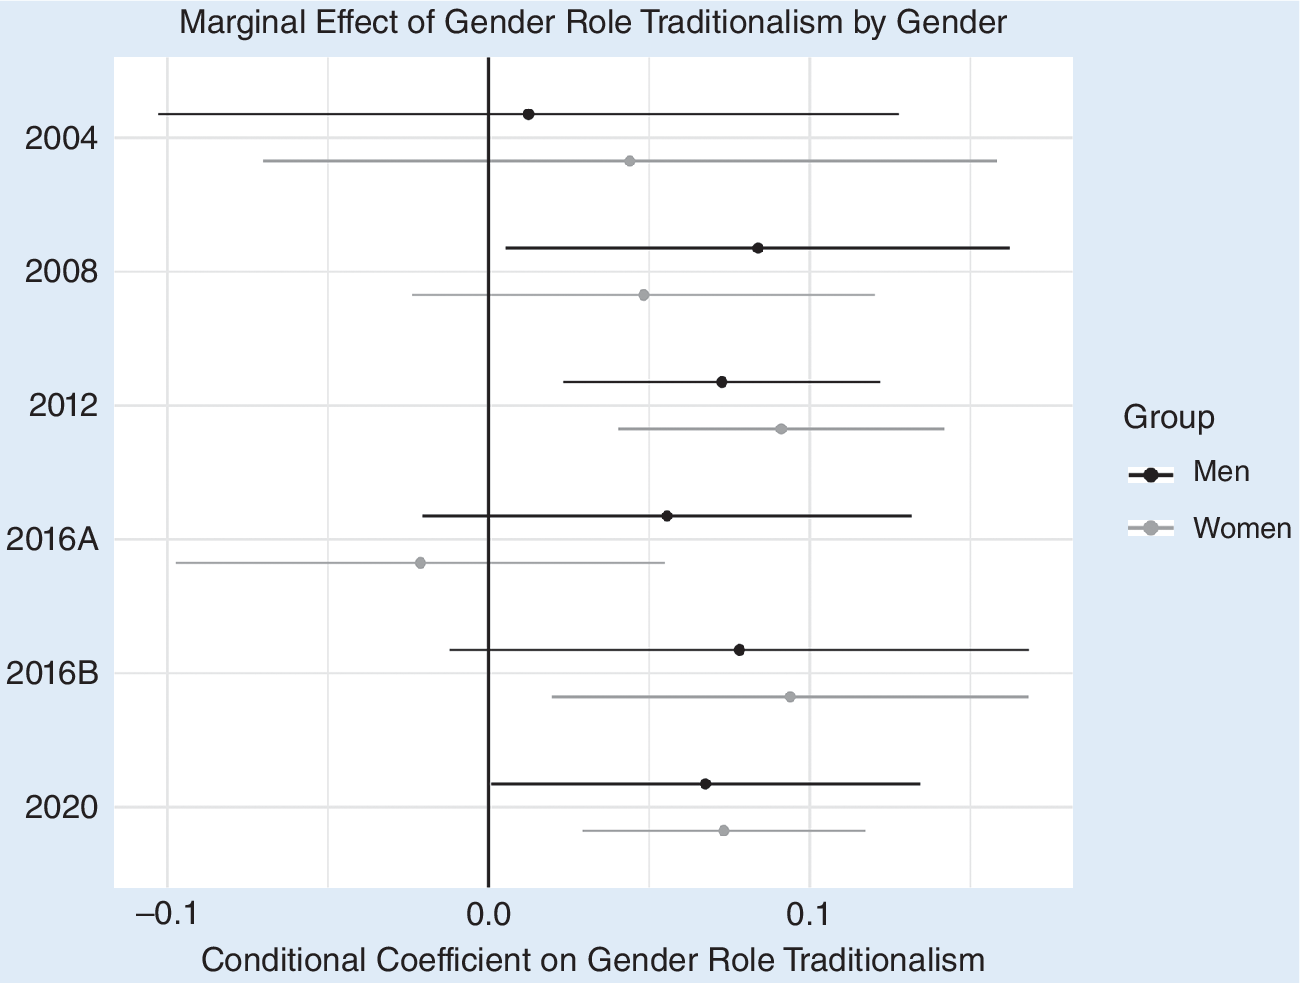
We complemented the split-sample models with models that interacted gender conservatism with political party and with gender (figures 9 and 10, respectively). These models make better use of the data but assume that all variables other than the interacted variable (i.e., gender-role traditionalism) had the same effect across different parts of the sample. Figure 9 presents the marginal effect of gender-role traditionalism by political party, and figure 10 presents it by gender. That is, we calculated the estimate, standard error, and statistical significance of the coefficient on gender-role traditionalism separately for Democrats, Republicans, and Neithers, and did the same for men and women (Arel-Bundock, Greifer, and Heiss Reference Arel-Bundock, Greifer and Heiss2024). These results indicate that gender conservatism was associated with trade skepticism among Republicans in 2008 and 2012 and among Democrats in 2012, 2016B, and 2020. As in prior findings, these results suggest a compression effect among Republicans because Trump made trade skepticism a core part of Republican politics from 2016 onward.
Marginal Effect of Gender-Role Traditionalism by Political Party
Marginal effect of gender-role traditionalism on trade support by political party for each wave. All models are logit with dichotomous trade support as the dependent variable. 2016B and 2020 are forced choice.

Figure 9 Long description
A coefficient plot with a vertical line at 0.0 representing no effect. The x-axis measures the Conditional Coefficient on Gender Role Traditionalism from -0.2 to 0.2. The y-axis lists election waves: 2004, 2008, 2012, 2016 A, 2016 B, and 2020. For each year, three horizontal error bars with central dots represent the marginal effect for Republicans (black), Neither (dark gray), and Democrats (light gray).
* 2004: Republican and Democrat effects are slightly positive; Neither is negative with a very wide confidence interval extending past -0.2.
* 2008: Republican effect is positive at approximately 0.1; Neither and Democrat effects are near 0.08 and 0.02 respectively.
* 2012: Republican effect is positive at 0.07; Neither is at 0.12; Democrat is at 0.09.
* 2016 A: Republican effect is slightly negative at -0.01; Neither is positive at 0.09; Democrat is at 0.02.
* 2016 B: Republican effect is positive at 0.06; Neither is at 0.05; Democrat is at 0.13.
* 2020: Republican effect is positive at 0.05; Neither is at 0.09; Democrat is at 0.09.
Most confidence intervals for Republicans and Democrats overlap with the zero line in earlier years but shift toward positive territory in later waves, particularly for Democrats in 2016 B and 2020.
Marginal Effect of Gender-Role Traditionalism by Gender
Marginal effect of gender-role traditionalism on trade support by political party for each wave. All models are logit with dichotomous trade support as the dependent variable. 2016B and 2020 are forced choice.

Figure 10 Long description
The y-axis lists six time periods: 2004, 2008, 2012, 2016 A, 2016 B, and 2020. The x-axis represents the Conditional Coefficient on Gender Role Traditionalism, ranging from minus 0.1 to 0.1. A vertical reference line is set at 0.0. A legend on the right identifies black dots and lines for Men and grey dots and lines for Women.
* 2004: Men's coefficient is approximately 0.01 with a wide interval crossing 0. Women's coefficient is approximately 0.04 with a wide interval crossing 0.
* 2008: Men's coefficient is approximately 0.075. Women's coefficient is approximately 0.045. Both intervals cross 0.
* 2012: Men's coefficient is approximately 0.06. Women's coefficient is approximately 0.09. Both intervals are entirely to the right of 0.
* 2016 A: Men's coefficient is approximately 0.05. Women's coefficient is negative at approximately minus 0.03. Both intervals cross 0.
* 2016 B: Men's coefficient is approximately 0.075. Women's coefficient is approximately 0.09. Both intervals are entirely to the right of 0.
* 2020: Men's coefficient is approximately 0.065. Women's coefficient is approximately 0.07. Both intervals are entirely to the right of 0.
These models suggest that the conditional associations between gender conservatism and trade skepticism were similar among men and women, except in 2008, when there was a statistically significant association among men but not among women—for whom there was a positive but not statistically significant conditional correlation.
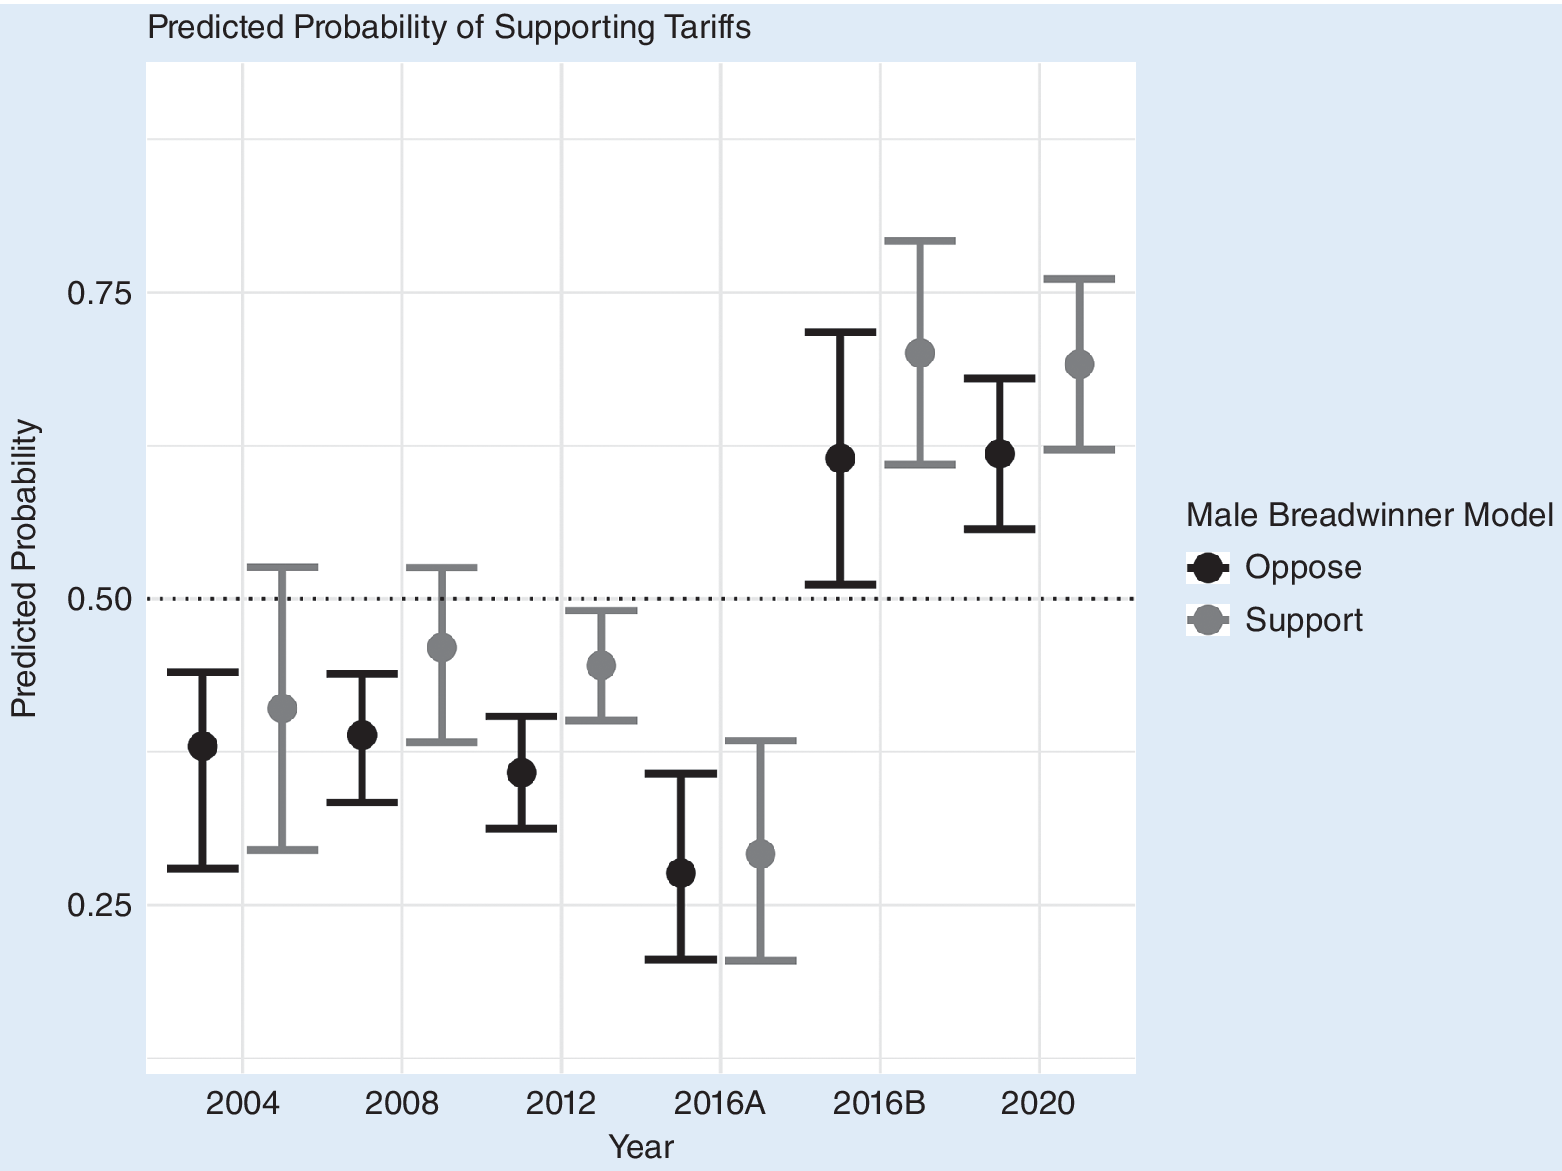
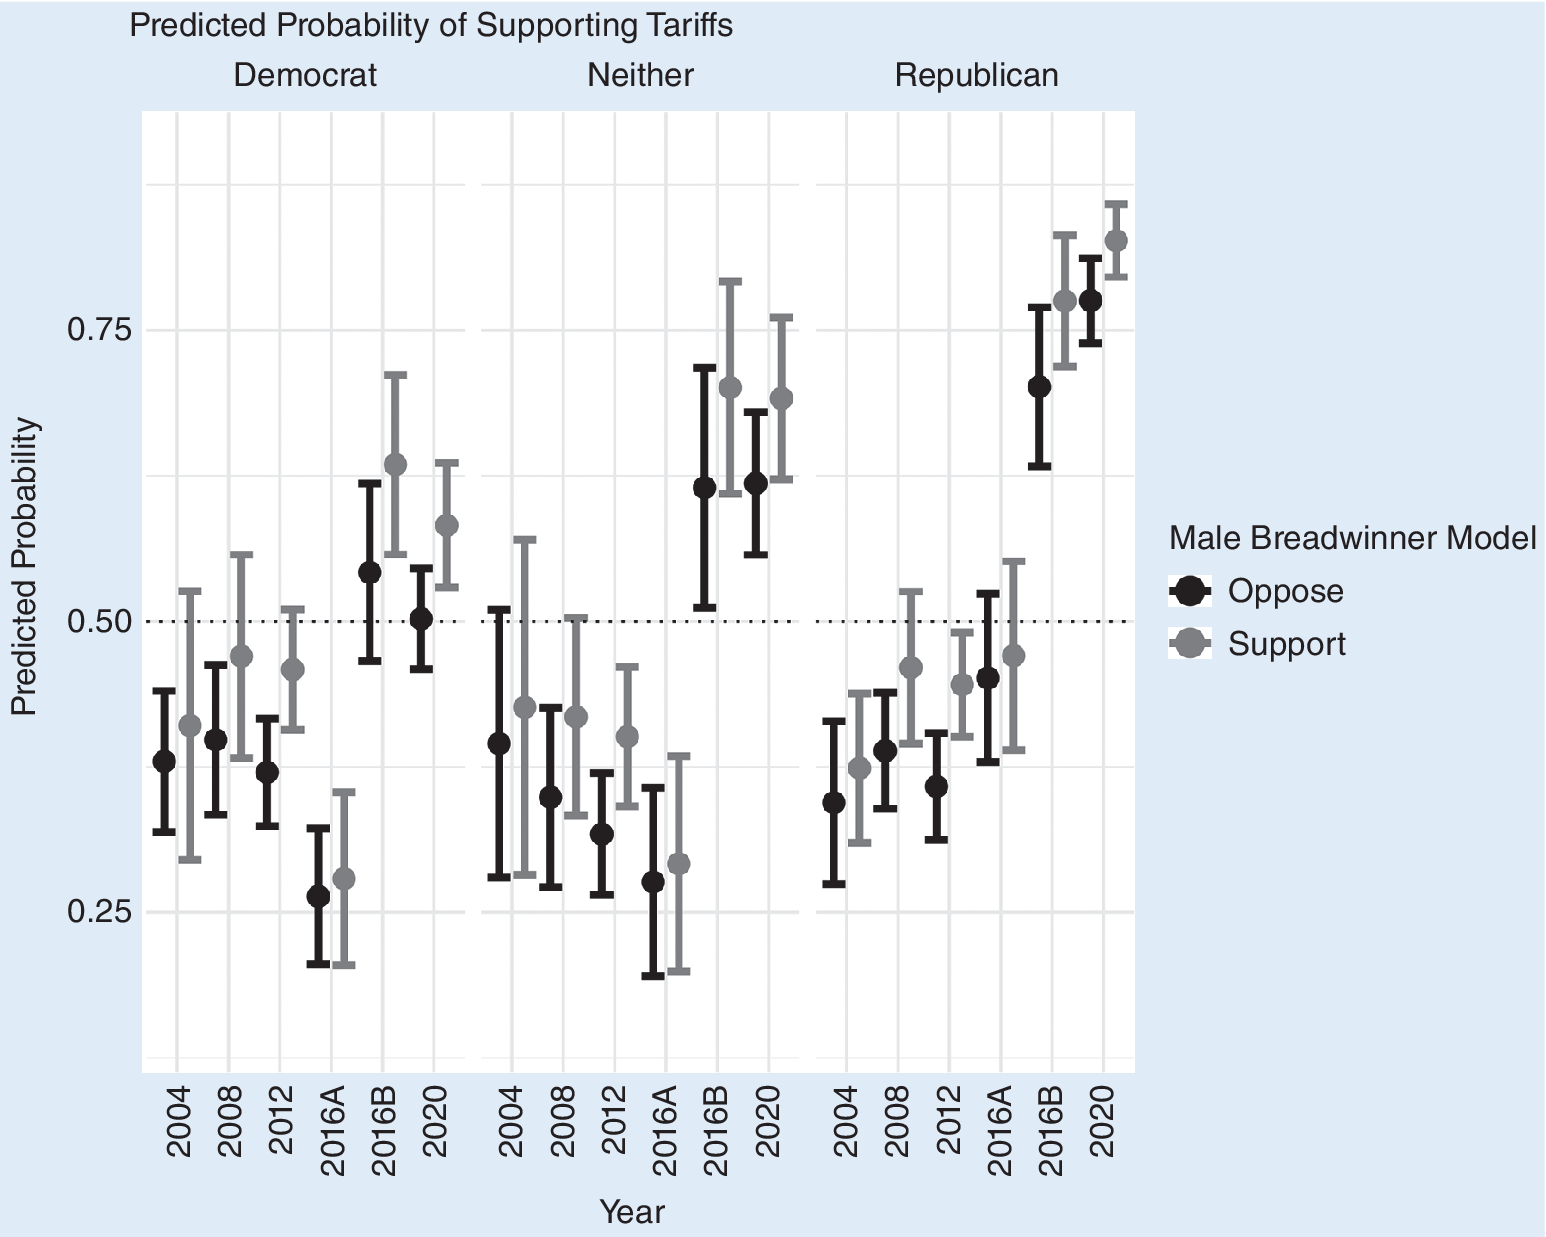
Figures 11 and 12 illustrate these findings by presenting the predicted probability of supporting tariffs based on a person’s gender-role traditionalism.Footnote 18 We based these predicted probabilities on our baseline model (see table 2). Figure 11 shows predicted probabilities for the full sample and figure 12 separates our findings by partisanship. In both figures, all other variables are held constant at their medians or modes.Footnote 19 Except in 2004 and 2016A, the predicted probability of trade skepticism was consistently higher among gender-role traditionalists.Footnote 20
Predicted Probability of Supporting Tariffs
Predicted probabilities of supporting tariffs. Results based on baseline model. 95% confidence intervals.

Figure 11 Long description
The Y-axis represents Predicted Probability ranging from 0.25 to 0.75, with a horizontal dotted reference line at 0.50. The X-axis lists the years 2004, 2008, 2012, 2016 A, 2016 B, and 2020. Data is split into two groups: Oppose (black circles) and Support (gray circles) for the Male Breadwinner Model, each with 95 percent confidence interval bars.
* In 2004, 2008, and 2012, both groups are below the 0.50 threshold, with probabilities ranging between 0.35 and 0.45.
* In 2016 A, both groups drop to their lowest points, approximately 0.28 to 0.30.
* In 2016 B, there is a sharp increase. The Oppose group rises to approximately 0.62, while the Support group rises higher to approximately 0.70.
* In 2020, probabilities remain high, with the Oppose group at approximately 0.62 and the Support group at approximately 0.68.
Across all years except 2016 A, those who support the Male Breadwinner Model have a slightly higher predicted probability of supporting tariffs than those who oppose it.
Predicted Probability of Supporting Tariffs by Political Party Preference
Predicted probabilities of supporting tariffs, broken down by political party preference. Results based on model baseline model. 95% confidence intervals.

Figure 12 Long description
A three-panel dot plot with 95 percent confidence intervals. The y-axis represents Predicted Probability from 0.00 to 0.75 and above. The x-axis lists years 2004, 2008, 2012, 2016 A, 2016 B, and 2020. A horizontal dotted line marks the 0.50 probability threshold.
Left panel (Democrat): Probabilities for both those who oppose and support the Male Breadwinner Model remain mostly below 0.50, with a slight peak in 2016 B before declining in 2020.
Middle panel (Neither): Probabilities fluctuate below 0.50 until 2016 B, where both groups jump above 0.60, followed by a slight decrease in 2020.
Right panel (Republican): Shows a distinct upward trend. From 2004 to 2016 A, probabilities for both groups are below 0.50. In 2016 B, there is a sharp increase to approximately 0.75. By 2020, the probability for those who oppose the model reaches nearly 0.80, while those who support it exceed 0.85.
Legend: Black dots represent ‘Oppose’ and grey dots represent ‘Support’ for the Male Breadwinner Model.
Predicted probabilities disaggregated by partisanship mirror the anecdotal evidence: similar levels of support for tariffs across political parties in the early ANES waves and Republicans becoming more enthusiastic about tariffs in subsequent waves.Footnote 21 These predicted probabilities echoed our interaction-model findings. Gender-role traditionalism impacted Republicans more in the earlier than in the later waves. This was not true among Democrats. For 2008 and 2012, we cannot rule out that the probability of supporting tariffs among gender-conservative Democrats exceeded 0.5, whereas it was clearly less than 0.5 for non-gender-conservative Democrats. Likewise, the confidence interval for the gender-liberal group overlapped with 0.5 in 2016B and 2020, which suggests that whereas gender conservatives were likely to support tariffs in those years, gender liberals were more likely to oppose them. This reinforces our regression findings of a clear association between gender-role traditionalism and support for tariffs, and it further indicates that this difference may be consequential for Democrats.
CONCLUSION
American political debates about free trade and tariffs often highlight their impact on the blue-collar manufacturing jobs that once underpinned the professional stability of Americans without a college degree. Job losses in those industries have been severe, as have the social pathologies that followed. Deindustrialization has been deeply unpopular, and discontent about it fuels recent American resistance to free trade. This article argues that academic writing on the topic underexplores the extent to which these jobs are gendered in the popular imagination and viewed as critical to a popular but fading gender norm in which a single male salary can support a family with a caregiving wife at home. Conservative articulations of trade skepticism increasingly follow this line, contextualizing trade policy as a social and gender policy as much as it is an economic policy.
Our study asked whether this conservative rhetoric reflects associations in American public opinion. Do Americans who prefer “traditional” gender roles understand free trade as a threat and tariffs as a potential solution? If so, which Americans, and how long have they made that association? We answered these questions by using multiple waves of the ANES. We found considerable evidence that support for traditional gendered economic roles is associated with protectionism and that this has been true at least since 2008.
This study also presents an alternative narrative about what it means for trade politics—or any politics—to be gendered. The existing literature distinguishes between men’s and women’s trade preferences; however, the causal mechanisms linking gender to trade preferences are not intrinsic to gender per se but instead to experiences or perspectives that people of a specific gender tend to have. Despite the focus on gender differences, the theories are not about gender in the strict sense. Gender shapes people’s experiences—in the labor market, in higher education, and in other contexts—and interests, and these in turn shape trade-policy preferences. Women are not more protectionist because they are women but instead because their life trajectories are more likely to give them a material interest in protectionism. Gender, as Guisinger (Reference Guisinger2016) summarized, “remains at best a catchall measure for sources of vulnerability.” Our approach is different. We argue and show that American trade politics is literally about gender and the preferences that Americans have regarding gender roles. Gender is not only a “catchall measure” for a set of related experiences and interests; it is also directly at the core of American trade politics. Considering gender as a driver of American trade politics in this way thus creates a more direct tie between gender and trade than what is revealed in the existing literature.
Refining our understanding of American trade politics in this way invites further research, not least of which on causal identification to validate our observational findings. Future research also might test this theory from a comparative perspective. Whereas our findings speak to specifically American dynamics, other countries have addressed trade-related reductions in manufacturing employment: Aghelmaleki, Bachmann, and Stiebale (Reference Aghelmaleki, Bachmann and Stiebale2022); Barth et al. (Reference Barth, Finseraas, Kjelsrud and Moene2023); and Dauth, Findeisen, and Suedekum (Reference Dauth, Findeisen and Suedekum2017) on Europe, and Artuç, Lederman, and Rojas (Reference Artuç, Lederman and Rojas2015) on Latin America. Each setting suggests a different context in which to understand the interplay between manufacturing employment and gender politics. For example, the developed welfare states of Northern Europe might attenuate the link between employment stability and family life, lessening the connection between gender politics and trade policy—or perhaps not—and the American experience hints at generalizable relationships.
SUPPLEMENTARY MATERIAL
To view supplementary material for this article, please visit http://doi.org/10.1017/S1049096526102224.
ACKNOWLEDGMENTS
The authors acknowledge feedback from participants at the International Political Economy Society, the American Political Science Association, and the American Politics Colloquium at the University of Minnesota.
DATA AVAILABILITY STATEMENT
Research documentation and data that support the findings of this study are openly available at the PS: Political Science & Politics Harvard Dataverse at https://doi.org/10.7910/DVN/LZ52YA



 Open access

