I. Introduction
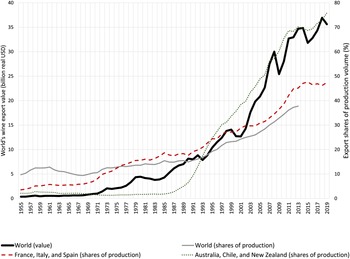
The great boom in wine trade over the past six decades can be decomposed into two three-decade periods (Figure 1). The first period started in the 1960s, when traditional European wine-producing countries dramatically increased their wine exports, something that was influenced by a decrease in their domestic demand. The second period began in the 1990s, when several wine-producing countries in the southern hemisphere increased their exports at an accelerated rate in an explicit drive for export-led growth (Figure 1), raising the New World's share of global wine exports from less than 3% prior to 1990 to one-quarter in the 2010s.
World's wine export values and export shares of production volume, 1995 to 2019.
Notes: Authors’ computation is based on data from Anderson and Pinilla (Reference Ayuda, Ferrer-Pérez and Pinilla2021, 2022). Exports values are deflated by U.S. CPI where 2015 = 1.00. The export shares of production volume are averages of the previous five years. For both three-country groups, the export shares of production volume are simple averages between the three countries of each group.

This study aims to explain, econometrically, the impact of key variables affecting wine trade since the 1960s. We divide the second wave of globalization into two periods (1962–1990 and 1991–2019), which allows us to test how the influence of these key variables affecting wine trade has changed due to the impact of globalization. Our study is, to our knowledge, the first of its kind covering the second wave of globalization as a whole, complementing previous research that has focused on the first wave of globalization (Ayuda, Ferrer-Pérez, and Pinilla, Reference Ayuda, Ferrer-Pérez and Pinilla2020). Previous studies focusing on world wine trade use datasets that begin in the 1990s (Santeramo et al., Reference Santeramo, Lamonaca, Nardone and Seccia2019; Dal Bianco et al., Reference Dal Bianco, Boatto, Caracciolo and Santeramo2016) or early 2000s (Balogh and Jámbor, Reference Balogh and Jámbor2018). We limit the time series to 2019 to avoid the next two years when wine trade was disrupted by COVID-19, Brexit, and China imposing punitive tariffs on Australian wine imports (Wittwer and Anderson, Reference Wittwer and Anderson2020, Reference Wittwer and Anderson2021).
Furthermore, we analyze the influence on wine trade of similarities across countries in the mix of their vineyards’ winegrape varieties, something that has not previously been analyzed. We do so to test two contrary hypotheses from empirical trade research. One draws on the home-country bias phenomenon: because consumers enjoy most the varieties they are familiar with from domestic production (Friberg, Paterson, and Richardson, Reference Friberg, Paterson and Richardson2011), they also seek them from among those that can be imported; the opposite hypothesis draws on the consumers’ love of diversity phenomenon: their choice of imports complements what is available locally (Krugman, Reference Krugman1980; Broda and Weinstein, Reference Broda and Weinstein2004), and so its varietal mix is dissimilar to the mix of domestically produced winegrapes.
II. Gravity models
The gravity model constitutes the theoretical and empirical framework of our analysis (see Head and Mayer (Reference Head, Mayer, Gopinath, Helpman and Rogoff2014) and Yotov et al. (Reference Yotov, Piermartini, Monteiro and Larch2017) for reviews). We estimate two sets of models. The first set allows us to compare the influence of key variables on wine trade between the first and second half of the second wave of globalization. The second set of models allows us to test the influence of similarities in the mix of winegrape varieties on wine trade.
The first set of models is given by:

The dependent variable, X ij,t, is the trade flow from country i to country j, in year t (FOB USD); ρ i,t (v j,t) are exporter-time (importer-time) fixed effects that account for time-varying country-specific characteristics such as macroeconomic variables, exchange rates, and wine production. Importantly, these fixed effects also account for multilateral resistances (Olivero and Yotov, Reference Olivero and Yotov2012). The natural logarithm of the physical distance between country i and country j is lnD ij. The dichotomous variables RTA ij,t, CL ij, CC ij, and CB ij, take the value of one if countries i and j have at least one regional trade agreement (RTA), common official or primary language, common colonizer post-1945, and common borders, respectively. The β s are parameters to be estimated, and $\epsilon _{ij, t}$ is an error term. We estimate Equation (1) separately for the 1962–1990 period and the 1991–2019 period.
The second set of models is given by:

The difference between Equations (1) and (2) is that Equation (2) incorporates a new variable, the Varietal Similarity Index (VSI), between countries i and j in year t (VSI ij,t). The VSI between two countries takes values between 0 and 1, where 0 means that the mix of grape varieties (in terms of bearing area of these varieties) is totally different and 1 means that the mix of grape varieties is exactly the same for both countries. Anderson (Reference Anderson2010) introduces this index and its formula. We estimate this second set of models for all countries, but also for those that have a wine self-sufficiency index higher than 33%, 50%, and 100% (to reduce the sample to countries that are themselves significant wine producers). We use data for the three years in which we have VSI data: 2000, 2010, and 2016.
We estimate the two sets of models using the Poisson pseudo maximum likelihood (PPML) estimator, which works well in the presence of heteroskedasticity and a large proportion of zero trade flows (Santos Silva and Tenreyro, Reference Santos Silva and Tenreyro2006, Reference Santos Silva and Tenreyro2011). Trefler (Reference Trefler2004) argues that using data for all years does not allow for adjustments to changes in trade policy. Therefore, Olivero and Yotov (Reference Olivero and Yotov2012) propose using three- to five-year interval data. As a robustness check, we estimate the models given by Equation (1) using three-year interval data.
III. Data
We use export data from Harvard's Atlas of Economic Complexity, available at www.atlas.cid.harvard.edu/. We use VSI data from Anderson and Nelgen (Reference Anderson and Nelgen2020) and wine self-sufficiency data from Anderson and Pinilla (Reference Anderson and Pinilla2022). The source of the distance in km between the most populous cities of each country, common official or primary language, common colonizer post-1945, and common borders is the CEPII gravity database, available at www.cepii.fr/cepii/en/bdd_modele/bdd.asp.
IV. Results and discussion
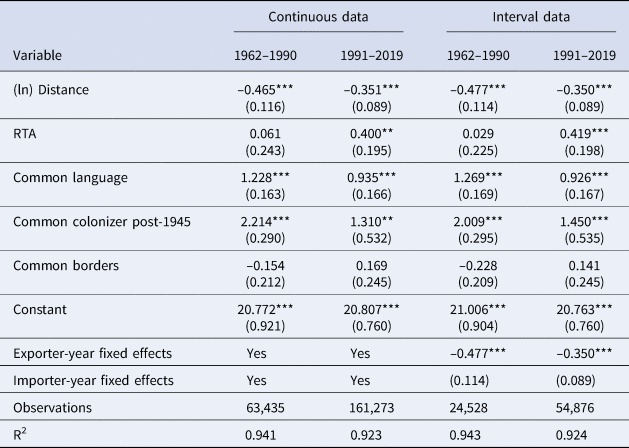
The first set of models reveals differences between the 1962–1990 period and the 1991–2019 period (see first two columns of Table 1). These results are consistent whether we estimate Equation (1) using yearly data or using three-year interval data, which we use as a robustness check (see last two columns of Table 1). The impacts of distance, common language, and common colonizer post-1945 are smaller for the latter period. This is consistent with trade theory and the findings of previous studies (e.g., Borchert and Yotov, Reference Borchert and Yotov2017), and it relates to the decline in trade costs over time (Anderson and van Wincoop, Reference Anderson and van Wincoop2004). RTAs, on the other hand, have a greater influence in the latter period, consistent with the dramatic growth in the number of such agreements since the early 1990s (currently more than 350, see https://www.wto.org/english/tratop_e/region_e/region_e.htm).
Estimation results of the gravity models given by Equation (1) for 1962–1990 and 1991–2019, with continuous data (preferred) and three-year interval data

Notes: * p < 0.10, ** p < 0.05, *** p < 0.01. Standard errors in parentheses. The dependent variable is the natural logarithm of wine trade between two countries (FOB USD). RTA denotes the presence of a regional trade agreement. The preferred model uses continuous data, while the model with three-year interval data serves as a robustness check.
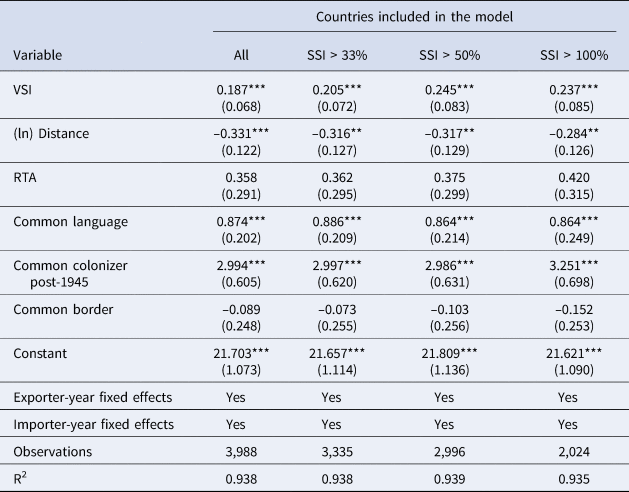
The second set of models suggests that the VSI has a statistically significant positive effect on wine trade flows (see Table 2). This result is consistent whether the model is estimated for all countries or for those who have a wine self-sufficiency index higher than 33%, 50%, or 100%. This suggests that those countries with a similar mix of grape varieties tend to trade more wine with each other, which is consistent with the home-country bias hypothesis and not with the hypothesis that consumers’ choice of imports complements the varietal mix available from local producers. However, our models do not allow us to imply a causal relationship as there may be potential endogeneity issues due to reverse causality. For example, the specifics of the international demand for wine may influence decisions in exporting countries as to which varieties to plant.
Estimation results of the gravity models given by Equation (2) for all countries, as well as for countries with a wine self-sufficiency index higher than 33%, 50%, and 100%

Notes: * p < 0.10, ** p < 0.05, *** p < 0.01. Standard errors in parentheses. The dependent variable is the natural logarithm of wine trade between two countries (FOB USD). VSI denotes the varietal similarity index and RTA denotes the presence of a regional trade agreement. SSI stands for the wine self-sufficiency index. For example, a SSI > 50% means that the only countries included in the analysis are those that produce at least half of the wine quantity they consume. Estimated with data for 2000, 2010, and 2016.
Unfortunately, comprehensive time-series data on national expenditure on the various varieties of domestically produced wine are not available for most countries. If they were, more-robust models would be able to be estimated because those data would help solve the missing globalization puzzle (Borchert and Yotov, Reference Borchert and Yotov2017) and better identify the impact of trade variables (Heid, Larch, and Yotov, Reference Heid, Larch and Yotov2021). Further, such models could use country-pair fixed effects to account for any resistance (preference) toward imported (domestically produced) wine.
V. Conclusion
We have used a gravity approach to estimate the impact of important variables influencing wine trade for two time periods: 1962–1990 and 1991–2019. The results suggest that the impact of distance, common language, and common colonizer post-1945 on wine trade has decreased in the latter period. These results are consistent with previous studies focused on other industries and with the expected impact of globalization. We have also used a gravity approach to estimate the impact of similarities in the mix of winegrape varieties on wine trade flows. The results suggest that countries that have a more similar mix of winegrape varieties tend to trade more wine with each other. However, potential endogeneity issues do not allow us to imply a causal relationship. We argue that a database with intra-national trade flows would allow wine economists to estimate more robust gravity models that could yield important insights.
Acknowledgments
The authors are grateful to the editor, Karl Storchmann, and to one anonymous reviewer for helpful comments. The authors are grateful for financial support from Wine Australia and the University of Adelaide's School of Economics and Public Policy and School of Agriculture, Food and Wine under Research Project UA1803-3-1. German Puga also acknowledges the support he received for his Ph.D. studies at the University of Adelaide from an Australian Government Research Training Program Scholarship and a Wine Australia Top-Up Scholarship.