


Introduction
The gas occluded in bubbles of old ice samples consists of air trapped during the process of ice formation. This led to attempts to reconstruct the history of the composition of the atmosphere by analysing the gas in ice samples of known age. Of special interest is the CO2 content of the ancient atmosphere. Due to intensive land use and combustion of fossil fuel in the last century, the CO2 content of the atmosphere has increased by about 20% to a present value of about 338 ppm (C D Keeling personal communication). The industrial CO2 contribution is somewhat uncertain and natural variations in the amount of atmospheric CO2 are unknown. Earlier measurements on ice samples (Reference Berner, Oeschger and StaufferBerner and others 1980, Reference Delmas, Ascencio and LegrandDelmas and others 1980) suggest that toward the end of the last glaciation the CO2 content of the atmosphere was significantly smaller than in the postglacial period. We report new measurements with improved techniques on ice samples from ice cores from Antarctica and Greenland. Our aim is to obtain more exact values for CO2 concentrations in different epochs.
More definite evidence regarding the suggested CO2 increase toward the end of the last glaciation and more precise knowledge of the pre-industrial atmospheric CO2 content are not only of scientific interest but are also important to future energy policies.
Ice Samples
In snow-covered areas, where the surface temperature never reaches the melting point of ice, ice is formed by sintering of dry snow. The sintering process leads to a densification of snow and firn and a decrease of the pore volume. The pore volume consists of channels which have multiple connections with each other. When the pore volume shrinks to about 10% of the total firn volume, the channels are pinched off and isolated bubbles are formed. If the air in the open pore space of firn is of atmospheric composition, we expect the air in newly formed bubbles to be of atmospheric composition also. Since gas diffusion through ice is very small, the composition of air occluded in these isolated bubbles essentially remains preserved. These considerations are only correct if no water is involved.
Ice samples from very cold areas, therefore, seem best suited for the study of ancient atmospheric composition.
We used, for our measurements, ice-core samples from Camp Century, Greenland (77°10´N, 61°8´W), Byrd station, Antarctica (80°01´S, 119°31´W), and North Central Greenland (74°37´N, 39°36´W). The mean annual air temperature in Camp Century is -24°C, but small ice layers are formed in warm summers, so that the influence of melt water on the CO2 content cannot be ruled out. The core drilling, supervised by B L Hansen, reached bedrock at a depth of 1 387 m in 1966. The mean annual air temperature at Byrd station is -28.4°C, and the ice thickness is 2 164 m. The core drilling reached bedrock in 1968 (Reference Ueda and GarfieldUeda and Garfield 1969). Through the courtesy of Dr C C Langway, we obtained good quality samples of about 1 kg in weight from both cores for our measurements. We made measurements on 22 samples from the Camp Century core and 21 samples from the Byrd core, distributed over the entire depth. In North Central, Greenland, the core drilling was done with a drill constructed in Denmark as part of the Greenland Ice Sheet Program (Reference Johnsen, Dansgaard, Gundestrup, Hansen, Nielsen and ReehJohnsen and others 1980). The mean annual air temperature is -31.7°C. The firn-ice transition is at a depth of 60 to 80 m. We made measurements on a sample from 103 m depth.
There are several ways in which CO2 or, more generally, carbon can get into ice formed by sintering of dry snow. Some carbon, initially not located in the air bubbles, may later exchange and produce a small enrichment or depletion of CO2 in the air bubbles.
Estimated Amount of Carbon in Ice

Sources of Carbon in Ice
We now discuss estimates of the amount of carbon from different sources. The estimated values are presented in Table I.
The amount of CO2 dissolved in snow probably depends on meteorological conditions during snow-fall. We measured, in cold dendritic snow, a CO2 content corresponding to 150 μg carbon kg−1 ice immediately after snow-fall and 35 μg carbon kg−1 ice after one day of storage. These values include CO2 from carbonates. On the basis of measurements of the inorganic carbon in firn samples from North Central, Greenland and from South Pole station (5 μg carbon kg−1 ice (Schwander unpublished)) and subtracting the estimated contribution by carbonate, the CO2 dissolved in old snow and firn is estimated to lie in the range of 0 to 5 μg carbon kg−1 ice. The upper limit of this estimate is an order of magnitude lower than values published earlier (Reference Stauffer and BernerStauffer and Berner 1978). The early values were probably too high because of contamination (Reference Delmas, Ascencio and LegrandDelmas and others 1980).
The amount of CO2 adsorbed onto the surface of the firn grains has been estimated by Reference Klinger and OcampoKlinger and Ocampo (1979). A free surface of 5 m2 kg−1 corresponds to isolated firn grains with diameters of ~ 1 mm. The free surface of the firn at the firn-ice transition is approximately 1 m2 kg−1. The amount of CO2 adsorbed on this surface corresponds to 0.1 μg carbon kg−1 ice.
Approximately 30 mm3 kg−1 ice (at s.t.p.) of CO2 is occluded in the air bubbles, corresponding to ~16 μg carbon kg−1 ice for an atmospheric CO2 concentration of 300 ppm. This is the most important source of carbon in ice from very cold areas.
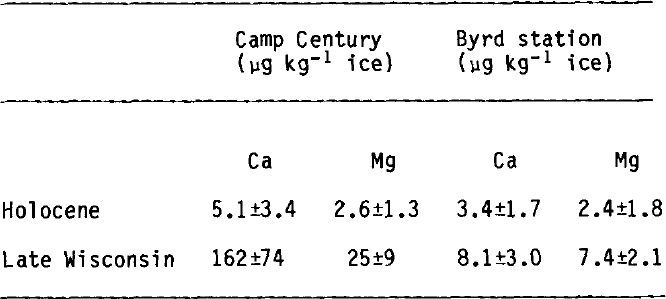
The deposition of carbonaceous dust depends on the geographical location and the patterns of atmospheric circulation. Elemental concentrations for calcium and magnesium, measured by Reference Cragin, Herron, Langway, Klouda and MaxwellCragin and others (1977), are given in Table II. The estimate in Table I for Byrd Holocene ice is made with the assumption that Ca and Mg are in the form of carbonates. The glacial-period values for Byrd and Camp Century cores are higher by a factor of ~2 and ~30, respectively.
AVERAGE CONCENTRATIONS OF THE ELEMENTS Ca AND Mg (Reference Cragin, Herron, Langway, Klouda and MaxwellCRAGIN AND OTHERS 1977)
Reference Fredskild and WagnerFredskild and Wagner (1974) investigated pollen and tissue fragments in ice samples from Camp Century. Our estimate assumes that each pollen grain contributes an average of 10 ng carbon and that the tissues give the same amounts as all pollen grains. For Byrd station, no such measurements exist; however, the organic carbon content is expected to be smaller than that for Camp Century. The amounts of organic carbon and adsorbed CO2 are, therefore, negligible. The CO2 content in air bubbles can be considerably affected only by CO2 dissolved in ice and by carbonates. Exchange between CO2 in bubbles and CO2 dissolved in ice occurs in Byrd core at depths below 800 m because the bubbles diffuse into the ice structure (Reference GowGow 1968). The possibility of exchanges between the different forms of inorganic carbon is discussed later, together with our results.
Experimental Methods
The extraction method determines whether the total inorganic carbon or only one form of carbon will be extracted. Vacuum melting under acidic conditions permits the extraction of all carbonates as CO2. Extraction methods which open air bubbles mechanically can extract the CO2 only in air bubbles. We used both a vacuum-melting method and a mechanical dry-extraction method. The methods will be discussed in detail by Reference Stauffer, Berner, Oeschger and SchwanderStauffer and others (in press) and Reference ZumbrunnZumbrunn (unpublished). We give here only a short description of the two methods.
In the melting method, roughly 300 g of ice is melted in an evacuated container. Gases released during melting are continuously pumped off and collected. After melting, which lasts about 30 min, the gases are extracted over continuously stirred water for an additional 6.5 h. If the pH value of the melt water is >7, phosphoric acid is added under vacuum until the pH value is 4. This guarantees a complete extraction of CO2 and carbon in carbonates, as calculated and verified by different tests. The extracted gases are collected in two fractions. The first fraction is collected during the first 20 min of the melting process until about two-thirds of the ice is melted. The remaining gases are collected in the second fraction. The gas composition of the first fraction corresponds approximately to the gas composition in the air bubbles (Reference BernerBerner unpublished) and allows estimation of CO2 concentration of air in the bubbles. The second fraction includes CO2 formed by carbonates in the melt water. To extract the CO2 content of the air in the bubbles alone, a new fast dry-extraction method was developed, by which the ice is crushed into small pieces in an evacuated container between two plates equipped with an array of steel needles. The gases are released into a laser absorption cell where CO2 concentration is measured with a laser spectrometer (Zumbrunn and others submitted for publicationFootnote * ). The sample size is 1 g; the extraction time lasts <1 min. The short extraction time and a container temperature of -20°C minimize contamination with CO2 desorbed from the walls of the extraction container. The short time involved is one of the big advantages of this mechanical method over other mechanical methods. Pieces of the crushed ice have diameters between 0.1 and 1 mm. The gas yield is about 75% compared with results from the meltextraction method. The small sample size enables the study, with high spatial resolution, of the distribution of CO2 concentration in bubbles.
Analytical Methods
The gas samples, which are extracted from 300 g of ice using the vacuum-melting technique, are measured in a Hewlett Packard 5880 A gas chromatograph. N2, O2, and Ar are measured with a thermal conductivity detector. CO2 is catalytically transformed into methane and then measured with a flame ionization detector. The detection limit for CO2 is about 2×l0−13 m3 s.t.p., for N2, O2 and Ar about 10−11 m3 s.t.p.
The CO2 concentration in the very small gas samples extracted using the cracker method is measured with a laser absorption spectrometer. The light source is a PbS-Diode laser emitting at 4.3 μm. For this wavelength, the CO2 molecules have a strong vibrational transition. The laser beam passes through an absorption cell filled with the sample gas and a monochromator, which filters out the undesirable modes. The intensity of the light leaving the monochromator is measured with a PbSe-detector.
The absorption cell has an optical path length of 150 mm. An air sample extracted from 1 g ice corresponds to a pressure of 60 to 100 Pa in the cell. The pressure can be measured with an accuracy of 1 Pa. The accuracy of the CO2 concentration measurement at this low gas pressure is about 1%. The overall accuracy, including uncertainties regarding the extraction, is estimated to be 2%. Both analytical methods are based on a calibration with three World Meteorological Organization CO2 in air standards (320 ppm, 342 ppm, 380 ppm) prepared at the Scripps Institution of Oceanography, San Diego, California, U.S.A.
Results
Before the analyses, 1 kg samples were cleaned by removing a 10 mm layer from all sides with a microtome knife. The cleaned ice was cut into one 300 g sample for vacuum melting and into several 1 g samples for the dry extraction. The measured results for samples from Camp Century and Byrd station are listed in Tables III and IV. The CO2 concentrations for the first melt-extraction fraction (measured with the gas chromatograph) and the concentration obtained with the laser spectrometer are plotted in Figures 1 and 2. The results measured with the laser spectrometer are shown with the lowest and highest value and with the median value for each depth. Since we consider the risk of contamination with CO2 to be higher than that of CO2 loss, we believe that the lowest values are at least as significant as the median values. In Figures 1 and 2, the curves are drawn through the means of the three lowest values measured with the laser spectrometer. The CO2 concentrations measured for the first extraction fraction show the same trend as earlier measurements on different ice samples of the same ice cores (Reference Berner, Oeschger and StaufferBerner and others 1980). The laser spectroscopic results confirm this general trend. The laser median values, however, are about 30 ppm lower than the first extraction gases were extracted by the dry extraction method and analysed with the laser spectrometer. The CO2 concentration measured in this young ice is 271±9 ppm, which agrees with estimates of the pre-industrial atmospheric CO2 concentration. Good reproducibility is shown by the small standard deviation.
CO2 concentration in ice samples from Camp Century: ⚪ CO2 concentration of the first extraction fraction ⧳ CO2 concentration of the dry extracted gases measured with laser spectroscopy. Black dot indicates median value. Highest and lowest results (T, ⊥) are also indicated. The smoothed curve connects 3-value running means of the lowest values measured with the laser for each depth.

CO2 concentrations in ice samples from Byrd station: ⚪ CO2 concentration of the first extraction fraction ⧳ CO2 concentration of the dry extracted gases measured with laser spectroscropy. Black dot indicates median value. Highest and lowest results (T, ⊥) are also indicated. The smoothed curve connects 3-value running means of the lowest values measured with the laser for each depth.

RESULTS OF ANALYSES OF ICE FROM CAMP CENTURY, GREENLAND

RESULTS OF ANALYSES OF ICE FROM BYRD STATION, ANTARCTICA

Discussion
Based on the agreement between the estimated value for the pre-industrial CO2 content of the atmosphere and the laser results for the samples from North Central, Greenland, we conclude that the CO2 concentration in air bubbles of young ice corresponds within about 10 ppm with the atmospheric CO2 concentration. The results obtained for samples from Camp Century and Byrd station show at a certain depth a well-marked transition from lower to higher CO2 concentrations. The transition occurs in both cores at the same depth interval as the shift from lower to higher δ18O values (Reference Berner, Oeschger and StaufferBerner and others 1980).
The lowest CO2 concentrations in bubbles from Camp Century coincide with the highest alkalinity of the ice (pH = 8.5). The alkalinity of the melt water delays the CO2 extraction by the vacuum - melting method and causes the CO2 concentration of the first extraction to be low. We cannot exclude that the alkalinity also causes a lowering of the CO2 concentration in the dry-extracted gases. If the alkalinity caused the whole shift from low to high values at 1 130 m, a different explanation (such as bubble disappearance) is necessary for the corresponding shift in the Byrd core, since this shift is not connected with any change in the alkalinity.
The shift in the CO2 concentration values in the core from Byrd station coincides approximately with the disappearance of the bubbles (Reference GowGow 1968). The bubbles do not disappear at the corresponding depth in Camp Century (Reference MillerMiller 1969). We feel that the coincidence of the shift from low to high CO2 concentration values in two ice cores from different locations, both where the δ18O of the ice shifts, is more easily explained by a shift from a lower to a higher CO2 concentration in the atmosphere at the end of the last glaciation than by independent separate explanations for each core.
It is difficult to give absolute values for the atmospheric CO2 concentration because of alkalinity effects, the diffusion of CO2 into the ice structure, and possible carbon contaminations. The CO2 data for samples from depths between 400 and 900 m show the greatest scatter. The CO2 variance at these depths is probably caused by contamination.
The cores from this depth interval show many small cracks. For three samples, traces of bore-hole fluid (diesel oil and trichloroethylene) were observed in the melt water. We assume that some of these samples were contaminated with bore-hole fluid and that additional CO2 was produced in the ice core during storage. It is highly desirable that in future core drillings more and even better suited ice cores will become available. Then it should be possible to give estimated absolute values for the CO2 concentration of the atmosphere in the last 50 ka.
Acknowledgements
We would like to express our most sincere thanks to Drs C C Langway and B L Hansen who envisaged the potential of ice cores for studies of this kind and made them available for the present investigations. This work has been supported by the Swiss National Science Foundation, the US National Science Foundation Division of Polar Programs, US National Science Foundation, and the US Department of Energy.



