1. Introduction
The studied ophiolitic plutonic crustal sequence, exposed north and northeast of Sabzevar, between 57°44′E and 58°00′E longitude, and 36°22′N and 36°16′N latitude, is part of the Sabzevar ophiolite belt that occurs around the Central Iran micro-continent (Fig. 1) (Stocklin, Reference Stocklin1968; Knipper & Ricou, Reference Knipper and Ricou1986). The ophiolite, with a general E–W trend, starts from around the town of Fariman in the east, and extends, as tectonic slices, to near Abbasabad village where it narrows and disappears. The Sabzevar ophiolite is exposed along the Meyamey Fault between the Central Iran micro-continent and the Alborz–Binalud structural zone (Fig. 1).
Map showing the distribution of the exposures of ophiolites in Iran and the location of the study area. Adapted from 1:1000000 Magmatic Map of Iran by Emami, Sadegi & Omrani (Reference Emami, Sadegi and Omrani1993) and Sedimentary–Structural Map of Iran by A. Aghanabati (Reference Aghanabati2004).

Earlier study of the ophiolite belt, in the form of Ph.D. dissertation (E. Sadredini, unpub. Ph.D. thesis, Univ. Saarbrucken, 1974), described the geology and petrography of the middle part of the Sabzevar ophiolitic belt, with a 1:200000 geological map, in an area between the villages of Bid in the west and Ooz in the east. Although the map presented various units of ophiolitic sequences, such as a diabase sheeted dyke complex in Bagjar and a gabbroic body in Soleymanieh, it did not cover the wehrlitic intrusion, pegmatite gabbro and plagiogranite. F. Vaziri-Tabar (unpub. Ph.D. thesis, Univ. Saarbrucken, 1976) determined the microfauna in the pelagic limestone and described the petrography of phyric andesite in the Upper Cretaceous turbiditic series and Eocene volcanic sedimentary rocks northwest of Sabzevar. N. Alavi-Tehrani (unpub. Ph.D. thesis, Univ. Saarbrucken, 1976) studied the geology and petrography of the ophiolitic rocks northwest of Sabzevar with a 1:250000 geological map covering an area between the villages of Tabas in the east and Bid in the west. He described the geochemistry of different rocks from the Sabzevar ophiolitic sequences and concluded that they are not the product of a single magmatic activity, and proposed an oceanic ridge model for their formation. Lensch, Mihm & Alavi-Tehrani (Reference Lensch, Mihm and Alavi-Tehrani1977) interpreted the geology and petrography of the Sabzevar ophiolite in a geological map at the scale of 1:500000. They distinguished eight main units in the ophiolitic belt: harzburgite, intrusive rocks, a sheeted dyke complex, volcanic sedimentary sequences, mélange, metamorphic rocks, a Tertiary series and Quaternary rocks. However, their work did not describe the wehrlitic intrusion. Lensch, Mihm & Alavi-Tehrani (Reference Lensch, Mihm and Alavi-Tehrani1979, Reference Lensch, Mihm and Alavi-Tehrani1980) and Lensch (Reference Lensch and Panayotou1980), studying 230 major element chemical analyses, recognized the low-Ti character of the ophiolitic crustal rocks and attributed them to an immature island arc. Lensch & Davoudzadeh (Reference Lensch and Panayotou1981) identified three types of ophiolitic assemblage around the Central Iran micro-continent: a ridge type, trench type and coloured mélange. According to their palaeontological data, the ophiolitic sediments are Campanian–Maastrichtian in age. Radiometric (K–Ar) age determination yielded 81.2 ± 4.1 Ma and 76.8 ± 3.8 Ma ages for the lava and diabase (Lensch & Davoudzadeh, Reference Lensch and Davoudzadeh1981). The trench type ophiolite is exposed in two large massifs south of Sabzevar, at Oryan and north of Bardeskan. The ridge type is exposed in the northern part of the belt (Lensch, Mihm & Alavi-Tehrani, Reference Lensch, Mihm and Alavi-Tehrani1979, Reference Lensch, Mihm and Alavi-Tehrani1980). The highly deformed coloured mélange is exposed near the city of Nain. In another dissertation project, M. K. Noghreyan (unpub. These ès Sciences, Univ. de Nancy I, France, 1982) studied the geochemical, mineralogical and structural evolution of the middle part of the ophiolite complex. He described the deformation in harzburgite and proposed that differentiation in the cumulate gabbro occurred in a closed magma chamber. He further proposed that fractional crystallization occurred from a tholeiitic magma that was enriched in silica and had low values of titanium. Applying the discrimination geochemical diagrams from hypabyssal volcanic rocks, Noghreyan (unpub. These ès Sciences, Univ. de Nancy I, France, 1982) suggested that the ophiolitic belt formed in relation to an immature arc. Ohnenstetter (Reference Ohnenstetter1983) studied the layered cumulate gabbro in Soleymanieh (Fig. 2) and Tabas and Nurabad massifs, and interpreted them to be a disrupted magma chamber. Based on her structural study of the layered cumulate gabbro, she concluded that accretion occurred along an oblique spreading axis. Her structural investigation revealed that the shape of the magma chamber and layering in the gabbro massifs were mainly controlled by faults. Lindenberg, Goerker & Ibbeken (Reference Lindenberg, Gorler and Ibbeken1983) reported structural and orogenic evolution of the Sabzevar ophiolite belt in the area of Oryan. In their model, the ophiolitic mélange in Oryan is interpreted as tectonized breccia at the base of the oldest nappes. Spices, Lensch & Miham (Reference Spices, Lensch and Miham1983) studied the geochemistry of the post-ophiolitic Tertiary volcanic rocks between Sabzevar and Quchan/NE Iran, and suggested a geodynamic model for a collision between an oceanic lithosphere and oceanic island arc, with andesitic volcanism along the continental margin of the Turan plate. In their hypothesis, the closure of the rift took place in the Eocene between the central-East Iran microplate and Turan plate. Post-ophiolitic calc-alkaline volcanism was generated by partial melting of the mantle wedge above a northwardly directed subduction zone. Baroz et al. (Reference Baroz, Macaudière, Montigny, Noghreyan, Ohnenstetter and Rocci1984) discussed the possible geotectonic reconstructions of the middle part of the Sabzevar ophiolite and, by attributing the composition of pillow lavas to immature island arcs (Lensch, Mihm & Alavi-Tehrani, Reference Lensch, Mihm and Alavi-Tehrani1979, Reference Lensch, Mihm and Alavi-Tehrani1980), suggested formation at an active margin. The 1:250000 Sabzevar Geological Quadrangle (compiled by Sahandi, Reference Sahandi1992) and 1:100000 Sabzevar Geological Quadrangle (Majidi, Reference Majidi1999) are published by the Geological Survey and Mineral Exploration of Iran (Fig. 2). Shojaat et al. (Reference Shojaat, Hassanipak, Mobasher and Ghazi2002) investigated the petrology, geochemistry and tectonics of the Sabzevar ophiolite. They distinguished basaltic rocks that formed from an initial melt with a normal mid-ocean ridge basalt (N-MORB) chemical signature, enriched MORB (E-MORB) and basaltic rocks with a light rare earth element (LREE)-enriched signature, and incompatible trace element patterns that suggest an island arc affinity. Rossetti et al. (Reference Rossetti, Nasrabady, Vignaroli, Theye, Gerdes, Razavi and Moin Vaziri2009) assigned an Early Cretaceous (Albian) isotopic age for the peak of metamorphism around Soltan Abad.
Reduced (1:75000) version of our 1:25000 geological map of the study area.

Although the geological map of Lensch, Mihm & Alavi-Tehrani (Reference Lensch, Mihm and Alavi-Tehrani1977) shows the diabase sheeted dyke complex of the north Garagoli–Ooz area, it misses the wehrlitic and pegmatite gabbro intrusions. The sheeted dyke complex is introduced as a micrograbbro on the geological map of Majidi (Reference Majidi1999). A comparison of the change in the strike of the sheeted diabase dykes and layering in the Soleymanieh (Ohnenstetter, Reference Ohnenstetter1983) and Garagoli gabbroic plutons necessitates the revision of the geology in the study area. The absence of minor and REE data from these rocks, and their interpretation based on the new definition of ophiolites, given approximately after the introduction of supra-subduction ophiolites (Pearce, Lippard & Roberts, Reference Pearce, Lippard, Roberts, Kokelaar and Howells1984), also calls for a study of the ophiolitic plutonic crustal sequence in the area northeast of Sabzevar. To study the plutonic crustal sequence, we selected a section in the valley north of Garagoli (Fig. 2) and, for comparison, systematically sampled the gabbro exposed to the south of Soleymanieh village. Samples of wehrlite and plagiogranite northwest of Ooz and south of Kykhosro villages (Fig. 2) were also collected. After preparing the thin-sections and subsequent petrographic study, 20 unaltered samples were selected and sent to the SGS Laboratory in Canada (http://www.sgs.com/en/Mining) for analysis of major oxides and minor and trace elements with the inductively coupled plasma mass spectrometry (ICP-MS) and inductively coupled plasma atomic emission spectroscopy (ICP-AES) methods.
2. Geology
Figure 2 shows the reduced (1:75000) version of our new 1:25000 geological map of the area. Although the contact between the intrusive and extrusive sequences is tectonic, the transition from the isotropic gabbro to the diabase sheeted dykes is normal. The mantle sequence in the study area comprises harzburgite, clinopyroxene-bearing harzburgite, lherzolite, serpentinized dunite and local lenses of chromitite. Despite pervasive serpentinization of the peridotite, in some cases the porphyroclastic texture is still apparent where large crystals of orthopyroxene and rotated clinopyroxene occur in a groundmass of serpentinized olivine, producing a foliation. Petrographic study reveals the presence of kink bands in large olivine crystals. The strike of the foliation is variable and hard to follow owing to intense deformation and serpentinization, but the approximate dip is subvertical to the north. In some cases, the peridotite is cut by individual, often rodingitized diabasic to gabbroic and micrograbbroic dykes along N–S, E–W and occasionally NW–SE directions. Serpentinite, with remnants of chert, radiolarite, fragmented pillow lava and sparse listvenite occur along thrust zones in an area northwest of Ooz and east of Garagoli villages (Fig. 2). These chaotic serpentinites do not show any sign of metamorphism, foliation or lineation. Therefore, they can hardly be categorized as ‘coloured melange’ as defined by the Penrose Committee (Anonymous, 1972). Subvertical–vertical, few centimetre thick veins and veinlets of pyroxenite cut across the peridotite. Ohnenstetter (Reference Ohnenstetter1983) reported 50 cm thick pyroxenite dykes that cut serpentinized peridotite and have dunite margins. Chromitite lenses also occur, west of Ooz and north of Bagjer village, with remnants of intensely serpentinized dunite. The relationship between dunite and chromitite cannot be deciphered because of mining excavations. Occasionally, the peridotite is intensely tectonized, and contains exotic blocks of mylonitic granite and amphibolite.
Exotic blocks of amphibolite and mylonitic granite, exposed north of Bagjer, may be tectonic remnants of the Soltan Abad metamorphic complex (Rosetti et al. Reference Rossetti, Nasrabady, Vignaroli, Theye, Gerdes, Razavi and Moin Vaziri2009), which is exposed north of the Sabzevar ophiolite belt. These blocks have been metamorphosed up to greenschist facies, and are composed of intermittent, dark slivers of metabasite-amphibolite and light granitic mylonite. The layers are a few millimetres to a few centimetres in thickness, and are folded in places. Amphiboles, mostly actinolite, define a foliation in the dark layers. Mylonitic texture and structure are apparent in the light layers, with altered quartz and plagioclase porphyroclasts.
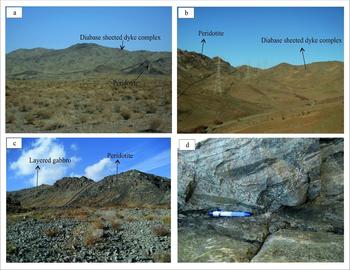
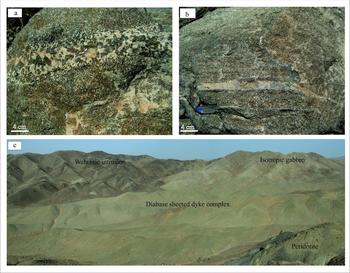
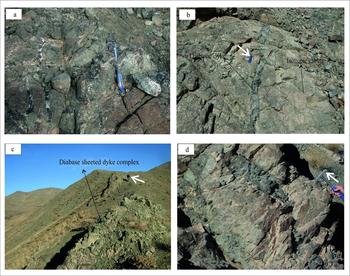
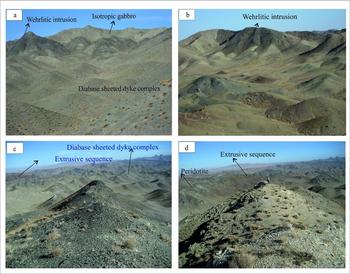
South of Soleymanieh, the plutonic crustal sequence contains layers of olivine gabbro, with cumulative characteristics, and pyroxene gabbro, wehrlite-pyroxenite and pegmatite gabbro in the base, and massive and isotropic gabbro at the top of the body, which are intruded by pegmatite gabbro and plagiogranite veins and isolated diabasic dykes. In Garagoli, cumulate gabbro is scarce, but massive and isotropic gabbro with faint layering occurs at the base. Foliated hornblende gabbro occurs at the top and grades to the diabase sheeted dyke complex. Both are cut, at low angles to the layering, by individual diabase dykes, wehrlite and olivine websterite intrusions, and pegmatitic gabbro and plagiogranite veinlets and pseudosills. Figures 3–6 show selected field features and Figure 7 depicts the geological sections of the plutonic crustal sequence north of Garagoli (Fig. 7a) and south of Soleymanieh (Fig. 7b) villages. Rose diagrams, displaying the trend of the dominant planar features in each unit, are also shown in Figure 7. Figure 8 shows the schematic stratigraphic column of the plutonic crustal sequence north of Sabzevar.
Selected field pictures. (a) A perspective from a distance, showing the thrusting of the diabase sheeted dyke complex over peridotite, northwest of Garagoli village. (b) Thrusting of peridotite onto the diabase sheeted dyke complex, northeast of Bagjer village. (c) Peridotite underlying layered and cumulate gabbro with a tectonized contact, exposed southwest of Soleymanieh village. (d) Magmatic layering in the cumulate gabbro, southwest of Soleymanieh. Pen is 14 cm long.

Selected field pictures. (a) Pseudosills of pegmatite gabbro parallel to the magmatic layering. (b) Formation of plagiogranite along the magmatic layering in the layered gabbro, southwest of Soleymanieh. (c) Exposure of the isotropic gabbro, diabase sheeted dykes and wehrlitic sills, south of Kykhosro village.

Selected field pictures. (a, b) Pegmatite gabbro veins, plagiogranite and individual diabase dykes (b), cutting the isotropic gabbro north of Garagoli. Pens for scale are 12 cm long. (c) Diabase sheeted dykes north of Garagoli. Height of man for scale is 160 cm. (d) Coarse-grained and microcrystalline (darker layer) diabase, west of Ooz village. Hammer for scale is 32 cm long.

Selected field pictures. (a) E–W-trending exposure of the wehrlite intrusion cutting the isotropic gabbro and diabase sheeted dykes, west of Ooz. (b) A wehrlite intrusion with lobed margins, cutting the diabase sheeted dyke complex, east of Garagoli. (c) E–W-trending wehrlite intrusion east of Garagoli (looking east). (d) E–W-trending plagiogranite exposure (looking east).

Geological sections across the crustal sequence, with corresponding rose diagrams shown for each unit, (a) north of Garagoli village, and (b) southwest of Soleymanieh. (c) Schematic diagram depicting the opening of the mid-ocean ridge and movement along transform faults.

Schematic stratigraphic column of the plutonic crustal sequence, north of Sabzevar.

Different units occur in tectonic slices that are bound on both sides by thrusts. Southwest of Garagoli, the diabase sheeted dykes are thrust onto serpentinized peridotite (Fig. 3a), and in the northeast of Bagjer village, peridotite is thrust onto the sheeted dykes (Fig. 3b). The thrusts dip to the north and the thrust units in the sequence grade into one another from the bottom to the top; for example, the massive gabbro grades into the diabase sheeted dyke complex. In the area east of Garagoli, the cumulate gabbro is scarce and occurs with wehrlite intrusions, but exhibits better outcrops south of Soleymanieh (Fig. 3c). In the Soleymanieh area, the cumulate gabbro and pyroxene gabbro are exposed and have magmatic layering (Fig. 3d) and marked shear zones showing ductile deformation. The gabbro has plenty of light and dark bands of plagioclase and ferromagnesian minerals, respectively, which are cut, at very low angles to the layering, by thin layers of pyroxenite, pseudosills of pegmatitic gabbro and plagiogranite (Fig. 4a, b).
The thickness of the layers in the Soleymanieh gabbro ranges from a few centimetres to 0.75 cm. Wehrlite and pyroxenite occur in thin (few centimetre) discontinuous sills in the cumulate gabbro. Pegmatite gabbro also occurs as sills with olivine gabbro, but its mineralogy differs from the pegmatite gabbro that occurs as fine veins and dykes that cut the isotropic gabbro at the top of the body. While olivine crystals in the layered pegmatite gabbro constitute the primary minerals, those in the pegmatite gabbro veins are scarce or not seen at all. The pyroxenes in the pegmatite gabbro at the base of the Soleymanieh body are clinopyroxene and, in places, orthopyroxene, and are often substituted in the veins by amphiboles. Mineralogic granometric variation is not seen in every layer, and a transition from olivine gabbro to pegmatite gabbro or layers of wehrlite and pyroxenite does not occur, which may be explained by sequential injections of mafic magma into the magma chamber.
The base of the cumulate layers in the Soleymanieh body strike approximately E–W with a few degrees of variation. The variation is greater at the contact between the body and the peridotite country rock. The layering disappears or becomes sparse at the top of the body and in the isotropic gabbro. Only the trace of the layers can be measured on two-dimensional exposed surfaces, making it difficult or impossible to determine the dip of the layers. For this reason, the dips shown on the sections in Figure 7 are estimated. The majority of the pegmatite gabbro and plagiogranite veins strike N–S, with a few that strike E–W. A small number of individual diabase dykes cut the Soleymanieh gabbro. Although cumulate gabbro is exposed south of Soleymanieh, where it grades into isotropic gabbro at the top of the sequence, its outcrops are scarce in Garagoli and south Kykhosro. In these two areas, massive and foliated hornblende gabbro and a diabase sheeted dyke complex, which correlate with the upper parts of gabbros in well-known ophiolites such as Oman (Nicolas & Boudier, Reference Nicolas and Boudier2009), are predominant (Fig. 4c).
The isotropic gabbro in the Garagoli body shows mineralogical similarities to the isotropic gabbro at the top of the south Soleymanieh gabbroic body. In both, olivine disappears and clinopyroxene and plagioclase gradually increase towards the top of the body. The magmatic layering also gradually disappears towards the top in both bodies. The dominantly N–S-striking layers of the Garagoli body differ from the mostly E–W-striking layers in the Soleymanieh body, and show evidence for plastic and viscous deformation superposed on magmatic layering. The obliteration of magmatic layering increases towards the middle of the body, where it becomes difficult to measure the attitude of the layers. Wedge- and arrow-shaped and twisted light-coloured layers of mostly plagioclase and dark layers of pyroxene and occasional olivine give evidence for plastic deformation.
North of Garagoli, foliated hornblende gabbro occurs above the massive and isotropic gabbro (Fig. 8), and evidence for the root of the diabase sheeted dykes is first observed in the foliated and isotropic gabbro. Plagioclase, clinopyroxene and hornblende display a clear preferred orientation in the foliated gabbro. However, in known ophiolites such as Oman, the succession is layered gabbro, followed by foliated gabbro, with steep foliation that parallels dykes in the sheeted dyke complex, followed by a thin layer of isotropic gabbro and plagiogranite in which the sheeted dyke complex is rooted (Nicolas & Boudier, Reference Nicolas and Boudier2009; Juteau & Mury, Reference Juteau and Maury2009). The magmatic foliation in the foliated hornblende gabbro in the Garagoli body, which lies above the isotropic gabbro, is primary and viscous and, in contrast to the middle part of the body, does not show any evidence for plastic deformation. Moreover, the strike of the foliation in the foliated hornblende gabbro is oriented N–S, similar to the faint layering in the isotropic gabbro. Further studies are required to understand the differences between the foliated gabbro in known ophiolite sequences in Oman and foliated hornblende gabbro in the Garagoli body. As has been suggested for ophiolitic hornblende gabbro from the central Anatolian Aksaray and Kayseri regions in Turkey (Kocak et al. Reference Kocak, Isıka, Arslanb and Zedef2005), such a gabbro may have formed from a hydrous peridotite source. The massive gabbro is cut by veinlets of pegmatite gabbro (Fig. 5a), plagiogranite, and less frequently, individual diabase, microgabbro and andesitic-basaltic dykes (Fig. 5b). The diabase sheeted dykes (Fig. 5c) occur as coarse and fine crystal facies types (Fig. 5d).
The diabase sheeted dykes strike approximately E–W north of Garagoli and N–S in the area northeast of Bagjer village (Fig. 2). Wehrlitic intrusions cut these units (Fig. 6a–c), and form dark and high peaks northwest and east of Garagoli. Small (millimetre-scale) quartzo-feldspathic aggregates occur in the wehrlitic intrusions, north of Ooz. The formation of these aggregates may signify differentiation of plagiogranite from wehrlite, a hypothesis that requires further field and laboratory investigation. The margins of these wehrlitic intrusions are completely lobed (Fig. 6b) and intercalated, suggesting that they were intruded into the country rock occurred while they were warm and viscous. The contacts of the intrusion with the isotropic gabbro and diabase sheeted dykes, on the other hand, show alteration zones. North of Garagoli, the pegmatite gabbro occurs as small bodies, and often as vein-veinlets that cut peridotite, gabbro, diabase sheeted dykes and wehrlitic intrusions. The pegmatite gabbro, in this area, often includes clinopyroxene, plagioclase, amphibole and rarely olivine. In massive types, the often rodingitized clinopyroxene crystals may reach 40 cm in length. The plagiogranite occurs as small bodies (Fig. 6d) or parallel dykes that cut wehrlitic and pegmatitic gabbro intrusions. Like the wehrlitic intrusions, plagiogranites occur along E–W-oriented exposures northwest of Ooz and south of Kykhosro (Fig. 6d).
Figure 7c schematically illustrates opening across the axis of a mid-ocean ridge and segmentation of the ridge along transform faults (Juteau & Maury, Reference Juteau and Maury2009). While the sheeted dykes form parallel to the ridge axis, in these environments, the foliation (banding) in the cumulate gabbro and the mineral preferred orientation in the foliated gabbro, develop perpendicular to the ridge (Juteau & Maury, Reference Juteau and Maury2009). These orientations may deform (rotate) by transform faults as much as 90°. Structural analysis of the strike of the magmatic layering and the strike of the diabase dykes in the area north of Garagoli, and their comparison with the strike of the magmatic layering in the area south of Soleymanieh, provide important clues to test this model. North of Garagoli, the magmatic layering in the gabbro and mineral preferred orientations in the foliated hornblende gabbro are oriented roughly N–S. The diabase dykes and outcrops of plagiogranite and wehrlite are oriented approximately E–W (Fig. 7a). The diabase sheeted and individual dykes, in the same area, also strike approximately E–W, across the magmatic layering in the gabbros. These measurements, taken north of Garagoli, suggest an opening across an E–W-oriented mid-ocean ridge. On the other hand, in the area south of Soleymanieh, the magmatic layering roughly strikes E–W, and gabbro veinlets of pegmatite and plagiogranite strike N–S (Fig. 7b). If the pegmatite veinlets form parallel to the ridge axis, a N–S trend for the ridge axis can be inferred in the Soleymanieh area. The discrepancy in the orientation of the inferred ridge axes in the two areas can be explained either by rotation during emplacement of the ophiolite or by transform faults (Fig. 7c). The latter is suggested by deformation indicators such as those in mylonitic harzburgite, characterized by stretched, elongated olivine bands deformed by systematic kink bands, and rotated and bent diopside porphyroclasts with undulose extinction. Determination of the true trend of the ridge in the Sabzevar ophiolite belt requires extensive and systematic measurement of the attitude of magmatic and shear-related foliation and lineation in the area between the wide exposures of the ophiolite at its starting point around the town of Fariman in the east and Abbasabad village in the west where it tapers off.
North of Bagjer village, volcanic rocks, which occasionally form ridges, occur at the top of the extrusive sequence of the Sabzevar ophiolite (Fig. 8), and contain pillow lava with minor volcaniclastic rocks, mainly tuff and breccia, and pelagic limestone. Hyaloclastic breccia with carbonate cement and interlayers of pelagic limestone occur as intercalations among the pillow lava. Palaeontological study of the pelagic limestone by Zohreh Sohrabi (unpub. report, Geological Survey of Iran, 2009) at the Geological Survey and Mining Exploration of Iran, assigned a Late Cretaceous age (Maastrichtian – Late Maastrichtian), which represents the relative age of the ophiolite in this area. The following microfauna is identified in the pelagic limestone: Abathomphalus mayaroensis, Racemiguembelina fructicosa, Gansserina gansseri, Trinitella scotti, Globotruncanita stuarti, Globotruncanita stuartiformis, Globotruncana aff. falsostuarti, Globotruncanita conica, Radotruncana calcarata, Contusotruncana atelliformis, Pseudotextularia nuttalli and Heterohelix sp.
3. Petrography
Petrographic investigation shows that the cumulate gabbros, including olivine and pyroxene gabbro, occur with thin layers of pyroxenite. The olivine gabbro has a microscopic mesocumulate texture, while pyroxene gabbro has an adcumulate texture. Heteradcumulate and granular textures are also seen in the upper parts of the massive gabbro. The layering in the cumulate rocks is defined by the internal variation of the amount of the modal minerals in each layer (Hunter, Reference Hunter and Cawthorn1996). The term ‘cumulate’ was defined by Wager, Brown & Wadsworth (Reference Wager, Brown and Wadsworth1960), and used by Wager (Reference Wager1963) and Wager & Brown (Reference Wager and Brown1968) to describe the texture of layered and cumulate igneous rocks whose minerals had cooled slowly. In this definition, early crystals that crystallize on the floor of the magma chamber are called cumulus and those that form out of the interstitial liquids are called intercumulus.
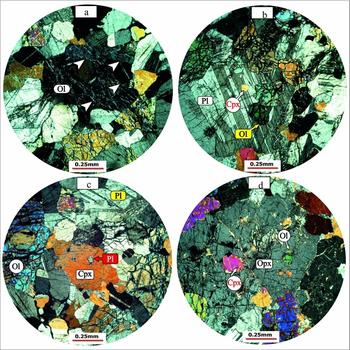
The olivine gabbro contains olivine, clinopyroxene, orthopyroxene and plagioclase. The olivine is the cumulus phase and occurs as anhedral crystals with a high relief and many fractures along which olivine is altered to serpentine. In places, olivine is completely altered to serpentine, which may constitute about 10–15% of the rock. Kink bands (Fig. 9a) also occur in the olivine, suggesting compaction during viscous deformation (Hunter, Reference Hunter and Cawthorn1966). Olivine inclusions in plagioclase (Fig. 9b), clinopyroxene (Fig. 9c) and orthopyroxene (Fig. 9d) indicate earlier formation of olivine compared to the host minerals. Plagioclase has albite, Carlsbad and arrowhead twinning, and calcic compositions, ranging from labradorite to bytownite, and constitutes 45–50% of the thin-section. The albite twinning is pointed in places and looks like the arrowhead twinning (Fig. 9b). This kind of twinning in plagioclase forms as a result of twin gliding during strain due to a change in the crystal system of these minerals (Shelly, Reference Shelley1993), and is evidence for crystal plastic deformation at high temperature (Juteau & Maury, Reference Juteau and Maury2009). The plagioclase inclusions in the clinopyroxene indicate earlier formation of the plagioclase relative to the host mineral (Fig. 9c). The clinopyroxenes constitute 20–25% of olivine gabbro and are anhedral diopside with Carlsbad twinning. Locally, the clinopyroxene has altered to hornblende. Inclusions of olivine and clinopyroxene also occur in plagioclase (Fig. 9b), indicating earlier formation of the inclusions compared to the plagioclase. Inclusions of clinopyroxene in orthopyroxene indicate formation of the clinopyroxene before orthopyroxene (Fig. 9d).
Selected photomicrographs showing: (a) Kink bands in olivine of olivine gabbro, southwest of Soleymanieh. (b) Olivine and clinopyroxene inclusions in plagioclase of olivine gabbro, in which plagioclase shows arrowhead twinning. (c) Plagioclase inclusions in the clinopyroxene of olivine gabbro, southwest of Soleymanieh. (d) Olivine and clinopyroxene inclusions in orthopyroxene. Abbreviations: Ol – olivine, Pl – plagioclase, Cpx – clinopyroxene, Qtz – quartz.

Petrographic investigations reveal differences in the sequence of crystallization of the minerals in cumulate rocks of ophiolites (Yumul, Reference Yumul1996). Church & Riccio (Reference Church and Riccio1977) have suggested the following four sequences of crystallization for the Bay of Island cumulate ophiolite:
-
(A) olivine + spinel → orthopyroxene → clinopyroxene → plagioclase
-
(B) olivine + spinel → clinopyroxene → plagioclase → orthopyroxene
-
(C) olivine + spinel → clinopyroxene → orthopyroxene → plagioclase
-
(D) olivine + spinel → plagioclase → clinopyroxene → orthopyroxene
The first three trends relate to supra-subduction zones (SSZ), and the fourth to gabbro in mid-ocean ridges. Pearce, Lippard & Roberts (Reference Pearce, Lippard, Roberts, Kokelaar and Howells1984) have distinguished SSZ ophiolites from mid-ocean ridge types based on the sequence of crystallization in the cumulate part of the ophiolitic crustal sequence. According to this classification, in the SSZ ophiolites, clinopyroxene, and sometimes orthopyroxene, crystallize earlier than plagioclase, but in the mid-ocean ridge ophiolites, plagioclase crystallizes before clinopyroxene and orthopyroxene. The observed order of crystallization in the cumulate gabbro of the study area can be divided into two groups:
-
(1) olivine → plagioclase → clinopyroxene → ± orthopyroxene → amphibole
-
(2) olivine → clinopyroxene → ± orthopyroxene → plagioclase → amphibole
These groups match the crystallization order in the mid-ocean ridge and SSZ ophiolites, respectively (Cameron, Nesbit & Dietrich, Reference Cameron, Nesbit, Dietrich and Panayiotou1980; Hebert & Laurent, Reference Hebert, Laurent, Malpas, Moores, Panayiotou and Xenophontos1990; Parlak, Deloye & Bing, Reference Parlak, Delaloye and Bing1996; Parlak, Hock & Deloye, Reference Parlak, Hock and Delaloye2002; Yamasaki, Maeda & Mizuta, Reference Yamasaki, Maeda and Mizuta2006). Orthopyroxene is also an early phase in the cumulate rocks of the SSZ ophiolites, and crystallizes earlier than plagioclase (Cameron, Nesbit & Dietrich, Reference Cameron, Nesbit, Dietrich and Panayiotou1980; Pearce, Lippard & Roberts, Reference Pearce, Lippard, Roberts, Kokelaar and Howells1984; Hebert & Laurent, Reference Hebert, Laurent, Malpas, Moores, Panayiotou and Xenophontos1990; Parlak, Deloye & Bing, Reference Pearce and Wyman1996; Parlak, Hock & Deloye, Reference Parlak, Hock, Delaloye, Bozkurt, Winchester and Piper2000, Reference Parlak, Hock and Delaloye2002; Kocak et al. Reference Kocak, Isıka, Arslanb and Zedef2005; Yamasaki, Maeda & Mizuta, Reference Yamasaki, Maeda and Mizuta2006). Perhaps it is for this reason that wehrlite is more common than troctolite in the cumulate part of the SSZ ophiolites (Pearce, Lippard & Roberts, Reference Pearce, Lippard, Roberts, Kokelaar and Howells1984). In general, the order of crystallization is also related to the change in pressure. For example, in subduction zones, where pressure is high, pyroxene crystallizes before plagioclase, whereas in low-pressure environments, such as mid-ocean ridges, plagioclase crystallizes before pyroxene (Parlak, Deloye & Bing, Reference Pearce and Wyman1996; Parlak, Hock & Deloye, Reference Parlak, Hock and Delaloye2002).
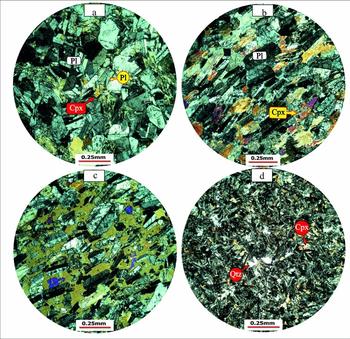
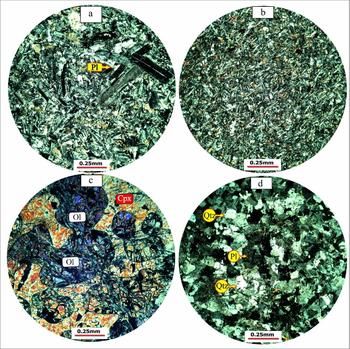
The studied pyroxene gabbro displays a mesocumulate texture compared to the pyroxenite, which has an adcumulate texture. Olivine, in the massive gabbro, gradually disappears and, by growing clinopyroxene among the plagioclase, forms mesocumulate (Fig. 10a, b) and heteradcumulate (Fig. 10c) textures. Granular and intergranular textures are seen in the upper parts in the massive and isotropic gabbro, where hornblende also appears as a major mineral. The foliated gabbro reveals adcumulate and heteradcumulate textures (Fig. 10c), with oriented plagioclase and clinopyroxene. Plagioclase is the cumulus phase, and clinopyroxene, orthopyroxene and hornblende constitute the intercumulus mineral phases. The plagioclase has a tabular crystalline form and, in places, zoned albite and albite-Carlsbad twinning. Although these are often intact, they are altered into argillaceous minerals along fractures. Clinopyroxene and orthopyroxene have altered into tremolite-actinolite and hornblende, respectively. Clinopyroxene and orthopyroxene inclusions occur in large hornblende crystals. Intercumulus phase hornblende, clinopyroxene and orthopyroxene surround plagioclase crystals, forming a heteradcumulate texture. Hornblende constitutes about 15% of the microscopic sections of the foliated, hornblende-bearing gabbro. In the diabase sheeted dyke, small quartz crystals intersperse among other minerals (Fig. 10d). Coarse-grained diabase sheeted dykes display the phyric texture, with a diabase groundmass (Fig. 11a), compared to the fine-grained dykes, which have a diabasic texture (Fig. 11b). Diabasic texture is dominant in the microscopic sections of the diabases. Olivine is minor, and is substituted by serpentine and iddingsite. Clinopyroxene is often substituted with tremolite-actinolite, chlorite and opaque minerals, and plagioclase is substituted by clay minerals. The large crystals in the phyric diabase are often plagioclase and sometimes clinopyroxene.
Selected photomicrographs showing: (a, b) Mesocumulate texture in the Garagoli massive gabbro and foliated gabbro, where clinopyroxene occurs between the plagioclase (b). (c) Heteradcumulate texture in the foliated gabbro, north of Garagoli, in which amphibole poikilitically encloses plagioclase. (d) Quartz diabase, north of Garagoli. Abbreviations as in Figure 9.

Selected photomicrographs showing: (a) Phyric diabase, north of Garagoli. (b) Microcrystalline diabase, north of Garagoli. (c) Wehrlite with heteradcumulate texture. (d) Microgranular texture in plagiogranite. Abbreviations as in Figure 9.

The presence of the heteradcumulate and mesocumulate textures in the gabbros of the study area indicates an open, pervious magma chamber that led to the formation of oikocrysts that poikilitically enclose the cumulate crystals in the heteradcumulate texture, which is characteristic of the cumulate parts of SSZ (Hunter, Reference Hunter and Cawthorn1996; Winter, Reference Winter2001). The granular texture in these rocks is a result of crystal packing during the compaction process. Hunter (Reference Hunter and Cawthorn1996) believed that an adcumulate texture can form as a result of a series of diverse processes, including crystal compaction, interconnectedness, enlargement, recrystallization, dissolution and redeposition, which enhance the compaction process. This adcumulate texture is characteristic of an open magmatic system that is common in the SSZ ophiolites (Hunter, Reference Hunter and Cawthorn1996; Winter, Reference Winter2001).
The wehrlite and olivine websterite intrusions have a heteradcumulate texture, showing enclosure of the cumulate olivine by diopside (Fig. 11c). Under the microscope, samples from the wehrlitic intrusion show olivine and clinopyroxene and minor orthopyroxene. Based on the abundance and type of pyroxenes, the wehrlitic intrusion can also be classified as olivine websterite. In some thin-sections, olivine is altered into serpentine, leaving only a small amount of the original mineral in a mesh texture. Clinopyroxene is diopside, which, in less altered samples, covers olivine in a heteradcumulate texture, indicating that the formation of olivine preceded that of clinopyroxene. The absence of plagioclase in the wehrlitic intrusions indicates their formation at high pressures. It seems that these rocks formed as a result of late-stage melting of the refractory parts of the mantle wedge above the subducting slab, and for this reason, they contain abundant olivine (Ernewein, Pflumio & Whitechurch, Reference Ernewein, Pflumio, Whitechurch, Boudier and Nicolas1988; Juteau et al. Reference Juteau, Ernewin, Reuber, Whitechurch and Dahl1988; Crawford, Falloon & Green, Reference Crawford, Falloon, Green and Crawford1989; Robinson & Malpas, Reference Robinson, Malpas, Malpas, Moores, Panayiotou and Xenophontos1990). The plagiogranite has a granular to microgranular texture (Fig. 11d) and the individual dykes have a microgabbroic texture and an andesitic-basaltic composition. The microgabbro has intergranular and ophitic textures, and the andesitic-basaltic dykes have phyric to glomeroporphyric textures, with a devitrified or hyalomicrolithic groundmass.
4. Geochemistry
The results of the geochemical analyses are given in Table 1. These data are plotted in the classification, spider and tectonomagmatic diagrams, the interpretations of which constitute the basis for the geochemical discussion in this paper. For the geochemical classification, standard diagrams using major oxides or a mixture of major and minor oxides are used. The geochemical data show that the SiO2 content is 49.6–51.7% in the cumulate and pyroxene gabbro, 47.5–54.7% in the massive gabbro, 57.4–59.1% in the diabase sheeted dykes, and an average of 53.4% in the foliated gabbro (Fig. 12a). In the classification diagram (Middlemost, Reference Middlemost1985), based on a variation of Na2O+K2O v. SiO2 (Fig. 12a), samples of the massive gabbro plot in the gabbro field, and those from the foliated hornblende gabbro and individual diabase dykes plot on the border between gabbro and diorite gabbro. Samples from the diabase sheeted dykes plot in the diorite field, and plagiogranite samples plot in the quartz monzonite and granite fields. For a better comparison, the analytical data are plotted on the Winchester & Floyd (Reference Winchester and Floyd1976) diagram, which uses the Nb/Y minor element ratio (Fig. 12b). According to Pearce (Reference Pearce and Wyman1996), the Nb/Y = 0.7 ratio is the value that separates the alkaline and subalkaline series in volcanic rocks. In this diagram, individual diabase dykes plot in the field of subalkaline basalt. Except for one massive gabbro, which plots in the alkali basalt field, the rest of the massive gabbro samples lie in the fields of subalkaline basalt and andesite-basalt. The foliated hornblende gabbro and diabase sheeted dykes plot in the field of andesite-basalt, and the plagiogranite samples plot in the andesite and rhyodacite-dacite fields (Fig. 12b).
Geochemical data of the major (%) and minor (ppm) elements in the studied samples

Abbreviations: weh – wehrlite, cgb – cumulate gabbro, pgb – pyroxene gabbro, igb – isotropic gabbro, fgb – foliated gabbro, idd – isolated diabase, dia – diabase sheeted dyke complex, plg – plagiogranite.
Classification of the studied samples based on the major and minor elements, using (a) Middlemost (Reference Middlemost1985), (b) Winchester & Floyd (Reference Winchester and Floyd1976), (c) FeOt+MgO against SiO2 plot (Miyashiro, Reference Miyashiro1974) and (d) ternary FeO+Fe2O3, Na2O+K2O, MgO diagram (Irvine & Baragar, Reference Irvine and Baragar1971).

The plot of FeO+MgO against SiO2 (Miyashiro, Reference Miyashiro1974) (Fig. 12c) shows that all the samples plot in the calc-alkaline field. The ternary FeO+Fe2O3, Na2O+K2O, MgO diagram (Irvine & Baragar, Reference Irvine and Baragar1971) (Fig. 12d) allows us to discriminate between the tholeiitic and calc-alkaline magmatic series. The analyzed samples show a calc-alkaline and tholeiitic affinity when plotted on this diagram.
Figure 12c, d shows the results of the geochemical analysis applying the magmatic series discrimination diagrams described below. Spider diagrams reveal important information about magmatic processes such as differentiation and enrichment or depletion of elements, by normalizing the analytical values to those of standard global values. In this paper, the geochemical data are normalized to the values of primitive mantle and chondrite (Sun & McDonough, Reference Sun, McDonough, Saunders and Norry1989) (Figs 13, 14). The REEs in the wehrlite are normalized to the standard chondrite and primitive mantle. The REE pattern in the wehrlite shows depletion in La to Pr, and a 6–30 times linear enrichment from Pr to Lu. These patterns represent low REE values, which may indicate partial melting of a depleted source (Fig. 13a, b).
Spider diagrams of the analyzed samples normalized to the standard values of chondrite and primitive mantle (Sun & McDonough, Reference Sun, McDonough, Saunders and Norry1989). See text for explanation.

Spider diagrams of the analyzed samples normalized to the standard values of chondrite and primitive mantle (Sun & McDonough, Reference Sun, McDonough, Saunders and Norry1989). In (a), the fields for the average fore-arc and back-arc are drawn using data from Nicholson, Black & Picard (Reference Nicholson, Black and Picard2000). See text for explanation.

The patterns of the REEs of the cumulate and pyroxene gabbro, normalized to the standard chondrite (Sun & McDonough, Reference Sun, McDonough, Saunders and Norry1989), show a gentle, positive slope of enrichment between La and Sm, and a linear, insignificant slope between Sm and Lu (Fig. 13c). These REE patterns, which vary about four times for the LREEs and five times for the MREEs and HREEs, are similar to the N-MORB patterns at lower levels. Although the cumulate gabbro crystallizes under crystal-mesh conditions, and therefore the concentrations of the REEs are not the same as those in the magma and even in the medium-seated rocks, given the position of the REE patterns of gabbro at low levels, it may be expected that the mantle sources for these rocks were depleted. The REE pattern for pyroxene gabbro lies at a higher level compared to that of the olivine gabbro, probably owing to differentiation.
Patterns of the cumulate and pyroxene gabbro, normalized to the minor and REEs of the standard primitive mantle (Sun & McDonough, Reference Sun, McDonough, Saunders and Norry1989), show enrichment in Ba, Th, U and Nd, depletion in La, Ce and Zr, and a linear (horizontal) trend between Sm and Lu (Fig. 13d). Depletion in Ti cannot be seen, indicating that the differentiation and crystallization of the Fe and Ti oxides did not affect the petrogenesis of these rocks (Kocak et al. Reference Kocak, Isıka, Arslanb and Zedef2005).
The REE patterns of the massive and foliated hornblende gabbro, normalized to the standard values of chondrite (Sun & McDonough, Reference Sun, McDonough, Saunders and Norry1989), show enrichment, from 2.5 times to 15 times for the LREEs, and three times to eight times for the HREEs. Except for the Ce depletion, the patterns show a linear variation. Only one massive gabbro sample shows enrichment in the LREEs greater even than the average transitional MORB (T-MORB) field; the rest of the patterns plot in the lower average N-MORB field (Fig. 13e). The enrichment in the LREEs in this pattern, as much as around 100 times, can indicate an enriched mantle source. The enrichment in La in some samples may suggest the presence of garnet in the source (Kocak et al. Reference Kocak, Isıka, Arslanb and Zedef2005). The depletion of Ce relative to La in a few samples may be explained by taking the effect of sea water into account (Hole et al. Reference Hole, Saunders, Marriner and Tarney1984; Saunders & Tarney, Reference Saunders, Tarney, Kokelaar and Howells1984). The linear trend of the massive gabbro may be explained by considering the concentration of the MREEs and HREEs in amphiboles (Kocak et al. Reference Kocak, Isıka, Arslanb and Zedef2005) and the abundance of green hornblende in gabbro.
The spider diagrams of the isotropic gabbro samples, normalized to the chondrite values, reveal three types of pattern. The first shows enrichment relative to the T-MORB values, which may be related to mantle plumes or a garnet-bearing peridotite source. The other two types show ten times and two times enrichments, probably owing to variable degrees of partial melting of peridotite sources or variable enrichment of these sources, which are typical of the SSZ environments (Dilek et al. Reference Dilek, Dilek and Robinson2003; Martinez & Taylor, Reference Martinez and Taylor2002; Stern et al. Reference Stern, Kohut, Bloomer, Leybourne, Fouch and Vervoot2006; Ishikawa et al. Reference Ishikawa, Kaneko, Kadarusman and Ota2007; Tian et al. Reference Tian, Castillo, Hawkins, Hilton, Hanan and Piatruszka2008; Juteau & Maury, Reference Juteau and Maury2009). The REE patterns of the massive and foliated gabbro, normalized relative to the values in the standard primitive mantle (Sun & McDonough, Reference Sun, McDonough, Saunders and Norry1989), show enrichment in La in a few samples, and Sr and U in all samples. A depletion in Zr (one sample) and slight depletion in Nb (two samples) can be seen (Fig. 13e). Except for one sample, taken from the massive gabbro, the pattern resembles that of ocean island basalt (OIB), showing a negative slope from the incompatible to the compatible elements. In this pattern, the lower concentrations of the high-field-strength elements (HFSEs) and higher concentration of the large ion lithophile elements (LILEs) relative to those in MORB, can indicate a source of enriched mantle or a mantle plume (Juteau & Maury, Reference Juteau and Maury2009).
The fact that only two isotropic gabbro samples reveal a slight Nb depletion in their spider diagram patterns, normalized to the primitive mantle (Sun & McDonough, Reference Sun, McDonough, Saunders and Norry1989), and the rest of the samples show linear MORB-like patterns, may be explained by the partial melting of their spinel-bearing peridotite source (Y. Lagabrielle, unpub. Ph.D. thesis, Univ. Bretagne Occidentale, Brest, 1987). Laboratory work by Lin, Stern & Bloomer (Reference Lin, Stern and Bloomer1989) has shown that intermittent partial melting of a spinel-bearing peridotite may produce magmas with variable, but linear enrichments. The clear Nb depletion, relative to La and Ce on one side and Th on the other, on chondrite- and primitive mantle-normalized spider diagram patterns of the diabase and plagiogranite samples (Fig. 14), are similar to those identified in the patterns of samples taken from ophiolites in other parts of the world, which have been interpreted to have formed in SSZ environments (Dilek et al. Reference Dilek, Dilek and Robinson2003; Martinez & Taylor, Reference Martinez and Taylor2002; Stern et al. Reference Stern, Kohut, Bloomer, Leybourne, Fouch and Vervoot2006; Ishikawa et al. Reference Ishikawa, Kaneko, Kadarusman and Ota2007; Tian et al. Reference Tian, Castillo, Hawkins, Hilton, Hanan and Piatruszka2008; Juteau & Mury, Reference Juteau and Maury2009).
The geochemical composition of the diabase sheeted dykes provides more effective clues about the geotectonic setting of an ophiolite complex than that of its gabbro and basalt (Nicolas, Reference Nicolas1989). The REE patterns of the diabase sheeted dykes, normalized to the standard values of chondrite (Sun & McDonough, Reference Sun, McDonough, Saunders and Norry1989), are almost flat, with a minor LREE enrichment compared to the HREEs (Fig. 14a). The fields for the average fore-arc and back-arc are drawn using data from Nicholson, Black & Pickard (Reference Nicholson, Black and Picard2000). These patterns plot at a higher, enriched level than the REE patterns of the cumulate, massive and foliated gabbros, with the LILE concentrations more enriched than the N-MORB, similar to island arc tholeiite (IAT) patterns (Alabaster, Pearce & Malpas, Reference Alabaster, Pearce and Malpas1982). The abundance of REEs in these samples is about 20 times chondrite for the LREEs and reaches, with a gentle negative slope, about five times chondrite for the HREEs. The higher LREE concentrations, relative to the HREEs, are related to the narrow basins that form above the subduction zone (Saunders & Tarny, Reference Saunders, Tarney, Kokelaar and Howells1984). The higher enriched position of the REE patterns of the diabase sheeted dykes, relative to those of the other units of the Bagjer and Garagoli crustal sequence, also supports the idea that these rocks formed through differentiation. The lower concentrations of the HFSEs and higher concentrations of the LILEs relative to MORB probably indicate a depleted mantle source (Taylor & Martinez, Reference Taylor and Martinez2003; Srivastava, Chandra & Shastry, Reference Srivastava, Chandra and Shastry2004).
The REE patterns of the individual diabase dykes, normalized to the standard values of chondrite (Sun & McDonough, Reference Sun, McDonough, Saunders and Norry1989), are enriched in La (Fig. 14a), and like those of the massive and foliated gabbro plot lower than the patterns of the N-MORB. The Eu enrichment and Ce depletion observed in these patterns are explained above for the case of massive and foliated gabbro. The minor and REE patterns for the diabase sheeted dyke complex and individual diabase dykes, normalized to the standard values of the primitive mantle (Sun & McDonough, Reference Sun, McDonough, Saunders and Norry1989), show a small enrichment in the LILEs of Sr, U, La and Th, and depletion in the HFSEs such as Zr (only in individual diabasic dykes) and Nb (Fig. 14b). The patterns for the HFSEs show a general depletion compared to the N-MORB composition. The depletion of Nb and Zr in individual diabasic dykes and enrichment of U indicate partial melting of the source magma from the mantle wedge, which is variably enriched by the fluids originating from the subducting plate and different degrees of partial melting (Hopper & Smith, Reference Hopper and Smith1996; Elliot et al. Reference Elliott, Plank, Zindler, White and Bourdon1997; Yunpeng & Bingquan, Reference Yunpeng and Bingquan2000; Chung et al. Reference Chung, Wang, Crawford, Kamenetsty, Chen, Lan and Chen2001; Kelemen, Hanghoj & Greene, Reference Kelemen, Hanghoj and Greene2004; Stern et al. Reference Stern, Kohut, Bloomer, Leybourne, Fouch and Vervoot2006; Ishikawa et al. Reference Ishikawa, Kaneko, Kadarusman and Ota2007; Tian et al. Reference Tian, Castillo, Hawkins, Hilton, Hanan and Piatruszka2008).
The REE patterns of the plagiogranite samples, normalized to the standard values of chondrite (Sun & McDonough, Reference Sun, McDonough, Saunders and Norry1989), are linear, and lie in the average T-MORB field (Fig. 14c). The Eu depletion is observed in only one sample, which can be explained with magmatic differentiation and separation of plagioclase. The minor and REEs for the plagiogranite, normalized to the primitive mantle standard values (Sun & McDonough, Reference Sun, McDonough, Saunders and Norry1989), show a clear depletion in Nb and Ti. The scatter in the Rb and Ba values may be explained by the effect of fluids and alteration (Fig. 14d).
As a general conclusion, based on the interpretation of the spider diagrams, it can be said that the depletion in Nb in the patterns of the diabase and plagiogranite, and the slight depletion in Nb in a few patterns of the samples of massive gabbro, are similar to those of the tholeiitic and andesitic basalt of island arcs (Parlak, Hock & Deloye, Reference Parlak, Hock, Delaloye, Bozkurt, Winchester and Piper2000). The variable enrichment of the LILEs, such as U, and depletion in Nb and Zr could be related to variable degrees of partial melting of the mantle wedge and the effects of different fluids emanating from the underlying subducting slab (Yunpeng & Bingquan, Reference Yunpeng and Bingquan2000; Chung et al. Reference Chung, Wang, Crawford, Kamenetsty, Chen, Lan and Chen2001; Taylor & Martinez, Reference Taylor and Martinez2003; Stern et al. Reference Stern, Kohut, Bloomer, Leybourne, Fouch and Vervoot2006; Ishikawa et al. Reference Ishikawa, Kaneko, Kadarusman and Ota2007; Tian et al. Reference Tian, Castillo, Hawkins, Hilton, Hanan and Piatruszka2008). Experimental investigations also suggest enrichment of the above-mentioned elements through fluids that originate from the subducting plate (Ayers, Reference Ayers1998; Chung et al. Reference Chung, Wang, Crawford, Kamenetsty, Chen, Lan and Chen2001). Moreover, the depletion of some of the HFSEs such as Nb, and their lower values compared to MORB, can be correlated with those of island arc magmas (McChulloch & Gamble, Reference McCulloch and Gamble1991; Pearce & Peate, Reference Pearce and Peate1995), indicating that the elements have been preserved through the processes of differentiation and partial melting of the subducting oceanic slab (Pearce, Reference Pearce and Wyman1996). In subduction environments, the minor refractory phases, such as ilmenite and rutile, are stable in the subducting slab and, as a result, the HFSEs such as Nb, Zr and Ti are preserved, leading to their depletion in the magma that forms as a result of partial melting of the subducting slab (Bogoch, Avigad & Weissbrod, Reference Bogoch, Avigad and Weissbrod2002; Nagudi, Koberl & Kurat, Reference Nagudi, Koberl and Kurat2003).
5. Tectonomagmatic setting
Serri (Reference Serri1981) divided the ophiolitic cumulate gabbro into the high-Ti field (corresponding with mid-ocean ridges) and low-Ti field (corresponding with island arcs) based on the variation of TiO2 relative to the FeOt/(FeOt+MgO) ratio. Except for two samples taken from the massive gabbro, rocks from the Sabzevar crustal sequence lie in the low-Ti ophiolite field or on its border with the high-Ti ophiolite field on the TiO2 v. FeOt/(FeOt+MgO) diagram (Fig. 15a).
The position of the analyzed samples in various tectonomagmatic diagrams. See text for explanation.

Figure 15b shows the distribution of the geochemical data on the Na2O+K2O, MgO, FeOt ternary diagram (Beard, Reference Beard1986). Samples from the massive gabbro plot in the arc-related mafic cumulate field, and those of the diabase sheeted dykes plot in the arc-related non-cumulate gabbro and diorite field, all corresponding with the petrographic characteristics observed in these samples. The geochemical distributions of most of these data points correspond with the fields for island arc magmas or the border areas of these fields. Figure 15c shows the distribution of the data points on the V v. Ti/1000 diagram (Shervais, Reference Shervais1982), on which the Miyashita, Adachi & Umino (Reference Miyashita, Adachi and Umino2003) tectonomagmatic fields are also shown. Samples from the massive gabbro and foliated hornblende gabbro plot in the IAT field on this diagram. The samples from the diabase sheeted and individual dykes, and one sample from the massive gabbro, plot in the MORB field (Fig. 15c). Such a diagram, when used for ophiolites with known origin, reveals that the geochemical data of SSZ ophiolites, such as Zambales in the Philippines, plot in the IAT or MORB fields (Yumul, Reference Yumul1996).
The fields for calc-alkaline basalt (CAB), IAT, ocean island arcs (OIA), MORB and oceanic island tholeiite (OIT) can be distinguished on the MnO*10–TiO2–P2O5 major oxides ternary diagram (Mullen, Reference Mullen1983) (Fig. 15d). Samples of the massive gabbro plot in the fields of IAT and CAB on this diagram, and those of the diabase sheeted dykes plot in the IAT field. The fields of the island arc, oceanic floor, calc-alkaline and within-plate basalts are distinguished on the Ti/100–Zr–Y*3 ternary diagram (Pearce & Cann, Reference Pearce and Cann1973). Most of the samples of the massive gabbro plot in the island arc field, and those of the diabase sheeted dykes plot in ocean floor field on this diagram (Fig. 15e). The Th–Hf/3–Nb/16 ternary diagram (Wood, Reference Wood1980) is used to distinguish the N-MORB, E-MORB, OIB and island arc basalts from each other. Except for one massive gabbro sample, which plots in the OIB field, all samples plot in the island arc basalt field (Fig. 15f).
The investigation of the tectonomagmatic diagrams reveals the compositional diversity of the sampled rocks. The low titanium content of the crustal sequence (Fig. 15a), the position of these rocks in the cumulate and non-cumulate ultramafic and mafic island arc field (Fig. 15b), and the scatter of the data points in the MORB and IAT fields (Fig. 15c, d), suggest that the crustal sequence in the Bagjer–Garagoli and south Soleymanieh areas formed in a subduction zone, or more specifically, a supra-subduction zone (Juteau & Maury, Reference Juteau and Maury2009; Parlak, Hock & Deloye, Reference Parlak, Hock, Delaloye, Bozkurt, Winchester and Piper2000).
6. Discussion and conclusions
The following conclusions may be drawn based on the geological, petrological and tectonomagmatic data presented in this paper. The studied area, located northeast of Sabzevar, is part of the Sabzevar ophiolite belt, which is exposed along the Meyamey Fault that marks the contact between the Central Iran micro-continent and the Alborz–Binalud structural zone. The ophiolite belt includes the mantle and crustal sequences, and a volcanic-sedimentary-volcaniclastic sequence, of which the plutonic crustal sequence is investigated in this paper. The plutonic, crustal sequence includes cumulate, massive and istotropic gabbro and a diabase sheeted dyke complex, which are cut by wehrlite and plagiogranite intrusions and individual micrograbbroic, diabasic and andesitic dykes. The plutonic, crustal sequence constitutes tectonic slices that have thrust over serpentinized peridotite south of Garagoli village, and are thrust over by peridotite north of Bagjer village.
Assuming that the banding in the layered gabbro forms perpendicular to the mid-ocean ridge, and that the diabase sheeted dykes, wehrlite intrusions and plagiogranite dykes form parallel to the ridge, the orientation data of these features suggest an E–W opening north of Garagoli village, and a N–S opening south of the Soleymanieh village. However, it is also possible that the orientations in the Soleymanieh area were rotated by transform or younger faults during emplacement of the ophiolite. Drawing a definite conclusion about the direction of the opening across the mid-ocean ridge in the Sabzevar ophiolite requires taking extensive structural measurement of foliation and lineation in the area between the town of Fariman, in the eastern part of the belt, and the village of Abbasabad in the west.
Palaeontological study of the pelagic limestone, intercalated with pillow lavas, hyaloclastite and hyaloclastic breccia with carbonate cement, gives a Late Cretaceous (Maastrichtian – Late Maastrichtian) age for these rocks and the ophiolite. The presence of isotropic and layered gabbro with cumulate characteristics, the widespread nature of the diabase sheeted dyke complex, the occurrence of wehrlite intrusions and veinlets and dykes of plagiogranite, and the harzburgitic to clinopyroxene harzburgitic composition of the plutonic, crustal sequence, all suggest that the sequence, and probably the Sabzevar ophiolite belt as a whole, formed with a fast spreading rate during the Late Cretaceous. The ‘olivine → plagioclase → clinopyroxene → ± orthopyroxene → amphibole’, and ‘olivine → clinopyroxene → ± orthopyroxene → plagioclase → amphibole’ orders of mineralization in the cumulate olivine gabbro represent crystallization in a mid-ocean ridge and SSZ, respectively. The heteradcumulate and mesocumulate textures in the gabbros suggest the presence of an open and porous magma chamber, typical of the SSZ environment. The heteradcumulate texture, which is dominant in the wehrlite intrusions in which plagioclase did not form, suggests crystallization in subduction zones. It seems that these rocks formed as a result of late-stage melting of the refractory parts of the mantle wedge above the subducting slab; which is perhaps the reason why olivine is so abundant in them.
The discrimination diagrams indicate calc-alkaline and tholeiitic affinities for the studied samples. The majority of the samples represent low TiO2 gabbro, suggesting either a heterogeneous harzburgitic source or crystallization under high pressure. The high MgO values in the cumulate gabbro and wehrlite suggest either a high percentage of partial melting in the mantle source or a high magnesium source. The fact that the cumulate gabbro and diabase have the highest and lowest Cr2O3 content, respectively, can be explained by the decrease in the crystallization of clinopyroxene in the diabase. The low amounts of HFSEs, such as Zr, Y and Nb, in some samples with cumulate characteristics, suggest a higher participation of the cumulus minerals compared to the intercumulus liquid. The spider diagram patterns of a significant number of studied samples resemble those of the IAT and andesitic basalts. Variable enrichment, even in insignificant amounts, of the LILEs, e.g. U, and depletion in Nb and Zr, can be attributed to variable degrees of partial melting of the mantle wedge and the effects of the fluids emanating from the underlying, subducting slab. The depletion of some of the HFSEs, such as Nb, in some of the patterns, and their positions at lower levels, in the average MORB field, can be compared with that of volcanic arc magmas. The tectonomagmatic diagrams indicate that most of the samples taken from the plutonic crustal sequence represent the low-Ti series or the border line between the fields of low- and high-Ti series. The positioning of the samples in different fields of the tectonomagmatic diagrams reflects the variability in rock composition. In addition to the low Ti content of most of the studied samples, their positioning in the cumulate ultramafic and mafic fields and non-cumulate arc field, and their distribution between MORB and tholeiitic arc, indicate formation of the plutonic, crustal sequence in relation to subduction and, more specifically, to supra-subduction.
Acknowledgements
We thank Dr Ghasemi and Mr Safar Ali Eshraghi for field logistics, and Ms Zohre Sohrabi for the palaeontological investigation of the thin-sections. We thank Drs Thierry Juteau and Scott Whattam for their thorough and constructive reviews of the original manuscript, which led to significant improvement of the paper.