I. INTRODUCTION
“High-entropy alloys” (HEAs) are among the latest and probably the biggest challenge in contemporary condensed matter physics and materials science. HEAs are a new type of alloys based on multiple principal alloying components (four or more) in near equimolar ratios, molar fractions ≤0.35.Reference Ma, Wang, Zhang and Inoue1–Reference Cantor, Chang, Knight and Vincent4 This design enables research and probable exploitation of a huge number of completely new systems with structures and properties which can hardly be anticipated.Reference Senkov, Miller, Miracle and Woodward5,Reference Miracle6 Thus, this strategy provides an opportunity to greatly advance our fundamental understanding of the behavior of complex alloys. Moreover, several important problems in physics, including the localization of electrons and phonons, various percolation phenomena on different crystal lattices, and the quantitative distinction between the effects of topological and chemical atomic disorder, can be studied effectively using HEAs. As a result, research on HEAs has led to the preparation of several hundred new alloys, publication of well over a thousand research papers, over ten reviews of the literature (e.g., Refs. Reference Miracle6–Reference Wang15), focus-issues on HEAs in scientific journals, and two books,Reference Murty, Jeh and Ranganathan16,Reference Gao, Yeh, Liaw and Zhang17 in just over ten years. The majority of these studies deal with their phase(s), microstructure, and mechanical properties, whereas, so far, their physical properties have received relatively little attention, see, for instance, Chapter 7 of Ref. Reference Gao, Yeh, Liaw and Zhang17, in spite of their potential as functional materials. Especially, puzzling is the near absence of experimental studies of the electronic structures of HEAs and of those properties directly related to the electronic structure. In particular, only four studies of their “low-temperature specific heat” (LTSH) have been reported so farReference Biljaković, Remenyi, Figueroa, Ristić, Pajić, Kuršumović, Starešinić, Zadro and Babić18–Reference Koželj, Vrtnik, Jelen, Jazbec, Jagličić, Maiti, Feuerbacher, Steurer and Dolinšek21 and the first “angle-resolved photoemission spectroscopy” studies have been performed by us recently.Reference Babić, Biljaković, Figueroa, Kuršumović, Mikšić Trontl, Pajić, Pervan, Remenyi, Ristić and Starešinić22 Theoretical studies of the electronic structure of HEAs, although more abundant than experimental ones, are still insufficient and with a few notable exceptions (e.g., Refs. Reference Zhang, Stocks, Jin, Lu, Bei, Sales, Wang, Béland, Stoller, Samolyuk, Caro, Caro and Weber23–Reference Gao, Gao, Hawk, Ouyang, Alman and Widom27) are mainly focused on the phases of stability and mechanical properties (see for instance, Chapters 8–11 of Ref. Reference Gao, Yeh, Liaw and Zhang17). Almost all HEAs studied so far are metallic alloys in which the itinerant electrons provide a large contribution to the cohesive energy, which renders almost all their properties very sensitive to the electronic structure, e.g., Ref. Reference Ristić, Zadro, Pajić, Figueroa and Babić28 and references therein. So the scarcity of experimental studies of their electronic structures is quite surprising.
The truly multidisciplinary aspect of HEAs, involving researchers from theoretical physics to engineering, has enabled both the breadth and rapid expansion of research on HEAs. Large research efforts in the studies of phases, microstructures, and mechanical properties resulted in a wealth of data confirming the conceptual and technological importance of HEAs.Reference Miracle6–Reference Gao, Yeh, Liaw and Zhang17 In particular, HEAs with ultra-high strength and fracture toughness,Reference Gludovatz, Hohenwarter, Catoor, Chang, George and Ritchie29 outstanding mechanical properties at high temperatures, excellent soft magnetic properties, high fatigue, wear corrosion and irradiation resistance, new biomaterials,Reference Todai, Nagase, Hori, Matsugaki, Sekita and Nakano30 and diffusion barriers were recently developed.Reference Miracle and Senkov14,Reference Gao, Yeh, Liaw and Zhang17 An important feature of HEAs is the simplicity of tuning their properties by adjusting their composition and/or phase content. However, the conceptual understanding of their phases, stability, and properties is still insufficient. In particular, several semi-empirical criteria for the formation of different phases: single phase solid solution, intermetallic compounds, a mixture of intermetallic compounds and solid solutions, and an amorphous phase (a-HEA)Reference Miracle6–Reference Gao, Yeh, Liaw and Zhang17,Reference Zhang, Zhou, Lin, Chen and Liaw31 have been used to predict hundreds of solid solution HEAs.Reference Gao, Yeh, Liaw and Zhang17,Reference Troparevsky, Morris, Kent, Lupini and Stocks32,Reference King, Middleburgh, McGregor and Cortie33 However, so far only a few dozen stable solid solution HEAs have been confirmed by experiment (Chapter 11 of Ref. Reference Gao, Yeh, Liaw and Zhang17). Part of the problem is that the phases of HEA depend not only on composition but also on preparation and the post-processing conditions. This clearly makes it difficult to judge the success of both semi-empirical and theoretical (e.g., Ref. Reference Miracle and Senkov14 and Chapters 8–12 of Ref. Reference Gao, Yeh, Liaw and Zhang17) predictions of phases of HEAs and it also strongly affects their measured properties.
Therefore, in spite of enormous progress made in almost all aspects of research and conceptual understanding, there is still ample space for important contributions to experimental research on the relationship between their electronic structure, atomic structure, and properties, which has been hardly studied so far, and is crucial for deeper conceptual understanding. Furthermore, the studies of HEAs based on the iron group of 3d-transition metals (with the addition of Al, Nb, Sn, and metalloids) are by far the most abundant, followed by more recent studies of alloys based on refractory metals, RHEA, and a small number of studies of other alloys such as those containing “rare-earth metals”, noble and normal metals, and light elements.Reference Miracle and Senkov14,Reference Gao, Yeh, Liaw and Zhang17 There are only a few studies of HEAs based on combinations of late 3d and refractory/early transition metals in spite of the fact that in such systems, the transitions from a-HEA to simple solid solution HEA, which are conceptually very important, have been reported (e.g., Ref. Reference Biljaković, Remenyi, Figueroa, Ristić, Pajić, Kuršumović, Starešinić, Zadro and Babić18 and Chapter 13 of Ref. Reference Gao, Yeh, Liaw and Zhang17). Indeed, until recently a-HEAs received relatively little attentionReference Wang15,Reference Biljaković, Remenyi, Figueroa, Ristić, Pajić, Kuršumović, Starešinić, Zadro and Babić18 in spite of the fact that they were the first applications of a new alloy designReference Ma, Wang, Zhang and Inoue1,Reference Cantor, Kim and Warren2 and are of crucial importance for the understanding of some features specific to disorder, such as the boson peak (BP).Reference Biljaković, Remenyi, Figueroa, Ristić, Pajić, Kuršumović, Starešinić, Zadro and Babić18 This was probably due to fact that the prediction of “high-entropy bulk metallic glasses” (HE-BMGs) is probably even more difficult than for conventional binary and multicomponent alloys. Furthermore, the critical thickness of HE-BMGs is generally lower than that of conventional BMGs.Reference Wang15 More recently, the situation has started to change and several studies showing the conceptual and technological relevance of a-HEAs appeared.Reference Biljaković, Remenyi, Figueroa, Ristić, Pajić, Kuršumović, Starešinić, Zadro and Babić18,Reference Wang, Inoue, Kong, Han, Zhu, Shalaan and Al-Marouki34–Reference Figueroa, Ristić, Kuršumović, Biljaković, Starešinić, Pajić, Remenyi and Babić36
Our previousReference Biljaković, Remenyi, Figueroa, Ristić, Pajić, Kuršumović, Starešinić, Zadro and Babić18,Reference Figueroa, Ristić, Kuršumović, Biljaković, Starešinić, Pajić, Remenyi and Babić36,Reference Cunliffe, Plummer, Figueroa and Todd37 and current work on HEAs is focused on three conceptually important problems in contemporary research on HEAs:
(i) The relationship between the electronic structure, atomic structure, and the intrinsic properties of HEAs.
(ii) The nature and influence of the transition from HEAs to conventional alloys of the same metals, based on one, or at most two, principal alloying components.
(iii) The quantitative disentanglement of the effects of structural/topological and chemical disorder by using the same alloy subjected to different preparation or post-processing treatments.
According to a previous report,Reference Cunliffe, Plummer, Figueroa and Todd37 the (TiZrNbCu)1−xNix (x ≤ 0.25) a-HEA system seemed suitable for the study of both problems (1) and (3). Amorphous alloys are suitable for studying (1) because they have a single homogeneous phase and relatively simple electronic structure. In addition, electronic structure and electronic structure–property relations in binary and ternary amorphous alloys of the early (TE) and late (TL) transition metals were found to be particularly simple (e.g., Refs. Reference Ristić, Zadro, Pajić, Figueroa and Babić28 and Reference Ristić, Cooper, Zadro, Pajić, Ivkov and Babić38 and references therein). Furthermore, it was necessary to check whether the HEA design makes some fundamental change to the electronic structure and electronic structure–property relationships or not. Amorphous alloys, especially of the TE–TL type, are also suitable for the study of problem (2), namely, the transition from HEA to conventional alloys in the same alloy system and without a change of the amorphous phase owing to their broad “glass forming composition range” (GFR). As regards problem (3), it was reportedReference Cunliffe, Plummer, Figueroa and Todd37 that in these alloys, depending on the preparation method for instance the cooling rate from the melt, either a- or crystalline alloys with a body-centered cubic (bcc) phase can be obtained, which makes them suitable for disentangling the contributions of topological and chemical disorder to their electronic structure and physical properties.
Here, we present the first experimental study to our knowledge of the atomic structure–electronic structure–property relationship in an a-HEA alloy system: (TiZrNbCu)1−xNix (x ≤ 0.5) for x in both the HEA and Ni-rich (x ≥ 0.35) concentration range, thus covering problems (1) and (2). Variations of both atomic structure and electronic structure with x show a pronounced change for x ≥ 0.35 which is reflected in all properties studied, namely thermal stability parameters, Debye temperatures, BPs, magnetic, elastic, and electronic transport properties all show changes in their concentration dependence for x ≥ 0.35. The results are compared with those for binary and ternary metallic glasses (MGs) of the same elements. We also made numerous attempts to prepare crystalline solid solution HEAs (see Sec. II) with x = 0.125 and 0.15, but without success.
II. EXPERIMENTAL
The ingots of seven alloys in the (TiZrNbCu)1−xNix system with x = 0, 0.125, 0.15, 0.20, 0.25, 0.35, and 0.5 were prepared from high purity elements (≥99.98%) by arc melting in high purity argon in the presence of a Ti getter. The ingots were flipped and remelted five times to ensure good mixing of components. Ribbons with a thickness of about 20 µm were fabricated by melt spinning molten alloys on the surface of a copper roller rotating at a speed of 25 m/s in a pure He atmosphere [18.36]. Casting with controlled parameters resulted in ribbons with closely similar cross sections (∼2 × 0.02 mm2) and thus for x ≥ 0.125 with amorphous phases having a similar degree of quenched-in disorder. Molten alloys with x = 0.125 and 0.15 were also suction-cast into a water-cooled conical die with a length of 50 mm and base diameter of 8 mm to determine the cooling-rate dependence of the precipitated phase(s) and their contents. (We hoped to find out the conditions for the reported transition from a-HEA to solid solution-HEA with the bcc crystalline structure.Reference Cunliffe, Plummer, Figueroa and Todd37) The as-cast samples were investigated by (i) XRD using a Bruker Advance powder diffractometer with a Cu Kα source (Bruker Corporation, Billerica, Massachusetts), (ii) scanning electron microscopy (SEM) using a JEOL ISM7600F microscope with energy-dispersive spectrometry (EDS) capability (JEOL, Ltd., Tokyo, Japan), and (iii) differential thermal analysis (DTA) and differential scanning calorimetry (DSC) using a Thermal Analysis-DSC-TGA instrument (TA Instruments, Inc., New Castle, Delaware). XRD measurements were also performed on crystallized ribbons with x = 0.125 and 0.15, in an attempt to verify the reported transition from a-HEA to solid solution-HEA.Reference Cunliffe, Plummer, Figueroa and Todd37 These ribbons were annealed in a pure argon atmosphereReference Ristić, Zadro, Pajić, Figueroa and Babić28 for different times (10–60 min) at several temperatures within the temperature range of the first crystallization maximumReference Figueroa, Ristić, Kuršumović, Biljaković, Starešinić, Pajić, Remenyi and Babić36 in the corresponding DSC traces (773–847 K). The atomic structure of the as-cast samples was also studied using “Synchrotron X-ray powder diffraction” (SXPD) measurements at the I12-JEEP beamlineReference Drakopoulos, Connolley, Reinhard, Atwood, Magdysyuk, Vo, Hart, Connor, Humphreys, Howell, Davies, Hill, Wilkin, Pedersen, Foster, De Maio, Basham, Yuan and Wanelik39 at the Diamond Light Source Ltd., Didcot, United Kingdom. A piece of a sample ribbon was illuminated with a monochromatic beam of 0.1545 Å wavelength and 0.5 × 0.5 mm2 size for a total time of 240 s. After every sample measurement, the air scattering signal was measured under the same experimental conditions. X-ray radiation of high energy (80.245 keV) was used to cover high Q values of up to 18 Å−1 in reciprocal space, giving information about the atomic pair distribution functions of the as-prepared (TiZrNbCu)1−xNix alloys. All diffraction experiments were carried out in the transmission mode using a flat-panel Pixium RF4343 detector (Thales Group, Vélizy Villacoublay, France). Precise energy calibration was achieved by collecting diffraction data from a fine powder of CeO2, obtained from NIST, at various standard-to-detector distances. The whole calibration procedure and integration of the two-dimensional X-ray diffraction patterns were performed using DAWN software package.Reference Filik, Ashton, Chang, Chater, Day, Drakopoulos, Gerring, Hart, Magdysyuk, Michalik, Smith, Tang, Terrill, Wharmby and Wilhelmet40
Thermal measurements were performed with a ramp rate of 20 K/min up to 1550 K. The DTA equipment is regularly calibrated using strontium carbonate and gold standards. This procedure keeps the uncertainty in temperatures derived from DSC-DTA measurements to within ±5 K. The valence-band structure of the as-cast samples was studied with photoemission spectroscopy (PES) performed in an ultra-high vacuum chamber equipped with a Scienta SES100 hemispherical electron analyzer [Scienta Omicron (former VG Scienta), Uppsala, Sweden]. The overall energy resolution in the experiments was 25 meV. An unpolarized photon beam of 21.2 eV was generated by a He-discharge ultraviolet source. The samples were cleaned by several cycles of sputtering with 2 keV Ar+ ions at room temperature to remove oxygen and other contaminants from the surface. The base pressure during the experiments was below 10−9 mbar. Photoemission measurements were also performed on a sample of the alloy with x = 0.125 that had been crystallized in situ by holding it at 810 K for 30 min. The as-cast ribbons were also used for measurements of the LTSH, magnetic susceptibility, and mass density D.Reference Biljaković, Remenyi, Figueroa, Ristić, Pajić, Kuršumović, Starešinić, Zadro and Babić18 LTSH measurements were performed in the temperature range 1.8–300 K using a physical property measurement system, Model 6000 from Quantum Design Inc. (San Diego, California).Reference Biljaković, Remenyi, Figueroa, Ristić, Pajić, Kuršumović, Starešinić, Zadro and Babić18,Reference Remenyi, Biljaković, Starešinić, Dominko, Ristić, Babić, Figueroa and Davies41 The magnetic susceptibility of all the as-cast and some crystallized samples was measured with a Quantum Design magnetometer, MPMS5, in a magnetic field B up to 5.5 T and temperature range 5–300 K.Reference Biljaković, Remenyi, Figueroa, Ristić, Pajić, Kuršumović, Starešinić, Zadro and Babić18,Reference Ristić, Zadro, Pajić, Figueroa and Babić28,Reference Figueroa, Ristić, Kuršumović, Biljaković, Starešinić, Pajić, Remenyi and Babić36,Reference Ristić, Cooper, Zadro, Pajić, Ivkov and Babić38 Since the magnetic susceptibility of all the samples showed a very weak dependence on temperature, as is usual in MGs and compounds of TE and TL metals,Reference Biljaković, Remenyi, Figueroa, Ristić, Pajić, Kuršumović, Starešinić, Zadro and Babić18,Reference Ristić, Zadro, Pajić, Figueroa and Babić28,Reference Ristić, Cooper, Zadro, Pajić, Ivkov and Babić38 in the following analysis, we will use their room temperature values. The Young’s modulus, E, calculated from the relationship E = Dv 2, where v is the velocity of ultrasonic waves along the ribbon, was measured both on the as-cast ribbons and the same ribbons relaxed for a short time close to the glass transition temperature of a given alloy.Reference Biljaković, Remenyi, Figueroa, Ristić, Pajić, Kuršumović, Starešinić, Zadro and Babić18,Reference Figueroa, Ristić, Kuršumović, Biljaković, Starešinić, Pajić, Remenyi and Babić36,Reference Ristić, Cooper, Zadro, Pajić, Ivkov and Babić38
III. RESULTS AND DISCUSSION
A. Thermophysical parameters and sample characterization
Because of the vast number of HEAs that can be designed from about eighty stable elements,Reference Cantor10,Reference Miracle and Senkov14 searching for conceptually and technologically interesting compositions by trial and error is clearly inadequate. Therefore, as mentioned in Sec. I, several semi-empirical criteria for the formation of different phases: single phase solid solution, intermetallic compounds and a mixture of intermetallic and solid solution phases, and amorphous phase (a-HEA) have been developed.Reference Miracle6–Reference Gao, Yeh, Liaw and Zhang17,Reference Zhang, Zhou, Lin, Chen and Liaw31–Reference King, Middleburgh, McGregor and Cortie33 These criteria are based on thermophysical parameters such as the configurational entropy ΔS conf, the mixing ΔH mix or formation enthalpy ΔH f, the average difference in atomic sizes of the constituents δ (as in the Hume-Rothery and Inoue’s rules, see, e.g., Refs. Reference Guo13 and Reference Biljaković, Remenyi, Figueroa, Ristić, Pajić, Kuršumović, Starešinić, Zadro and Babić18), etc. (see Gao et al.Reference Gao, Zhang, Gao, Zhang, Ouyang, Widom and Hawk42 for an excellent, concise discussion of all semi-empirical criteria and corresponding parameters).
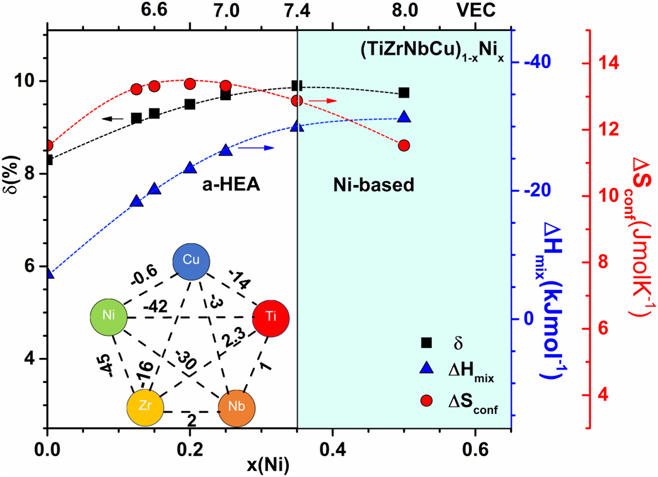
For example, the oldest criterion,Reference Zhang, Zhou, Lin, Chen and Liaw31 a two dimensional ΔH mix (or ΔH f) − δ plot, where δ is the atomic size mismatch, shows how HEAs evolve with increasing δ and decreasing ΔH mix/ΔH f from solid solution HEAs situated in the region with δ ≤ 6.6% and −15 kJ/mol ≤ ΔH mix ≤ −5 kJ/mol to intermetallic and a-HEAs at higher δ and lower or similar ΔH mix.Reference Guo13,Reference Gao, Zhang, Gao, Zhang, Ouyang, Widom and Hawk42 To predict the crystal structure type of solid solution HEAs, the “valence electron concentration” (VEC) criterion was proposed.Reference Sheikh, Mao and Guo43 According to this criterion, a bcc phase forms for VEC ≤ 6.87, a mixture of bcc and face-centered cubic (fcc) phase forms for 6.87 ≤ VEC < 8, and an fcc phase appears for VEC ≥ 8. The expressions for all these criteria and the definitions of the corresponding parameters can be found in reviews of the literatureReference Miracle6–Reference Gao, Yeh, Liaw and Zhang17,Reference Gao, Zhang, Gao, Zhang, Ouyang, Widom and Hawk42 as well as in our previous papers.Reference Biljaković, Remenyi, Figueroa, Ristić, Pajić, Kuršumović, Starešinić, Zadro and Babić18,Reference Figueroa, Ristić, Kuršumović, Biljaković, Starešinić, Pajić, Remenyi and Babić36
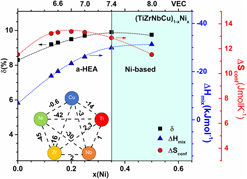
In Fig. 1, we show the variation with concentration x of parameters ΔH mix, δ and ΔS conf of (TiZrNbCu)1−xNix alloys. Here, the HEA region of x is distinguished from the Ni-rich one (x ≥ 0.35) by a different color. As already noted,Reference Biljaković, Remenyi, Figueroa, Ristić, Pajić, Kuršumović, Starešinić, Zadro and Babić18,Reference Figueroa, Ristić, Kuršumović, Biljaković, Starešinić, Pajić, Remenyi and Babić36 the values of the parameters ΔH f (ΔH mix) and δ of all alloys are well outside the ΔH mix − δ region in which solid solution HEA forms. (More recent and sophisticated criteria such as those in Refs. Reference Troparevsky, Morris, Kent, Lupini and Stocks32, Reference King, Middleburgh, McGregor and Cortie33, and Reference Gao, Zhang, Gao, Zhang, Ouyang, Widom and Hawk42 corroborate this conclusion). Regardless of the reliability of ΔH mix − δReference Guo13 and otherReference Troparevsky, Morris, Kent, Lupini and Stocks32,Reference King, Middleburgh, McGregor and Cortie33 criteria, this conclusion is consistent with our difficulties in trying to convert our alloys with low x to solid solution HEAs. Furthermore, the contribution of the ideal ΔS conf to the free energy is considerably smaller than that of enthalpyReference Biljaković, Remenyi, Figueroa, Ristić, Pajić, Kuršumović, Starešinić, Zadro and Babić18,Reference Figueroa, Ristić, Kuršumović, Biljaković, Starešinić, Pajić, Remenyi and Babić36 even at the liquidus temperature T l so that its effect on phase formation may not be large, as was confirmed by XRD patterns and DSC/DTA results.Reference Biljaković, Remenyi, Figueroa, Ristić, Pajić, Kuršumović, Starešinić, Zadro and Babić18,Reference Figueroa, Ristić, Kuršumović, Biljaković, Starešinić, Pajić, Remenyi and Babić36 In particular, all melt-spun ribbons with x > 0 were fully amorphous, whereas their crystalline counterparts, suction cast rods,Reference Cunliffe, Plummer, Figueroa and Todd37 and bulk conical samples were multiphase. The inset of Fig. 1 shows that the strong interatomic bonding between TE and TL components, especially between Zr and Ti with Ni, is responsible for the small overall values of ΔH mix (the values of ΔH mix in the inset are taken from Ref. Reference Troparevsky, Morris, Kent, Lupini and Stocks32). These strong interactions are likely to give rise to “chemical short range order” (CSRO) in the amorphous phaseReference Ristić, Cooper, Zadro, Pajić, Ivkov and Babić38 and intermetallic compounds in the crystalline state.Reference Ristić, Zadro, Pajić, Figueroa and Babić28 Simultaneously, they seem to stabilize amorphous phases since the alloy with x = 0 did not vitrify.Reference Biljaković, Remenyi, Figueroa, Ristić, Pajić, Kuršumović, Starešinić, Zadro and Babić18 Similarly, the difference in atomic radii44 between TE and TL metals is responsible for rather large values of δ which show a maximum at x = 0.35.
Thermophysical parameters of (TiZrNbCu)1−xNix alloys versus x and valence electron count, VEC (upper abscissa). Left scale: atomic size mismatch δ, right scale: mixing enthalpy ΔH mix (first right scale), and configurational entropy ΔS conf (second scale). The inset: ΔH mix between constituent elements.Reference Troparevsky, Morris, Kent, Lupini and Stocks32 Dashed lines are guide for eye.

Since VEC is proportional to x of our alloys, the upper abscissa enables one to follow the variations of the parameters shown in Fig. 1 as a function of VEC. We note that VEC ≤ 7 for x ≤ 0.25 (HEA region) and reaches 8 for x = 0.5 (Ni-rich region). Thus, provided the correlation between VEC and crystal structure of numerous solid solution HEAsReference Gao, Zhang, Gao, Zhang, Ouyang, Widom and Hawk42,Reference Sheikh, Mao and Guo43 also applies to TE–TL type of multicomponent amorphous alloys, the transition from the HEA to Ni-rich concentration range in our alloys could coincide with a change in the “atomic short range order” (SRO), from say bcc-like to mixed bcc–fcc-like and finally to fcc-like. Indeed, an approximate analysis of the first maxima in the XRD patterns of amorphous (TiZrNbCu)1−xNix alloys with x ≤ 0.25 indicated bcc-like local atomic arrangements,Reference Biljaković, Remenyi, Figueroa, Ristić, Pajić, Kuršumović, Starešinić, Zadro and Babić18 whereas a more recent study of the XRD patterns of the alloys with x = 0.35 and 0.5 (Ni-rich concentration region) indicated deviations from the behavior expected for bcc-like atomic arrangements.Reference Figueroa, Ristić, Kuršumović, Biljaković, Starešinić, Pajić, Remenyi and Babić36 In particular, the average lattice parameters a calculated from the XRD patterns by assuming bcc-like local atomic arrangements decreased linearly with x for x ≤ 0.25 (as expected from Vegard’s law) but a showed a strong positive deviation for x ≥ 0.35 (Fig. 2 in Ref. Reference Figueroa, Ristić, Kuršumović, Biljaković, Starešinić, Pajić, Remenyi and Babić36). Before discussing in some detail this unusual finding, we will briefly overview the main results of thermal studies and compositional/homogeneity characterization of our samples (given in more detail in Refs. Reference Biljaković, Remenyi, Figueroa, Ristić, Pajić, Kuršumović, Starešinić, Zadro and Babić18 and Reference Figueroa, Ristić, Kuršumović, Biljaković, Starešinić, Pajić, Remenyi and Babić36).
The detailed description of SEM/EDS studies performed on our as-cast samples in the HEA composition region, which included SEM images and EDS mapping of the distributions of constituent elements, was given in Ref. Reference Biljaković, Remenyi, Figueroa, Ristić, Pajić, Kuršumović, Starešinić, Zadro and Babić18. Briefly, it was found that the EDS compositions were the same as the nominal ones to within ±1–2 at.% and that the distributions of all constituent elements were random down to the submicrometer scale. We note that suction cast rods of (TiZrNbCu)1−xNix alloys,Reference Cunliffe, Plummer, Figueroa and Todd37 having nominally the same compositions as our a-HEAs, solidified to form dendritic microstructure and EDS analysis showed that these dendrites, of size 2–5 µm, consisted mainly of Nb. Indeed, quite often the distribution of constituent elements in HEAs is uneven, and this sometimes occurs even in alloys showing solid solution HEA behavior in their XRD patterns.Reference Pickering and Jones7 We performed the same type of SEM/EDS study on our samples with higher Ni content (x ≥ 0.35). These samples also had a random distribution of constituent elements and their EDS compositions agreed well with nominal ones.Reference Figueroa, Ristić, Kuršumović, Biljaković, Starešinić, Pajić, Remenyi and Babić36
The detailed DSC/DTA study of all the samplesReference Figueroa, Ristić, Kuršumović, Biljaković, Starešinić, Pajić, Remenyi and Babić36 confirmed the XRD results that the as-cast ribbons with x ≥ 0.125 were amorphous and provided their glass transition (T g), crystallization (T x), melting (T m), and liquidus (Tl) temperatures. All alloys showed quite complex crystallization behavior with two distinct exothermic maxima for x ≤ 0.25Reference Figueroa, Ristić, Kuršumović, Biljaković, Starešinić, Pajić, Remenyi and Babić36,Reference Cunliffe, Plummer, Figueroa and Todd37 and three maxima in the Ni-rich alloys.Reference Figueroa, Ristić, Kuršumović, Biljaković, Starešinić, Pajić, Remenyi and Babić36 For the sake of simplicity, we analyzed only the first crystallization event (allegedly associated with the precipitation of a bcc-HEA phase for x ≤ 0.2Reference Cunliffe, Plummer, Figueroa and Todd37) which determines the stability of the amorphous phase and the width of the supercooled liquid region, ΔT x = T x1 − T g. Thermal stability parameters T x1 and T l showed qualitatively the same variations with x, a rapid increase for x ≤ 0.25 and a tendency to saturate in the Ni-rich region (Fig. 4 in Ref. Reference Figueroa, Ristić, Kuršumović, Biljaković, Starešinić, Pajić, Remenyi and Babić36). We note that the observed change in concentration dependence of T x and T l coincides with that in the average lattice parameters of a bcc-like atomic arrangement (Fig. 2 in Ref. Reference Figueroa, Ristić, Kuršumović, Biljaković, Starešinić, Pajić, Remenyi and Babić36). Since T x and T l are associated with the strength of interatomic bonding, it seems that a change in SRO at elevated Ni-contents affects the interatomic bonding too. The enthalpies of crystallization ΔH c1 and the widths of supercooled liquid region ΔT x showed similar variations with x as those of T x1 and T l. In particular, ΔT x increased from about 40 K at low x to about 100 K on the more Ni-rich side. The reduced glass transition temperature T rg (which is frequently employed as a criterion for glass forming ability, e.g., Ref. Reference Ristić, Zadro, Pajić, Figueroa and Babić28) showed a modest magnitude around 0.52 (thus indicating modest GFA) and rather little variation with x (Fig. 2 in Ref. Reference Figueroa, Ristić, Kuršumović, Biljaković, Starešinić, Pajić, Remenyi and Babić36). Since we experienced some difficulties in preparing the fully amorphous alloys with the lowest and the highest Ni-contents and were unable to vitrify the alloy with x = 0, the GFA criteria T rg and ΔT xReference Ristić, Zadro, Pajić, Figueroa and Babić28 may not be applicable to present alloys.Reference Figueroa, Ristić, Kuršumović, Biljaković, Starešinić, Pajić, Remenyi and Babić36
B. Atomic structure
As already noted in Sec. III.A, the XRD patterns of amorphous alloys, in addition to showing the amorphous nature of a particular alloy, can also provide some insight into the local atomic arrangements, the average atomic volumes, and the average atomic packing fractions (APFs) (e.g., Refs. Reference Ristić, Cooper, Zadro, Pajić, Ivkov and Babić38 and Reference Calvayrac, Chevalier, Harmelin and Quivy45). The corresponding procedures were previouslyReference Ristić and Babić46,Reference Ristić and Babić47 used by us to correct the N(E F) of a hypothetical fcc-phase of pure Zr,Reference Bakonyi, Ebert and Liechenstein48 by providing a better estimate for the corresponding atomic volume, and were also used to determine the atomic volume of amorphous copper and the average APFs of amorphous Cu–Hf alloys.Reference Ristić, Cooper, Zadro, Pajić, Ivkov and Babić38 We note that in all these cases, the atomic volumes determined by using XRD patterns agreed quite well with those obtained from the experimental mass-density.Reference Bakonyi49
In particular, from the modulus of the scattering vector k p, corresponding to the first maximum in the XRD pattern,Reference Biljaković, Remenyi, Figueroa, Ristić, Pajić, Kuršumović, Starešinić, Zadro and Babić18,Reference Figueroa, Ristić, Kuršumović, Biljaković, Starešinić, Pajić, Remenyi and Babić36 k p = 4π sin θ/λ (θ is the Bragg angle and λ is the wavelength of the X-ray radiation), one can calculate the average nearest neighbor distanceReference Calvayrac, Chevalier, Harmelin and Quivy45:
 $$d = {{7.73} \over {{k_{\rm{p}}}}}\quad .$$
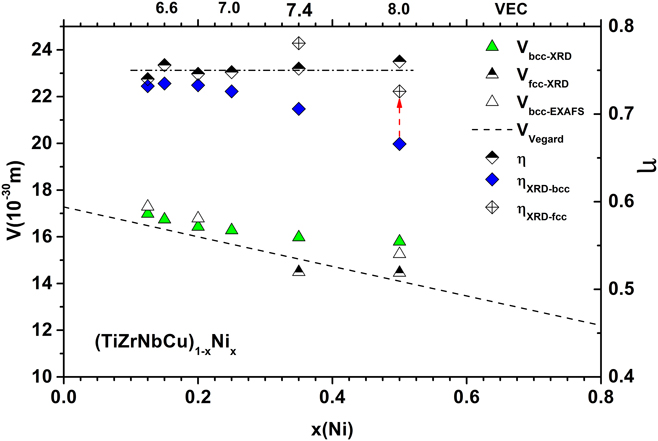
By assuming an approximate crystal structure of the local atomic arrangement, one can calculate the corresponding average lattice parameter a and the average atomic volume, V. In particular, for a bcc-like local atomic structure, a bcc = 2d/30.5 and V bcc = a 3/2, whereas for the fcc-like atomic SRO, a fcc = 20.5d and V fcc = a 3/4. The variation of a bcc of all our alloys with Ni content was shown in Fig. 2 of Ref. Reference Figueroa, Ristić, Kuršumović, Biljaković, Starešinić, Pajić, Remenyi and Babić36, whereas a bcc for alloys with x ≤ 0.25 (VEC ≤ 7) follows Vegard’s law for a bcc crystal structure quite well (making allowance for somewhat lower mass-density of amorphous alloysReference Figueroa, Ristić, Kuršumović, Biljaković, Starešinić, Pajić, Remenyi and Babić36), the a bcc data for alloys with more Ni (VEC > 7) show a strong upward deviation from the Vegard’s law. Here, in Fig. 2, we show the corresponding V bcc values for all our alloys as a function of Ni-content x and VEC (upper abscissa). The variation of V bcc is qualitatively the same as that of a bcc,Reference Figueroa, Ristić, Kuršumović, Biljaković, Starešinić, Pajić, Remenyi and Babić36 and V bcc tends to “saturate” for x ≥ 0.35 at values which are considerably larger than those predicted by Vegard’s law. The values of V fcc, obtained from XRD patterns by assuming an fcc-like local atomic structure, for x ≥ 0.35 and also shown in Fig. 2 seem to agree better with the expected, approximately linear, variation of atomic volumes with concentration. This is a rather general feature of metal–metal type amorphous alloys.Reference Ristić, Cooper, Zadro, Pajić, Ivkov and Babić38,Reference Bakonyi49,Reference Ma, Stoica and Wang50 Therefore, the variations of both average lattice parametersReference Figueroa, Ristić, Kuršumović, Biljaković, Starešinić, Pajić, Remenyi and Babić36 and atomic volumes with x (Fig. 2) indicate a change in atomic SRO in alloys with more Ni (x ≥ 0.35, VEC ≥ 7.4).
Atomic volumes and APFs of (TiZrNbCu)1−xNix alloys versus x and VEC (upper abscissa). Left scale: Atomic volume V; right scale: packing fractions η. Dashed lines are guide for eye.

From the atomic (or molar) volumes, one can also calculate the average local APFs.Reference Ma, Stoica and Wang50 In particular, the APF for an amorphous alloy, ηa, can be calculated from the expressionReference Ma, Stoica and Wang50:
 $${\eta _{\rm{a}}} = {{\sum\limits_k {\eta _k^0{x_k}V_k^0} } \over {{V_{\rm{a}}}}}\quad ,$$
where  $\eta _k^{\rm{0}}$ is the APF of the k-th constituent of the alloy in its crystalline state, x k and
 $V_k^0$ are its molar fraction and molar volume in the crystalline state, respectively, and V a = M/D, where M is the molar mass and D is the mass density that was calculated from the atomic volumes of amorphous Ti, Zr, Nb, Cu, and Ni in Ref. Reference Bakonyi49. As can be seen in the upper part of Fig. 2, these values of ηa are approximately constant, as could be expected because V a obeys Vegard’s law, and fairly high, ηa ≈ 0.75 ± 0.01. The APF obtained by using V bcc values, (thus V bcc from Fig. 2 instead of V a) ηbcc, is also shown in the upper part of the same figure. ηbcc is like ηa approximately constant but is a little lower (lower D Reference Biljaković, Remenyi, Figueroa, Ristić, Pajić, Kuršumović, Starešinić, Zadro and Babić18) than ηa for x < 0.25 but rapidly decreases to ηbcc = 0.67 for x = 0.5. Thus, the variations of both V bcc and ηbcc indicate changes in atomic SRO for x ≥ 0.35.
However, by replacing V bcc with V fcc for x = 0.5, one recovers the expected approximately constant APF, specific to amorphous alloys of the metal–metal type.Reference Ristić, Cooper, Zadro, Pajić, Ivkov and Babić38,Reference Ma, Stoica and Wang50 Thus, the variations of all parameters derived from XRD patterns (Fig. 2 and Ref. Reference Figueroa, Ristić, Kuršumović, Biljaković, Starešinić, Pajić, Remenyi and Babić36) indicate a progressive change in local atomic arrangements accompanying the transition from HEA to the concentration region with higher Ni content. This change apparently affects the thermal parameters (Sec. III.A and Ref. Reference Figueroa, Ristić, Kuršumović, Biljaković, Starešinić, Pajić, Remenyi and Babić36) and probably the interatomic bonding in the alloys studied.
However, Guinier’s procedureReference Calvayrac, Chevalier, Harmelin and Quivy45 for the determination of the average distance between the nearest neighbors in amorphous alloys from XRD patterns has been vigorously criticized (e.g., Ref. Reference Hufnagel, Ott and Almer51). Therefore, we recently started SXPD measurements which provide a more direct insight into the possible changes in the atomic SRO, obtained from the structure factors S(Q) and radial distribution functions RDF(r) as well as from a more reliable determination of d. The total X-ray S(Q) was obtained from integrated raw intensity data, I raw(Q), using the procedure described elsewhere.Reference Egami and Billinge52,Reference Bednarcik, Michalik, Kolesar, Rutt and Franz53 Briefly, I raw(Q) was corrected for background (air scattering), self-absorption, fluorescence, and Compton scattering and then scaled and normalized into electron units using the high-angle region method.Reference Waseda54 The corrected intensity, I cor(Q), was used to calculate S(Q) by applying the Faber–Ziman formalism.Reference Faber and Ziman55 All the corrections mentioned above were obtained using the PDFGetX2 program.Reference Qiu, Thompson and Billinge56
The S(Q) curves (not shown) consisted of a strong initial peak, followed by a series of broad, damped oscillations extending up to Q = 16 Å−1, which together rule out any crystallinity in our samples with x ≥ 0.125. The position of the first peak shifted rapidly with x to higher Q for x ≤ 0.25, but the shift slowed down for x = 0.5. A more drastic change occurred in the second, split maximum of S(Q) which is probably more directly related to the atomic SRO than the first one (e.g., Ref. Reference Scudino, Stoica, Kaban, Prashanth, Vaughan and Eckert57). In particular, its asymmetry, the difference in the magnitudes of its first and second part (higher Q), was strongly reduced at x = 0.5 with respect to those observed for x ≤ 0.25.
The radial distribution functions RDF(r) were obtained through sine Fourier transformation of S(Q):
 $${\rm{RDF}}\left( r \right) = 4\pi {r^2}\rho \left( r \right) = 4\pi {r^2}{\rho _0} + r{2 \over \pi }\int_0^\infty {Q\left[ {S\left( Q \right) - 1} \right]} \sin \left( {rQ} \right){\rm{d}}Q\quad ,$$
where ρ(r) and ρ0 are the local and average atomic number densities, respectively, and r is the radial distance.
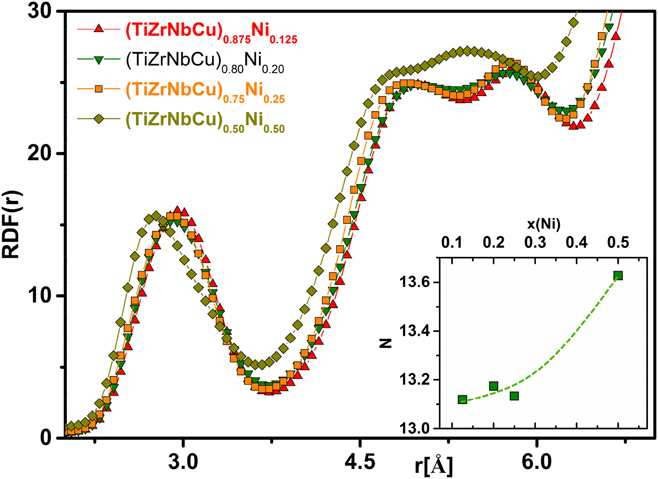
RDF(r) curves shown in Fig. 3 confirm a strong change in both atomic short- and medium-range order occurring for x = 0.5. In particular, the shape of the first maximum SRO becomes strongly asymmetric on the right side of the peak, while in the second, split maximum, the magnitude of its second part (higher r) is strongly enhanced with respect to that of its first part. From the positions of the first peaks, we determined corresponding interatomic distances and average bcc-atomic volumes which agree well with those obtained from XRD patterns as demonstrated in Fig. 2. From RDF(r), we also calculated the average coordination number, N (the number of atoms in a spherical shell between radii r 1 and r 2 around an average atom):
 $$N = \int_{{r_1}}^{{r_2}} {{\rm{RDF}}\left( r \right)} {\rm{d}}r\quad .$$
Radial distribution functions RDF(r) versus r for (TiZrNbCu)1−xNix alloys. The inset: corresponding coordination numbers N versus x. Dashed line in the inset is guide for eye.

The variation of N for the cut-off r 2 at the minimum between the first and second maxima in Fig. 3 is shown in the inset of Fig. 3. A strong increase of N is observed at x = 0.5, confirming the change in SRO. We note that N ≥ 13 is usual in multicomponent MGs.Reference Scudino, Stoica, Kaban, Prashanth, Vaughan and Eckert57 Since for high r 2 N may have some contribution from the second atomic shell,Reference Hufnagel, Ott and Almer51 we have checked the variations of N for somewhat lower values of r 2 and obtained qualitatively the same variations with x. In particular, for a cut-off at 0.95 r 2, we obtained N increasing from 12.4 for x ≤ 0.25 to 12.8 at x = 0.5. Therefore, the initial results of SXPD provide strong support for a change in atomic arrangements at x = 0.5 (VEC = 8). This change is accompanied by an increase in N, which is reminiscent of the proposed correlation between VEC and crystal structure in HEAs.Reference Gao, Zhang, Gao, Zhang, Ouyang, Widom and Hawk42,Reference Sheikh, Mao and Guo43 Due to the correlation between the local atomic order and electronic structure, we expect strong changes in the electronic structure in the region with more Ni as described in Sec. III.C.
C. Electronic structure
As already noted in Sec. I and in several recent papers (e.g., Refs. Reference Biljaković, Remenyi, Figueroa, Ristić, Pajić, Kuršumović, Starešinić, Zadro and Babić18, Reference Wu, Troparevsky, Gao, Morris, Stocks and Bei25, Reference Ristić, Zadro, Pajić, Figueroa and Babić28, Reference Figueroa, Ristić, Kuršumović, Biljaković, Starešinić, Pajić, Remenyi and Babić36, Reference Ristić, Cooper, Zadro, Pajić, Ivkov and Babić38, and Reference Tian, Varga, Chen, Shen and Vitos58 for metallic systems, regardless whether they are amorphous or crystalline, the electronic structure controls practically all their intrinsic properties (those that are hardly affected by the exact preparation and/or post-processing conditions). The importance of the electronic structure in understanding the properties of alloys probably shows up the best in the case of amorphous TE–TL alloys. Soon after the discovery of these MGs, the PES revealed the split-band structure of these alloys with TL metals having a full or nearly full d sub-band for which the electronic DoS at the Fermi level, N 0(E F), is dominated by TE d-states.Reference Oelhafen, Hauser and Güntherodt59 Thus, the effect of alloying with TL is approximately described by a dilution of a-TE,Reference Ristić, Babić, Šaub and Miljak60 which simplifies the explanation of the linear variations of most properties of these MGs with TL content.Reference Ristić, Cooper, Zadro, Pajić, Ivkov and Babić38,Reference Ristić and Babić46,Reference Ristić, Babić, Šaub and Miljak60 Furthermore, N 0(E F) values of TE-rich alloys (determined from LTSH) were higher than those of stable hexagonal close-packed crystalline phases of corresponding TEReference Bakonyi61 and were close to those calculated for hypothetical fcc structures of TEs.Reference Bakonyi, Ebert and Liechenstein48 High N 0(E F) in TE-rich MGs leads to enhanced superconductivity and magnetic susceptibilityReference Ristić and Babić46 but also to weaker interatomic bonding, thus to lower elastic moduli and thermal stability.Reference Ristić, Stubičar and Babić62 The combined studies of PES and ab initio calculations were also performed on Zr-based multicomponent MGs and showed that N 0(E F) is dominated by TE d-electrons as in binary MGs (e.g., Ref. Reference Hasegawa, Sato, Takeuchi, Soda and Mizutani63). We note that a combination of PES, LTSH, and ab initio theory is the best to fully comprehend the electronic structure. In particular, ordinary PES and LTSH experiments reveal the variation of the total DoS with energy (PES) and give accurate value for N 0(E F) (LTSH), but they cannot provide accurate contributions of the alloying elements (pDoS) to these quantities. The theory can in principle provide all these quantities as well as the probable local atomic structure (including CSROReference Hasegawa, Sato, Takeuchi, Soda and Mizutani63) but its results are often limited by the rather small size of the sample and approximations involved in a given calculation (e.g., Refs. Reference Ristić, Cooper, Zadro, Pajić, Ivkov and Babić38, Reference Tian, Varga, Chen, Shen and Vitos58, and Reference Hasegawa, Sato, Takeuchi, Soda and Mizutani63).
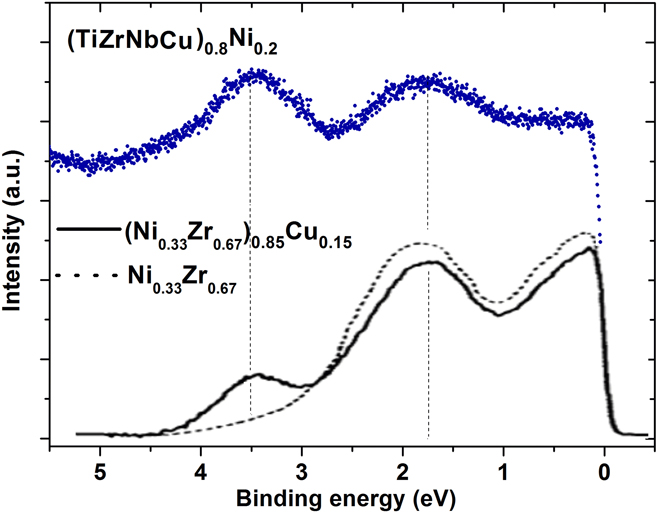
Accordingly, we performed combined PESReference Babić, Biljaković, Figueroa, Kuršumović, Mikšić Trontl, Pajić, Pervan, Remenyi, Ristić and Starešinić22,Reference Mikšić Trontl64 and LTSHReference Biljaković, Remenyi, Figueroa, Ristić, Pajić, Kuršumović, Starešinić, Zadro and Babić18,Reference Figueroa, Ristić, Kuršumović, Biljaković, Starešinić, Pajić, Remenyi and Babić36 studies of a-(TiZrNbCu)1−xNix alloys with x covering both HEA and regions with higher Ni content. The results of PES in the a-HEA region are illustrated in Fig. 4 and compared with those for binary and ternary Zr-based MGs.Reference Zehringer, Oelhafen, Güntherodt, Yamada and Mizutani65 The recorded “ultraviolet photoemission spectrum” (UPS) reflects the DoS within the valence band of the amorphous (TiZrNbCu)0.8Ni0.2 alloy. The spectral maximum at 3.5 eV below the Fermi level, associated with the Cu-3d states, is well resolved and separated from the low-energy part of the spectrum. From the comparison with the spectrum of amorphous (Ni0.33Zr0.67)0.85Cu0.15 and Ni0.33Zr0.67 alloys,Reference Zehringer, Oelhafen, Güntherodt, Yamada and Mizutani65 shown in the lower part of Fig. 4, it is evident that the low-energy part of the spectrum has contributions from Ni-3d and Zr-4d bands.Reference Zehringer, Oelhafen, Güntherodt, Yamada and Mizutani65 It appears that most of the spectral intensity between 1 and 2 eV below E F comes from the DoS associated with Ni-3d bands.Reference Mikšić Trontl, Pervan and Milun66,Reference Calloni, Bussetti, Berti, Yivlialin, Camera, Finazzi, Duò and Ciccacci67 The Ni contribution to the intensity at the Fermi level is not negligible and is likely to increase at high Ni-content.Reference Greig, Gallagher, Howson, Law, Norman and Quinn68 The Zr-4d band is expected to contribute to the DoS mainly at the Fermi levelReference Takahara and Narita69 as is the Ti-3d band, as judged from the spectrum from pure TiReference Höchst, Steiner, Reiter and Hiifner70 and an amorphous (Ni0.33Zr0.67)0.85Ti0.15 alloy.Reference Zehringer, Oelhafen, Güntherodt, Yamada and Mizutani65 The Nb-4d band contributes to the spectral intensity at the Fermi level and around 1.2 eVReference Xiang, Liu, Li, Yang, Liu, Fan, Shen, Wang and Liu71 but possibly to a lesser extent than Ni.Reference Kübler, Bennemann, Lapka, Rösel, Oelhafen and Güntherodt72 The s–p bands of all constituents span a larger energy range and generally contribute less to the photoemission intensity. Therefore, we could not extract their contribution to the DoS from the spectra of the alloys. The effects of increasing Ni content x and of crystallization of the sample with x = 0.125 on photoemission spectra have also been studied.Reference Mikšić Trontl64 The present results add to mounting evidence that PES is an efficient tool for assessing the contributions of individual constituents to the electronic properties of 3d and 4d transition metal-based HEAs. Indeed, the insight obtained from PES will be helpful for the interpretation of LTSH, magnetic susceptibility, and superconductivity data for the same alloys.
UPS of (TiZrNbCu)0.8Ni0.2 (blue dotsReference Mikšić Trontl64), and for comparison, of (Ni0.33Zr0.67)0.85Cu0.15 and Ni0.33Zr0.67 from Ref. Reference Zehringer, Oelhafen, Güntherodt, Yamada and Mizutani65.

As noted above, LTSH provides a quantitative insight into the DoS at E F which controls the physical properties of metallic systems. In particular, the Sommerfeld coefficient of the linear term in LTSH is given asReference Biljaković, Remenyi, Figueroa, Ristić, Pajić, Kuršumović, Starešinić, Zadro and Babić18,Reference Figueroa, Ristić, Kuršumović, Biljaković, Starešinić, Pajić, Remenyi and Babić36,Reference Ristić, Cooper, Zadro, Pajić, Ivkov and Babić38
 $$\gamma = {{{\pi ^2}k_{\rm{B}}^2{N_0}\left( {{E_{\rm{F}}}} \right)\left( {1 + {\lambda _{{\rm{e}} - {\rm{p}}}}} \right)} \over 3}\quad ,$$
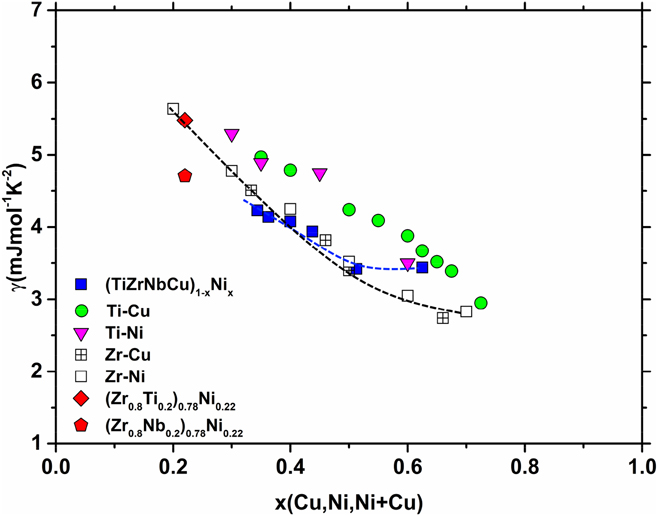
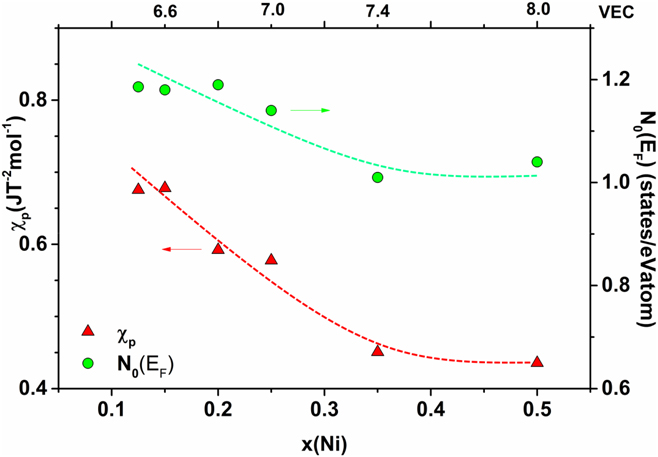
where k B is the Boltzmann constant and λe–p represents the electron–phonon enhancement of the DoS at E F, N 0(E F). Since the local atomic arrangements determine the ES of alloys (e.g., Ref. Reference Ristić, Zadro, Pajić, Figueroa and Babić28), we expect a change of N 0(E F), thus also γ of our alloys, in going from a-HEAs (x ≤ 0.25) to conventional amorphous alloys with higher Ni content (x ≥ 0.35). In Fig. 5, we compare the variations of γ with TL content in our alloysReference Figueroa, Ristić, Kuršumović, Biljaković, Starešinić, Pajić, Remenyi and Babić36 with those in several binary and ternary a-TE–TL alloys composed from the same TEs and TLs.Reference Moody, Ng, Eckern, Schmid, Weber and Wühl73–Reference Karkut and Hake77 In Fig. 5, we plot γ versus total TL content (that of Cu and Ni) in our alloys since in binary TE–TL amorphous alloys, the variations of γ in the alloys with TL = Cu and Ni are very similar, thus it is the total TL content which causes a decrease of γ in alloys containing both Cu and Ni. (If we plotted γ versus Ni content only, as was done in Ref. Reference Figueroa, Ristić, Kuršumović, Biljaković, Starešinić, Pajić, Remenyi and Babić36, this will only shift the data in Fig. 5 toward the left but will not change the overall variation with x.) As can be seen in Fig. 5, in our alloys, γ values initially decrease with x as in other a-TE–TL alloys, but they saturate for x ≥ 0.35, this does not occur in binary alloys at similar TL contents. In particular, γ of binary alloys seems to follow a linear decrease with x throughout the x-range explored (x ≤ 0.70). Possible exceptions are a-Zr–Ni alloys, which seem to show slower variation of γ with x for x > 0.60 (VEC > 7.5).Reference Bakonyi61 In these alloys, this change is associated with a strong CSRO effectReference Ristić, Cooper, Zadro, Pajić, Ivkov and Babić38,Reference Bakonyi49,Reference Bakonyi61,Reference Hasegawa, Sato, Takeuchi, Soda and Mizutani63 and the change in the position of E F with respect to the two sub-bands in the DoS, as evidenced by Hall effect and thermopower measurements.Reference Ivkov, Babić and Jacobs78 Ab initio studies of the atomic and electronic structure of binary amorphous alloys of Ni with Ti, Zr, V, or Nb performed by Hausleitner and HafnerReference Hasegawa, Sato, Takeuchi, Soda and Mizutani63 corroborated these findings. They found an increase in CSRO and a change in local atomic order at high Ni contents. Simultaneously, the d-band of Ni broadened and shifted towards the Fermi energy. These effects could also affect the variation of γ with Ni content in our alloys, but preliminary measurements of the Hall effect in a-HEAs do not seem to indicate such band-crossingReference Kuveždić, Tafra, Basletić, Ristić, Trontl, Pervan, Figueroa and Babić79 for x < 0.5. As regards its magnitude, γ of our alloys with x = 0.35 agrees rather better with those for a-Zr–Cu, Ni alloys than with those for a-Ti–Cu, Ni alloys, in spite of the sizable Ti-content. This may be due to the Nb content in our alloys which reduces both their Zr and Ti contents and, as can be seen in Fig. 5, the addition of Nb strongly suppresses γ in a-Zr–Nb–Ni alloys.Reference Karkut and Hake77 Since γ depends on the DoS which is enhanced by the electron–phonon interaction, it cannot be used to prove that the change in γ for x ≥ 0.35 is due to N 0(E F). However, in superconducting transition metal alloys, one can use the McMillan expressionReference McMillan80 to disentangle N 0(E F) from λe–p. By using the results of recent measurements of the superconducting transition temperatures, T c,Reference Kuveždić, Tafra, Basletić, Ristić, Trontl, Pervan, Figueroa and Babić79 we have calculated the values of N 0(E F) shown in Fig. 6, which confirm a change in N 0(E F) for x ≥ 0.35. Thus, our study of the electronic structure is consistent with that of the atomic structure in Sec. III.B, in that a change of electronic structure accompanies the change in local atomic arrangements for x > 0.35. This change in electronic structure exerts strong influence on physical properties, as demonstrated in Sec. III.D.
Variation of electronic coefficient γ versus x for (TiZrNbCu)1−xNixReference Figueroa, Ristić, Kuršumović, Biljaković, Starešinić, Pajić, Remenyi and Babić36 and some binary and ternary amorphous alloys. Data for Ti–Cu are from Ref. Reference Moody, Ng, Eckern, Schmid, Weber and Wühl73, for Ti–Ni from Ref. Reference Kanemaki, Suzuki, Yamada and Mizutani74, for Zr–Cu from Ref. Reference Garoche and Bigot75, for Zr–Ni from Ref. Reference Matsuura and Mizutani76, for (Zr0.8Ti0.2)0.78Ni0.22 and (Zr0.8Nb0.2)0.78Ni0.22 from Ref. Reference Karkut and Hake77. Dashed lines are guide for eye.

Density of states N 0(E F) and Pauli susceptibility for (TiZrNbCu)1−xNix alloys versus x and VEC (upper abscissa). Left scale: χp and right scale: N 0(E F). Dashed lines are guide for eye.

D. Physical properties
Among the physical properties, the paramagnetic Pauli susceptibility of nonmagnetic alloys is directly related to the electronic structure. However, the magnetic susceptibility χexp of transition metals and alloys is quite complex and consists of three main contributionsReference Ristić, Cooper, Zadro, Pajić, Ivkov and Babić38,Reference Bakonyi, Ebert and Liechenstein48 :
 $${\chi _{\exp }} = {\chi _{\rm{p}}} + {\chi _{{\rm{dia}}}} + {\chi _{{\rm{orb}}}}\quad ,$$
where χp is the Pauli paramagnetic contribution of d-electrons and χdia and χorb are the diamagnetic and orbital paramagnetic contributions, respectively. χdia and χorb are calculated by adding corresponding contributions from the constituents.Reference Bakonyi, Ebert and Liechenstein48,Reference Banhart, Ebert and Voitlander81,Reference Place and Rhodes82 The Pauli paramagnetism of a d-band is enhanced over the free-electron value,  $\chi _{\rm{p}}^0 = {\mu _{\rm{0}}}\mu _{\rm{B}}^2{N_0}\left( {{E_{\rm{F}}}} \right)$ (where µ0 is the permeability of the vacuum and µB is the Bohr magneton), by the exchange interaction, namely,
 ${\chi _{\rm{p}}} = S\chi _{\rm{p}}^0$, where S is the Stoner enhancement factor, which also depends on N 0(E F). But in many amorphous TE–TL alloys,Reference Ristić, Cooper, Zadro, Pajić, Ivkov and Babić38 S is nearly constant within their GFR, thus the variation of χp with concentration is dominated with N 0(E F). In spite of its complex structure, χexp in a-TE–TL alloys often varies with composition in qualitatively the same way as γ.Reference Ristić, Cooper, Zadro, Pajić, Ivkov and Babić38 This is probably due to an approximately linear decrease of χorb with TL content, which does not affect the overall dependence on composition. This has also been observed in our alloys,Reference Figueroa, Ristić, Kuršumović, Biljaković, Starešinić, Pajić, Remenyi and Babić36 therefore it seems to be quite general feature of nonmagnetic a-TE–TL alloys which does not depend on their number of components. Indeed, when the variation of χexp with x of our alloys is compared with those for binary amorphous alloys made of the same constituent TE and TL metals,Reference Babić, Biljaković, Figueroa, Kuršumović, Mikšić Trontl, Pajić, Pervan, Remenyi, Ristić and Starešinić22 the result is qualitatively the same as that for the corresponding values of γ shown in Fig. 5. In particular, the variation of χexp with x for x ≤ 0.35 is close to that for a-Zr–Ni alloys but tends to saturate for x > 0.35 (as does γ in Fig. 5). In Fig. 6, we show that the variations of χp = χexp − (χdia + χorb) and N 0(E F) in our alloys are qualitatively the same, which shows that the change in the electronic structure for x ≥ 0.35 (VEC = 7.4) affects the magnetic properties of our alloys.
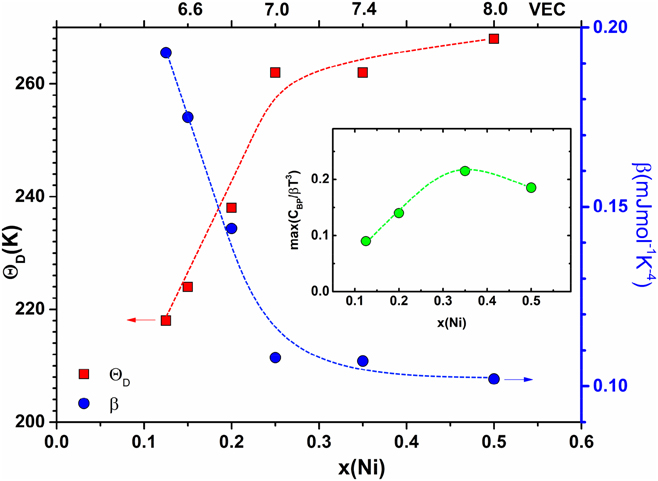
As already noted, LTSH also provides information on the atomic vibrations and interatomic bonding.Reference Biljaković, Remenyi, Figueroa, Ristić, Pajić, Kuršumović, Starešinić, Zadro and Babić18,Reference Ristić, Cooper, Zadro, Pajić, Ivkov and Babić38,Reference Remenyi, Biljaković, Starešinić, Dominko, Ristić, Babić, Figueroa and Davies41 This information is contained in the Debye βT 3 phonon term in C p. Since β ∝ θD−3,Reference Remenyi, Biljaković, Starešinić, Dominko, Ristić, Babić, Figueroa and Davies41 one can calculate θD from the measured β. The variation of θD with x in our alloys shown in Fig. 7 is qualitatively the same as those of the thermal stability parameters T x and T lReference Figueroa, Ristić, Kuršumović, Biljaković, Starešinić, Pajić, Remenyi and Babić36: θD increases rapidly for x ≤ 0.35 but tends to saturate in the Ni-rich region. Since the average atomic mass in the alloys studied changes linearly and relatively little with x,Reference Biljaković, Remenyi, Figueroa, Ristić, Pajić, Kuršumović, Starešinić, Zadro and Babić18 the abrupt change in the variation of θD for x > 0.35 is apparently related to a change in interatomic bonding and electronic structure, as was the case with T x and T l.Reference Figueroa, Ristić, Kuršumović, Biljaković, Starešinić, Pajić, Remenyi and Babić36 Careful measurementsReference Biljaković, Remenyi, Figueroa, Ristić, Pajić, Kuršumović, Starešinić, Zadro and Babić18 have shown that C p increases faster with temperature than the T 3 law predicted by the Debye model.Reference Remenyi, Biljaković, Starešinić, Dominko, Ristić, Babić, Figueroa and Davies41 This indicates the presence of the so-called “BP”, an excess of low-energy vibrational states with respect to that predicted by the Debye model (e.g., Ref. Reference Cheng and Ma83). A preliminary analysis shows a nonmonotonic variation of the magnitude of BP with Ni-content (the inset of Fig. 7) similar to that of θD. To our knowledge, this is the first observation of a possible correlation between the ordinary (θD) and excess atomic vibrations in amorphous solids. At present, we have no proper explanation for the observed behavior of the BP in our alloys. However, a change in local atomic arrangements with Ni concentration is expected to affect the atomic vibrations, thus the observed variations of both the BP and θD seem plausible. At present, there is no commonly accepted explanation of the BP in glassy systems: some researchers emphasize localized phonon modes (like those caused by oscillations of loosely bonded atoms within the cages of surrounding atoms), whereas others ascribe the BP to a smeared van Hove anomaly.Reference Remenyi, Biljaković, Starešinić, Dominko, Ristić, Babić, Figueroa and Davies41,Reference Cheng and Ma83,Reference Salčinović Fetić, Remenyi, Starešinić, Kuršumović, Babić, Sulejmanović and Biljaković84 We note however that the size of the BP depends quite strongly on the amount of the quenched-in disorder which complicates the study of its variation with composition.Reference Salčinović Fetić, Remenyi, Starešinić, Kuršumović, Babić, Sulejmanović and Biljaković84 It is important to note that in ourReference Biljaković, Remenyi, Figueroa, Ristić, Pajić, Kuršumović, Starešinić, Zadro and Babić18,Reference Figueroa, Ristić, Kuršumović, Biljaković, Starešinić, Pajić, Remenyi and Babić36 and other a-TE–TL alloys (e.g., Ref. Reference Ristić, Cooper, Zadro, Pajić, Ivkov and Babić38) as well as in the crystalline cubic TE-based HEAs,Reference Koželj, Vrtnik, Jelen, Jazbec, Jagličić, Maiti, Feuerbacher, Steurer and Dolinšek21 the rule-of-mixtures does not describe θD properly. This conclusion holds even in the case of a self-consistent choice of the values of θD of the constituent elements.Reference Biljaković, Remenyi, Figueroa, Ristić, Pajić, Kuršumović, Starešinić, Zadro and Babić18
Phonon coefficients ß and Debye temperatures of (TiZrNbCu)1−xNix alloys versus x and VEC (upper abscissa). Left scale: variation of θD; right scale: variation of β. The inset: variation of the magnitude of BP versus x. Dashed lines are guide for eye.

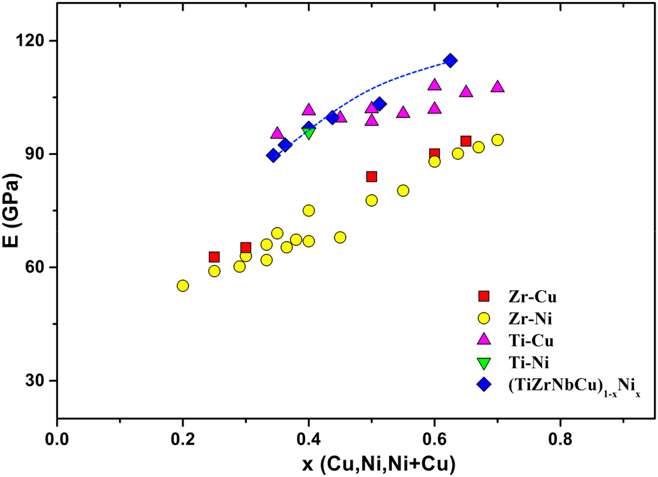
As noted earlier,Reference Biljaković, Remenyi, Figueroa, Ristić, Pajić, Kuršumović, Starešinić, Zadro and Babić18,Reference Figueroa, Ristić, Kuršumović, Biljaković, Starešinić, Pajić, Remenyi and Babić36,Reference Ristić, Cooper, Zadro, Pajić, Ivkov and Babić38,Reference Ristić and Babić46,Reference Hasegawa, Sato, Takeuchi, Soda and Mizutani63,Reference Cheng and Ma83,Reference Ristić, Babić, Stubičar, Kuršumović, Cooper, Figueroa, Davies, Todd, Varga and Bakonyi85 there is a very simple experimental relationship between ES and mechanical properties (including hardness) and thermal stability (represented by T x and T l) of the nonmagnetic a-TE–TL alloys. In particular, a decrease in N 0(E F) or γ or χexp is usually accompanied by increases in Young’s modulus, hardness, Debye temperature, and thermal stability of these alloys. Therefore, a decrease in DoS at E F reflects in these systems an increase in the interatomic bonding, and accordingly the stiffness and parameters related to atomic vibrations and thermal stability increase too. We note that such a simple relationship between the electronic structure and interatomic bonding is quite common in crystalline alloys and in nonmagnetic a-TE–TL alloys, it probably stems from their simple electronic band structure.Reference Ristić, Stubičar and Babić62 In Fig. 8, we compare the variations of E of our relaxed samples that have received a short anneal close to T g, with total (Cu + Ni) content to those of binary a-TE–TL alloys composed from the same TEs and TLs.Reference Marohnić, Guberović, Babić and Morgan86–Reference Ristić, Babić, Pajić, Zadro, Kuršumović, Figueroa, Davies, Todd, Varga and Bakonyi90 Comparing the data in Figs. 5, 6, and 8, we see that a correlation between the electronic structure and E is obeyed by our alloys, too. Furthermore, the approximately linear variation of E with x in binary alloys seems to be replaced by a more complex variation in our multicomponent alloys. This probably reflects a change in the SRO and the electronic structure for x (Cu + Ni) > 0.51. The sensitivity of E to quenched-in disorder and the degree of relaxation introduces considerable uncertainty in the variation of E with x. As already noted,Reference Biljaković, Remenyi, Figueroa, Ristić, Pajić, Kuršumović, Starešinić, Zadro and Babić18,Reference Figueroa, Ristić, Kuršumović, Biljaković, Starešinić, Pajić, Remenyi and Babić36,Reference Ristić, Cooper, Zadro, Pajić, Ivkov and Babić38 RoM provides a poor description of E in all a-TE–TL alloys and it also fails to describe the mechanical properties of cubic crystalline TE-based HEAs.Reference Maiti and Steurer91
Variation of E versus x for (TiZrNbCu)1−xNix and some binary amorphous alloys. Data for Zr–Cu are from Refs. Reference Marohnić, Guberović, Babić and Morgan86 and Reference Whang, Polk, Giessen, Masumoto and Suzuku87, for Zr–Ni from Refs. Reference Marohnić, Guberović, Babić and Morgan86 and Reference Cohrane, Destry, El Amrani, Altounian, Strom-Olsen, Steeb and Warlimont88, for Ti–Cu from Refs. Reference Ristić, Babić, Stubičar, Kuršumović, Cooper, Figueroa, Davies, Todd, Varga and Bakonyi85, Reference Davis, Chou, Tanner and Ray89, and Reference Ristić, Babić, Pajić, Zadro, Kuršumović, Figueroa, Davies, Todd, Varga and Bakonyi90, and Ti–Ni from Ref. Reference Whang, Polk, Giessen, Masumoto and Suzuku87. Dashed lines are guide for eye.

For the sake of completeness, in what follows we briefly summarize some results of an ongoing study of the electronic transport properties of our alloys.Reference Kuveždić, Tafra, Basletić, Ristić, Trontl, Pervan, Figueroa and Babić79 As is usual in a-TE–TL alloys,Reference Ristić, Cooper, Zadro, Pajić, Ivkov and Babić38 the electrical resistivities ρ of a-(TiZrNbCu)1−xNix alloys are high (>150 µΩ cm) and accordingly decrease with increasing temperature over most of the explored temperature range (T ≤ 300 K). The variation of their electrical conductivities seems dominated by weak electron localization effectsReference Fukuyama and Hoshino92 over a broad temperature range (10–300 K) as is usual in a-TE–TL alloys.Reference Šaub, Babić and Ristić93–Reference Ristić, Babić and Šaub95 All the samples are superconducting, but with a low T c ≤ 1.6 K. For x ≤ 0.35, T c decreases approximately linearly with x, as is usual in nonmagnetic a-TE–TL alloys.Reference Tafra, Basletić, Ristić, Babić and Hamzić96 However, at higher x = 0.5, T c tends to become constant, hence it follows the same trend with x as γ and N 0(E F), as is usual for disordered transition metal alloys.Reference Tafra, Basletić, Ristić, Babić and Hamzić96 A preliminary study of the Hall effect for x ≤ 0.25 shows that the Hall coefficients R H are positive and change only a little with x, again in accord with the results for a-TE–TL alloys with lower TL contents.Reference Ristić, Cooper, Zadro, Pajić, Ivkov and Babić38,Reference Ivkov, Babić and Jacobs78 Thus, the results for all physical properties of our multicomponent alloys studied until now seem similar to those of the corresponding binary alloys. This probably stems from their similar split-band electronic structures (Fig. 3).
IV. CONCLUSION
The main results of comprehensive experimental studies of the relationship between the atomic structure, electronic structure, and selected physical properties performed on well-characterized multicomponent (TiZrNbCu)1−xNix (x ≤ 0.5) amorphous alloys are presented. Owing to the broad concentration range explored, the relationship could be studied both in the high-entropy (a-HEA) region (x ≤ 0.25) and in the region of conventional, Ni-based multicomponent amorphous alloys (x ≥ 0.35). Such studies are important since the atomic structure and the corresponding electronic structure in metallic systems determine almost all their properties. Therefore, such studies provide a deeper understanding of the properties of the system investigated and moreover enable the prediction of some properties prior to measurement. We note that theoretical, ab initio studies of the atomic structure–electronic structure–property relationship in multicomponent alloys are especially important and will greatly accelerate both the development and understanding of novel complex alloys. However, ab initio studies of novel systems are complementary to experimental studies and cannot fully replace them in the development of novel materials.
The main result of our research is the complete consistency between studies of the atomic structure, electronic structure, and selected physical properties. This clearly demonstrates the power of such an approach because none of the correlations found can be properly described by using the rule-of-mixtures.Reference Biljaković, Remenyi, Figueroa, Ristić, Pajić, Kuršumović, Starešinić, Zadro and Babić18,Reference Figueroa, Ristić, Kuršumović, Biljaković, Starešinić, Pajić, Remenyi and Babić36
As regards to the atomic structures, both the results of ordinary X-ray scattering and those from the ongoing study using synchrotron radiation provide evidence that the transition from the HEA composition range to that of conventional Ni-based amorphous alloys for x ≥ 0.35 and an average number of valence electrons VEC ≥ 7.4 is accompanied by a change in the interatomic arrangements. A possible cause of this change is the strong bonding tendency between Ni and Zr, Ti, or Nb, as shown by the large negative values of H mix in Fig. 1. This results in the development of strong chemical short-range order which is reflected in the electronic structure.Reference Hasegawa, Sato, Takeuchi, Soda and Mizutani63 The change results in an increase in the number of nearest neighbor atoms (obtained from the radial distribution function) and is therefore consistent with the change from the bcc- to fcc-like local atomic arrangements. A similar type of a change of the crystal structure has been observed previously in crystalline HEAs for VEC ≥ 7.Reference Gao, Zhang, Gao, Zhang, Ouyang, Widom and Hawk42,Reference Sheikh, Mao and Guo43
The electronic structure, studied by the “LTSH” and, for the first time, PES, also changes during the transition from the HEA to the conventional alloy region. In particular, the decrease of the electronic density of states at the Fermi level, N 0(E F) stops for x ≥ 0.35. A possible cause is the change in the electronic states at the Fermi level from the dominant d-states of Zr and Ti to those of Ni, but further studies, including those of Hall effect and thermopower, are required to prove this conjecture.
As could be expected in metallic systems, the selected physical properties reflect the electronic structure of our alloys. In particular, the decrease of magnetic susceptibility, like that of N 0(E F), stops for x ≥ 0.35. This also shows that the correlation between the electronic structure and selected physical properties in the amorphous alloys composed of TE and TL metals does not depend on the number of components of the alloy. The changes in the variations of the vibrational, elastic, and thermal stability parameters with concentration for x ≥ 0.35 show that a change in the interatomic arrangements is accompanied by a change in the interatomic bonding. In particular, the increase of all these parameters with x stops, or slows down, for x ≥ 0.35. This is consistent with the conjectured change from bcc- to fcc-like local atomic arrangements.
Finally, we briefly address the relation between the present results for amorphous multicomponent alloys of TE and TL metals with the corresponding results for binary amorphous alloys of Zr and Ti with Cu and Ni. As shown in Sec. III.C and III.D, due to the qualitatively similar split-band structure of the valence bands, both types of alloys show an approximately linear variation of a number of properties related to atomic and electronic structures, over a broad concentration range.Reference Ristić, Cooper, Zadro, Pajić, Ivkov and Babić38 However, for binary systems with Cu, this linear variation is preserved over the entire glass forming range (x ≤ 0.9), in binary alloys with Ni, the linear variation extends up to x ≥ 0.65 (VEC ≥ 7.9) while for our alloys, it extends up to VEC = 7.4. The search for the origin of this difference is in progress.
ACKNOWLEDGMENTS
We thank Professor J.R. Cooper for useful suggestions and Professors E. Tafra and M. Basletić and Mr. M. Kuveždić for sharing their results prior to publication. Our research was supported by the project IZIP2016 of the University of Osijek. I.A. Figueroa acknowledges the financial support of UNAM-DGPA_PAPIIT, Project No. IN101016. We thank the Diamond Light Source for access to beamline I12 that contributed to the results presented here. A. Lachova acknowledges financial support of the grant VEGA 1/0036/16.