INTRODUCTION
The phylum Echinodermata consists of about 7000 species, which range from intertidal regions to deep waters (Ruppert & Fox, Reference Ruppert and Fox2004; Russell, Reference Russell2013). Holothuroidea is one of the five living classes of echinoderms, and represents roughly 20% of the total number of species (Russell, Reference Russell2013). Although echinoderms are considered exclusively marine, osmoconformers and stenohaline (Diehl, Reference Diehl1986), some species occur in hypo- or hypersaline waters (Russell, Reference Russell2013). In particular, 23 species of holothuroids occur in hyposaline waters. For instance, Cucumaria vegae was found in the Lynn Canal, Alaska, at salinity 13.5 psu. Six other species are reported to occur in hypersaline waters, for example, Leptosynapta chela in the Persian Gulf, at 55 psu (Binyon, Reference Binyon and Boolootian1966; Stickle & Diehl, Reference Stickle, Diehl, Jangoux and Lawrence1987; Russell, Reference Russell2013).
Salinity is one of the most important factors that determine the distribution patterns of echinoderms (Russell, Reference Russell2013). When exposed to fluctuations of salinity their coelomic fluid conforms to seawater salinity levels. However, these animals can maintain some osmotic and ionic gradients between their internal medium and external seawater (Binyon, Reference Binyon1962; Prusch, Reference Prusch1977; Diehl, Reference Diehl1986; Stickle & Diehl, Reference Stickle, Diehl, Jangoux and Lawrence1987; Vidolin et al., Reference Vidolin, Santos-Gouvea and Freire2007; Freire et al., Reference Freire, Santos and Vidolin2011). Different patterns of maintenance of ionic gradients are observed between species from different environments, sizes, and classes/body shapes (Stickle & Ahokas, Reference Stickle and Ahokas1974; Stancyk & Shaffer, Reference Stancyk and Shaffer1977; Diehl, Reference Diehl1986; Vidolin et al., Reference Vidolin, Santos-Gouvea and Freire2007; Barker & Russell, Reference Barker and Russell2008; Castellano et al., unpublished data). Size (surface/volume relationships) certainly play a role, but there is also consistent indication of differences between species of similar size, and differences in apparent permeability to different ions (Diehl, Reference Diehl1986; Stickle & Diehl, Reference Stickle, Diehl, Jangoux and Lawrence1987; Vidolin et al., Reference Vidolin, Santos-Gouvea and Freire2007; Freire et al., Reference Freire, Santos and Vidolin2011; Santos et al., Reference Santos, Castellano and Freire2013). The perivisceral coelomic fluid can also display different ionic concentrations with respect to another internal fluid compartment, the ambulacral fluid. Quite often the ambulacral fluid presents higher potassium concentration than the perivisceral coelomic fluid (e.g. Binyon, Reference Binyon1962; Prusch, Reference Prusch1977; Diehl, Reference Diehl1986).
When osmoconformers are exposed to a salinity change and, consequently, to a proportional change in the concentration of their coelomic fluid, their tissues are essentially submitted to the same osmotic challenge. In seawater dilutions, cells tend to gain water and lose solutes (they swell), and the opposite occurs under hypersaline conditions (they shrink) (Diehl & Lawrence, Reference Diehl and Lawrence1984; Häussinger, Reference Häussinger1996; Sardini et al., Reference Sardini, Amey, Weylandt, Nobles, Valverde and Higgins2003; Wehner et al., Reference Wehner, Olsen, Tinel, Kinne-Saffran and Kinne2003; Hoffmann et al., Reference Hoffmann, Lambert and Pedersen2009). In theory, salinity challenges induce tissue/cell volume regulation mechanisms: regulatory volume decrease (RVD) in the case of cell swelling, or regulatory volume increase (RVI) in the case of cell shrinking (Häussinger, Reference Häussinger1996; Sardini et al., Reference Sardini, Amey, Weylandt, Nobles, Valverde and Higgins2003; Hoffmann et al., Reference Hoffmann, Lambert and Pedersen2009). Previous studies have verified cell or tissue volume regulatory capacity in echinoderms. While this capacity has been shown to be negligible or subtle in some species, some degree of control of cell/tissue water/volume has been demonstrated in sea stars, sea urchins and holothurians (Lange, Reference Lange1964; Madrid et al., Reference Madrid, Zanders and Herrera1976; Shumway, Reference Shumway1977; Diehl & Lawrence, Reference Diehl and Lawrence1984, Reference Diehl and Lawrence1985; Foglietta & Herrera, Reference Foglietta and Herrera1996; Santos et al., Reference Santos, Castellano and Freire2013). In addition, different species have shown different responses, which indicate at least some capacity of tissue volume/water regulation in echinoderms (Shumway, Reference Shumway1977; Santos et al., Reference Santos, Castellano and Freire2013).
Holothuria grisea is a common intertidal sea cucumber along the Brazilian coast and is often found partly or entirely buried in sand among rocks. Although being frequently exposed to environmental challenges associated with the intertidal habitat, there is a paucity of data available on the physiology of holothuroids in this challenging environment. The question we ask is how this species reacts to the salinity challenges of the intertidal (both hypo- and hyperosmotic), in terms of coelomic fluid ions, general behaviour and tissue water regulation. The aim is to better understand the osmotic and ionic homeostatic adaptations of intertidal echinoderms.
MATERIALS AND METHODS
Species and sampling sites
The species used in this study was Holothuria grisea Selenka, 1867, common in the intertidal region. It can be submerged in tidal pools, or fully exposed during low tides. The species occurs in the Atlantic, in Central and South America, and is reported in West Africa. They are normally found down to 5 m depth (Hendler et al., Reference Hendler, Miller, Pawson and Kier1995). Holothuria grisea (total N = 113) were collected during low tide on the rocky shores of Paciência Beach (26°46′59″S 48°36′07″W), city of Penha, Santa Catarina State, Brazil. The average salinity of seawater at the collection sites was 33 psu. Measured salinities in intertidal pools in beaches of this city have been reported to vary between 5 and 39 psu within the hours of the tidal cycle, and upon different metereological conditions (Calil et al., Reference Calil, Rocha, Freire and Roper2009).
Transport and acclimation to laboratory conditions
Specimens were transported wrapped in seaweed inside a styrofoam box for maintenance of temperature and humidity. The journey took about 3 h, to the laboratory of Comparative Physiology of Osmoregulation, Department of Physiology, city of Curitiba, State of Paraná, Brazil. Animals were acclimated for 5–7 days in a stock tank (50 l capacity) in standard full-strength seawater of 35 psu (measured with a Shibuya S28 refractometer, Japan), 20 °C ± 2, pH 8.2 (assessed through an inoLab pH meter, Germany), aeration and constant filtration, and natural photoperiod (~12 h light:12 h dark). Seawater salinity was adjusted with the addition of sea salt (Instant Ocean, commercially available in pet shops). Animals were fed ad libitum with substrate (sand) rich in organic matter (dehydrated algae were added to the substrate).
Experiments of stepwise dilution or concentration of seawater
Animals were submitted to gradual challenges of seawater dilution (from 35 to 15 psu, at a rate of 3 psu per hour) and concentration (from 35 to 45 psu, at a rate of 2 psu per hour), N = 8 for both experiments, in containers of 1.5 l. Each replicate was one sea cucumber in a separate 1.5 l container. There was no mortality or evisceration in any of the experiments. All individuals stayed on the bottom of the container, and the water was totally changed after each hour. For the control animals, salinity was kept at 35 psu, but water was also changed after each hour (N = 10). Different individuals were used for each condition (seawater dilution, seawater concentration and control in seawater). Coelomic fluid (CF) samples (~500 µl) were obtained through puncture of the body wall using insulin syringes, immediately at the end of the 1-h exposure to each salinity level. Each individual was punctured and had its coelomic fluid sampled several times, every 1-h interval (1 sample/salinity change). Samples of aquarium water were also collected for ionic measurements (N = 2 for control, N = 2 for seawater dilution, N = 4 for seawater concentration). CF and water samples were stored at −20 °C until assayed. Dilute seawater was prepared by the addition of filtered dechlorinated tap water, and concentrated seawater was prepared by the addition of commercial marine salt to seawater. Photographs were taken at the end of the experiments, so that body shape could be evaluated after salinity challenges, at the lowest and the highest salinity levels tested, and also in control salinity. Observations on body shape were not systematically performed along stepwise experiments, but just at the end of each experiment.
Ionic assays of the coelomic fluid and aquaria water
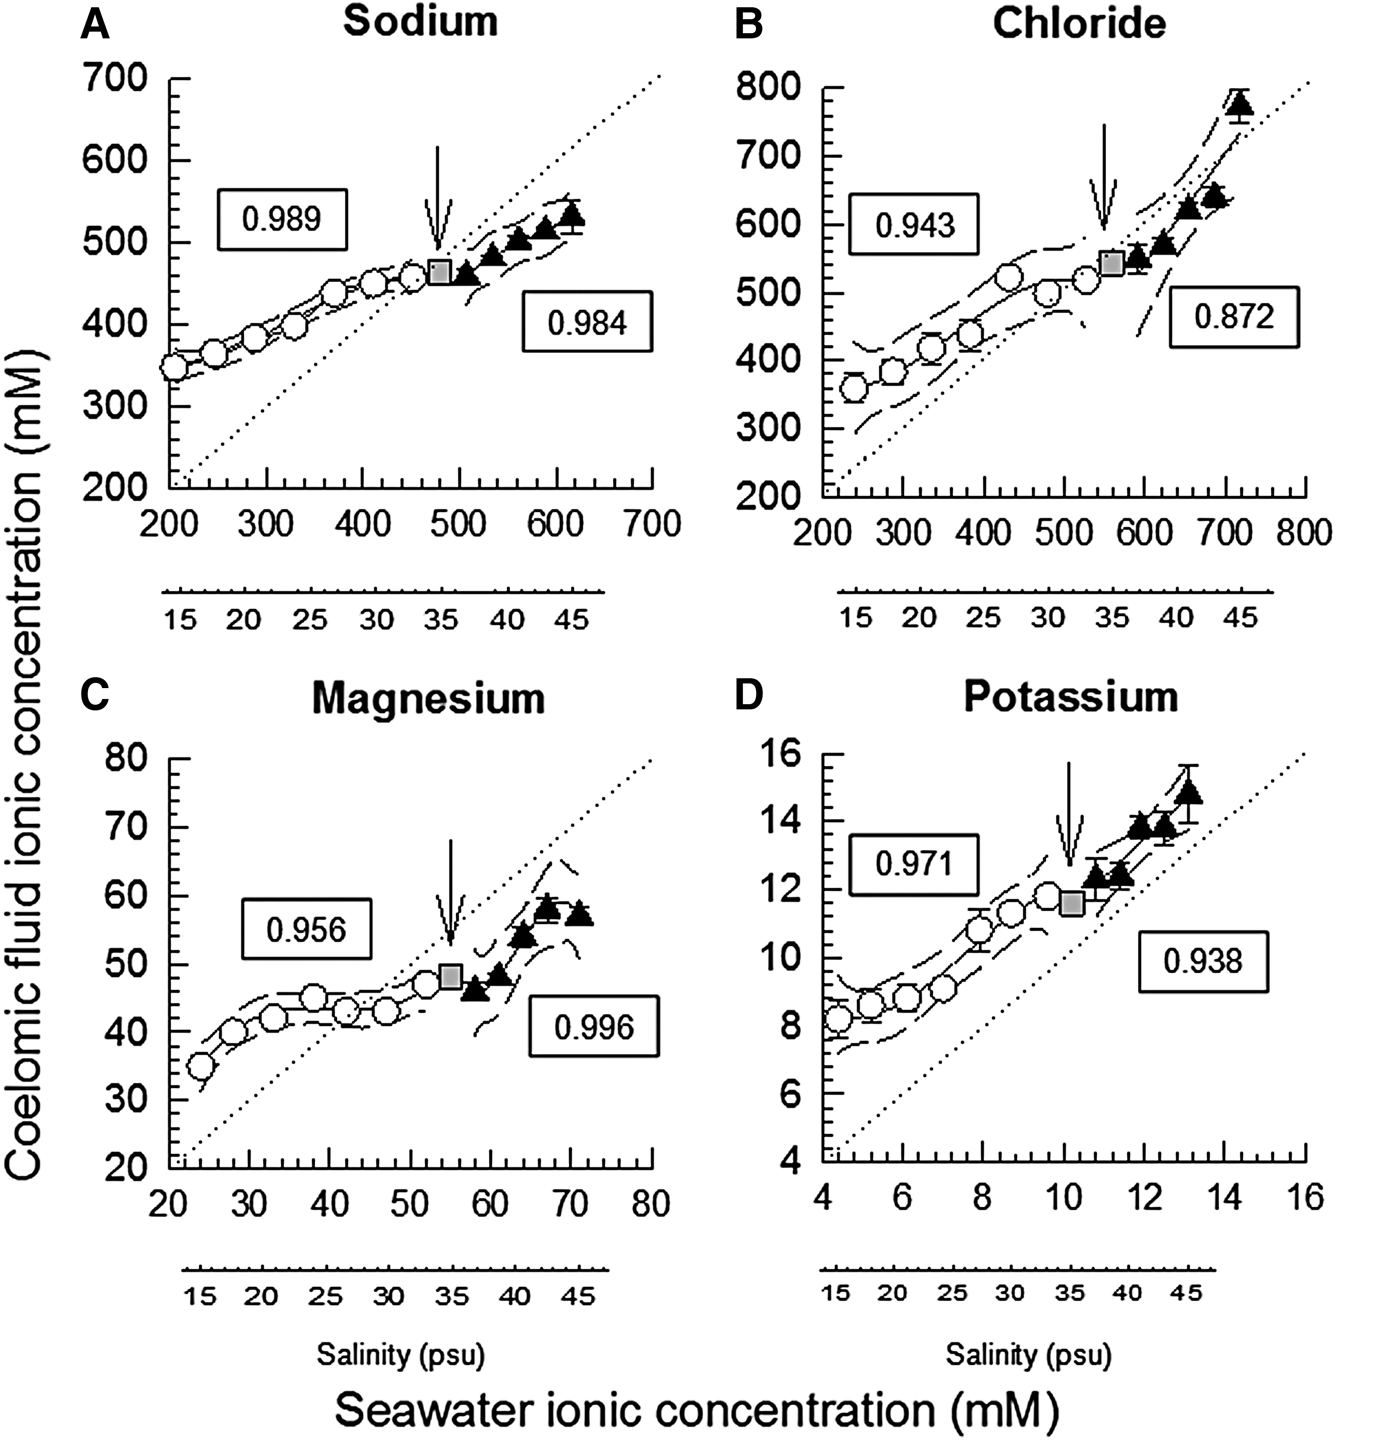
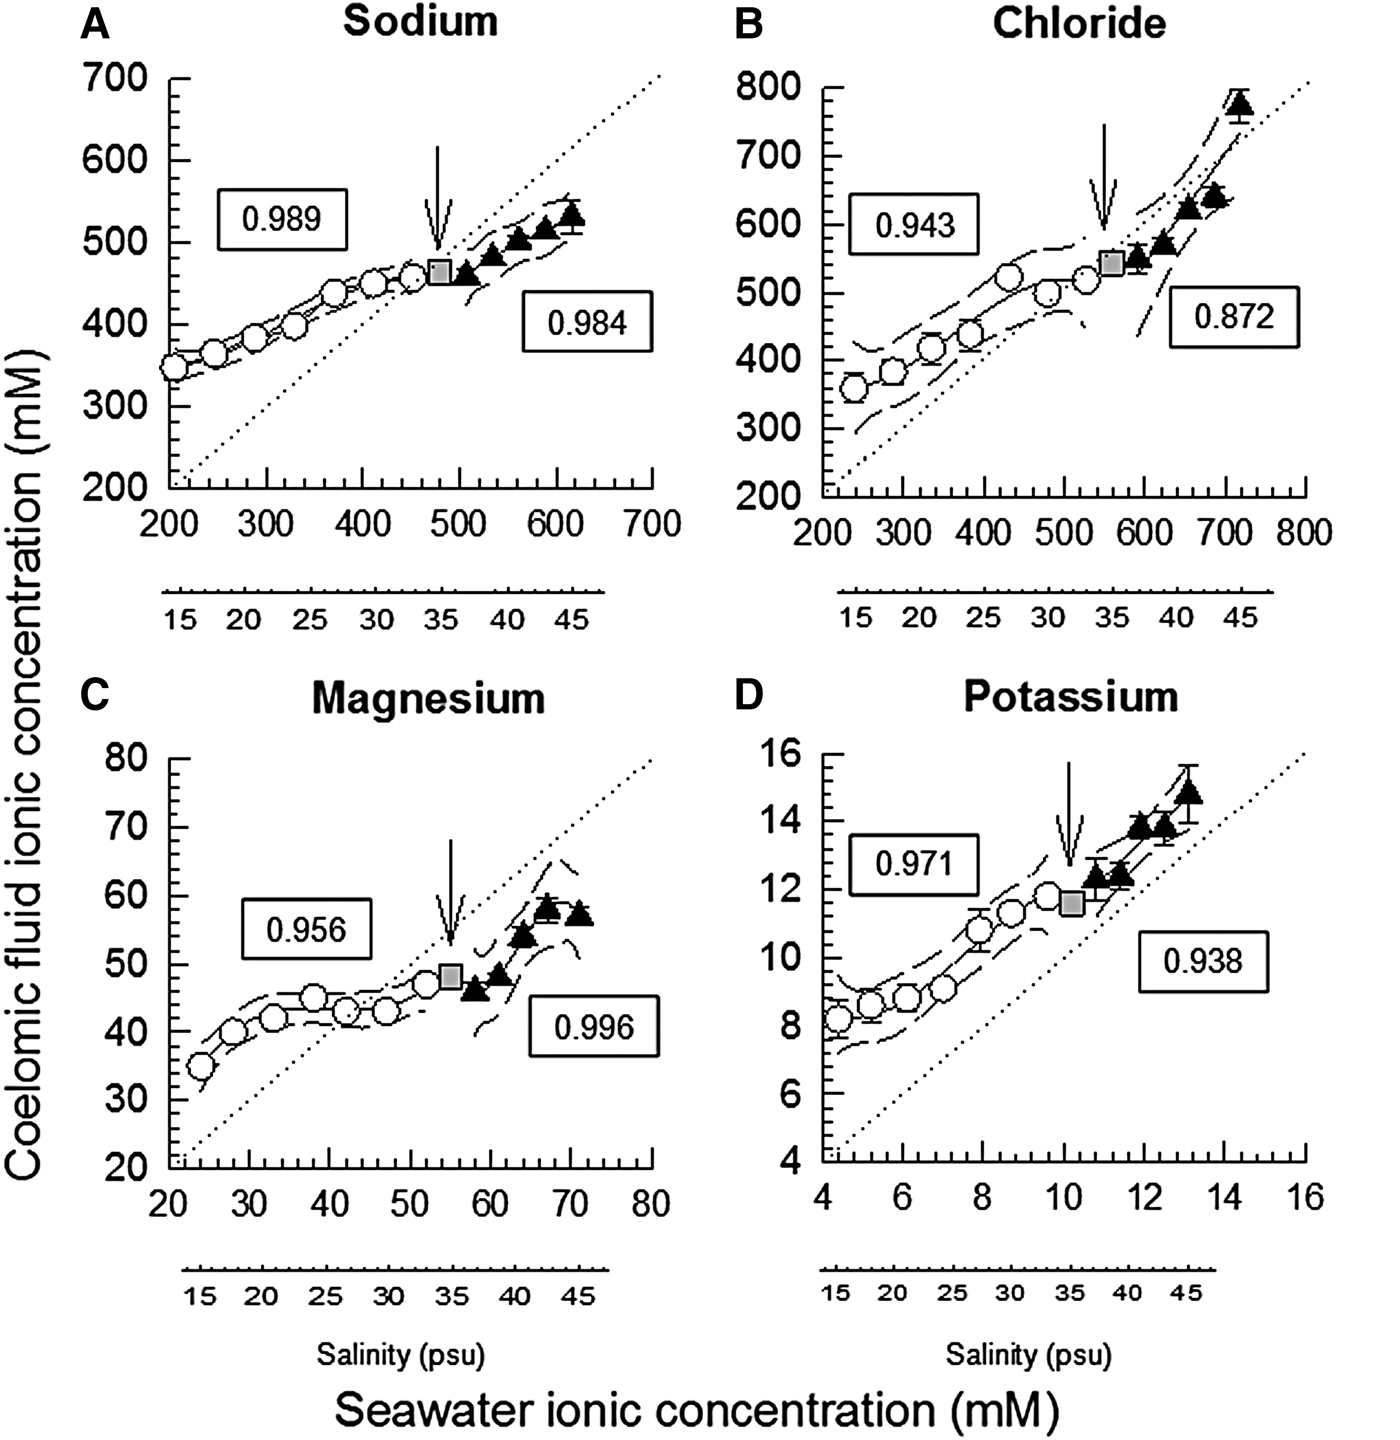
Ionic concentrations of sodium, chloride, magnesium and potassium were measured in coelomic fluid (CF) samples (appropriately diluted in deionized water). Colorimetric commercial kits (Labtest, Brazil) were used for the assays of chloride and magnesium (N = 7–8 animals/samples for each ion), and absorbance was read (Ultrospec 2100 PRO Amersham Pharmacia Biotech) at 470 and 505 nm, respectively. Sodium and potassium (N = 4–10 animals/samples for each ion) were assayed using flame photometry (Micronal B462, Brazil). As in Santos et al. (Reference Santos, Castellano and Freire2013), ionic concentrations (chloride and magnesium only) of aquarium water samples (N = 2) were measured and compared (95% confidence intervals) with expected standard seawater ionic values provided in Prosser (Reference Prosser1973). For 70% of the experimental conditions, measured values included expected (Prosser, Reference Prosser1973) values. As measured values include experimental error, and signals are very faint in echinoderms, gradients between CF and external water were estimated with respect to Prosser (Reference Prosser1973) values, as plotted in Figure 1.
Coelomic fluid sodium (N = 4–10, A), chloride (N = 7–8, B), magnesium (N = 6–8, C) and potassium (N = 4–10, D) concentrations (mean ± SEM, mM) of the holothurians H. grisea relative to seawater ionic concentrations, at each salinity tested (additional salinity scale placed below each graph, for reference). The iso-ionic line is indicated by the dashed line. Polynomial regression lines were fitted to the data, with the respective 95% confidence intervals. Separate regressions were adjusted for the experiment of stepwise dilution of seawater (white circles), and the experiment of stepwise concentration of seawater (black squares). Initial salinity (35 psu) is plotted as a grey square, and highlighted by a vertical arrow. The r 2 value of the adjusted polynomial is indicated in the framed text box near the line. Seawater ionic (sodium, chloride, magnesium and potassium) values were calculated from standard seawater ionic values of Prosser (Reference Prosser1973). When error bars do not appear, they are smaller than the symbols.
Tissue water regulation
In this approach, isolated tissues of sea cucumbers were submitted ‘in vitro’ to salines of different concentrations: an isosmotic control (~1050 mOsm/kg.H2O), two levels of hyposmotic shock (20 and 50% with respect to the isosmotic) and two levels of hyperosmotic shock (also 20 and 50% with respect to the isosmotic). Experimental salines thus represented 50, 80, 120 or 150% of the control saline (considered 100%; see composition of all salines in Table 1). To this purpose, another set of sea cucumbers was directly removed from the stock tank (35 psu), were cryoanaesthetized in freezer at −20 °C for 15 min and then dissected. Samples of tissues were removed: longitudinal muscle (5 samples from each animal, total N = 9), oesophagus (1 sample from each animal, N = 8 for each saline, total N = 40), and posterior intestine (1 sample from each animal, N = 8, the same 40 animals used for oesophagus sampling). Tissue samples were transferred to the isosmotic saline in a 10 ml beaker, in which the tissue slices remained for ~30 min for cellular acclimation (temperature of ~20 °C). Each tissue slice was then carefully blotted on filter paper, and either transferred to a control or experimental saline, in a 10 ml beaker. Water content of the tissue slices (thus, wet weight) was evaluated every 15 min, along 75 min of exposure to the salines, using the protocol of Amado et al. (Reference Amado, Freire and Souza2006). Each tissue slice sample was blotted and weighed (analytical balance Bioprecisa FA2104N, Brazil, precision of 0.1 mg) at time zero, and then again every 15 min, until the final time of 75 min. Initial weight of each tissue slice was the reference value (100%) for the subsequent weights.
Composition of the salines used in the experiments of tissue water regulation.

a Concentration of all salts in mM. The following components were added to all buffers: D-glucose (5 mM), glycin (5 mM), HEPES acid (5 mM) and NaHCO3 (2 mM). In all buffers, pH was adjusted to 8.2. Osmolality of the buffers was measured in 1 or 2 samples.
Statistical analysis
Regression polynomials of different degrees were fitted to each set of data of CF ionic levels, chosen to result in the highest r 2 coefficient, using the Sigma Plot® 11 software. CF ionic concentrations were compared with the isoionic line which represented proportional dilutions of Prosser's (Reference Prosser1973) standard seawater levels, through 95% confidence intervals traced along with the polynomials (Figure 1). One way (repeated measures) RM ANOVA (for normal data) or Friedman (for data that did not meet normality requirements) tests were performed with control data of sea cucumbers held in salinity 35 psu to verify if there was any effect of manipulation and puncturing the body wall every hour along the experimental time course, on the coelomic fluid ionic concentrations (post hoc tests were respectively Holm-Sidak and Tukey, significance level of 0.05). Tissue hydration data were analysed through 95% confidence intervals. Experimental means were verified for the inclusion of the value ‘100%’ along the time of exposure to each saline, starting in time 15 min, and whether they included the mean of the controls for the same time.
RESULTS
Experiments of stepwise dilution or concentration of seawater
Control data (sea cucumbers in full-strength 35 psu seawater) showed that manipulating and puncturing the body wall of H. grisea had no major effect on the ionic concentrations of sodium (460 and 450–495 mM, median and 25–75% quartiles, N = 48 determinations; P = 0.586). For chloride (480 ± 9.3 mM, mean ± SEM, N = 61; P = 0.012) and potassium (12.8 ± 0.3 mM, N = 48, P = 0.033), there was indication of the effect of time/puncturing the body wall, but the post hoc test of Holm Sidak did not localize the differences. However, magnesium varied from 51 mM in time 0 down to 42–43 mM in times 2, 3, 6 and 7 h (medians, P < 0.001). The distance between the polynomials of coelomic fluid CF concentration and the isoionic line was higher under dilution than under seawater concentration, for sodium, chloride and potassium ions. For magnesium this distance was similar under dilution and concentration (Figure 1).
For sodium the 95% confidence interval traced lines included the isoionic line only in salinity 33. Concentration of sodium of the CF was higher than the isoionic line in salinities below 33, and was lower than the isoionic line in salinities above 35. In summary, ‘hyper-regulation’ was verified under dilution, while ‘hyporegulation’ was observed upon exposure to increased salinities (Figure 1A). For chloride the CF was similar to the isoionic line in salinities 30, 33, 37, 39, 41 and 43. However, hyper-regulation occurred in salinities ≤30 psu, and hyporegulation occurred in salinity 45 psu (Figure 1B). In salinities ≤27 psu CF magnesium was higher than the isoionic line, and the opposite occurred in salinities ≥30 psu (Figure 1C). CF potassium concentration was higher than the isoionic line, for all salinities tested, in both experiments (Figure 1D).
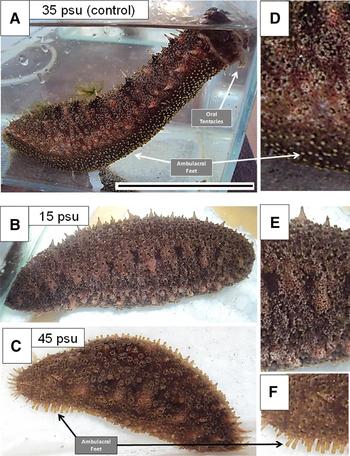
Under control conditions, tube feet and tentacles of H. grisea are totally exposed (Figure 2A). After the stepwise exposure to seawater dilution, a pronounced retraction of tentacles and ambulacral feet was observed, and swelled bodies with a bulky and rigid appearance were observed, in all individuals (Figure 2B). After the exposure to hyperosmotic seawater, the retraction of tentacles and ambulacral feet was also noted, in all individuals, but distinctly to a minor degree than under the hyposmotic challenge (Figure 2C).
Representative individuals of H. grisea at the end of the experiments: 8 h for the control (salinity 35, A), stepwise seawater dilution experiment (salinity 15, B), or 6 h for the stepwise seawater concentration experiment (salinity 45, C). A close up of the body wall of animals A, B, C, with different degrees of retraction of ambulacral feet can be observed in D, E and F, respectively. Scale bar (A, B, C) = 10 cm.

Tissue water regulation
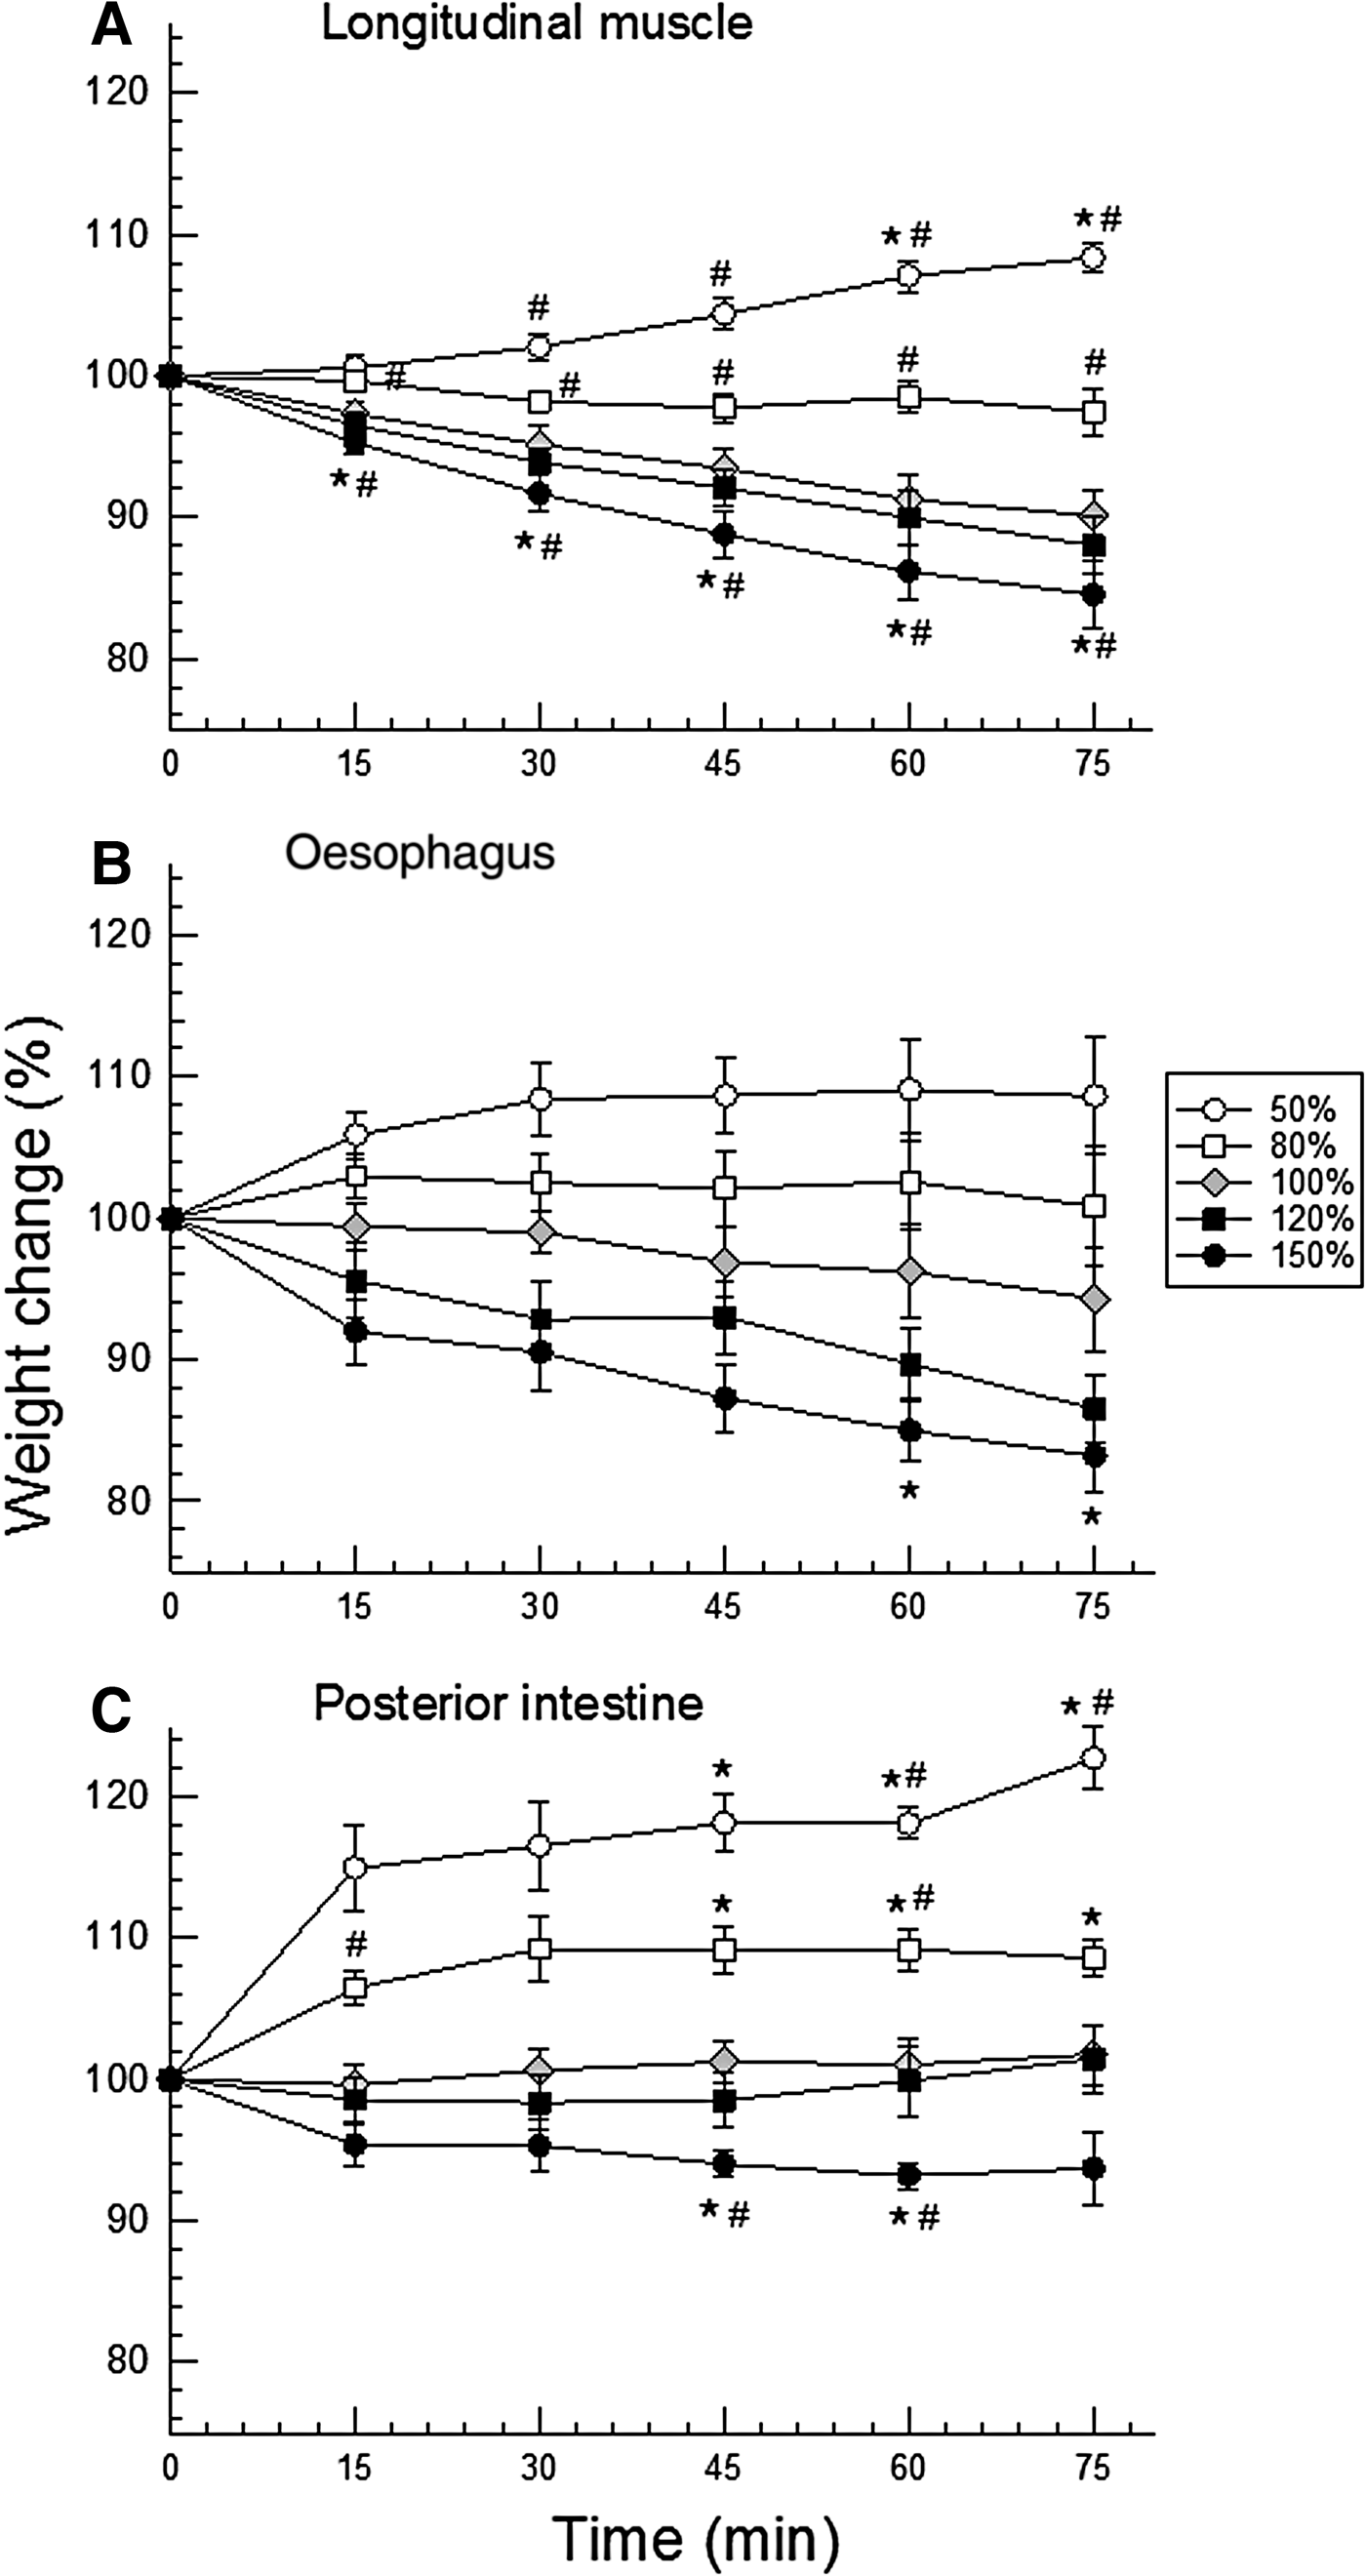
Different tissues showed slightly different responses, apparent mainly at the beginning of the time course of the experiments (15 min). This difference was reflected in the slope of the lines connecting the initial value (100% for all) to the value of 15 min (Figure 3). At this initial time, hydration of longitudinal muscle was the most stable among the three tissues, under the osmotic shocks offered: weight/volume ranged ~95–101% (Figure 3A). The oesophagus showed intermediate weight variation (range ~92–106%, Figure 3B), and the posterior intestine was the least stable, especially upon hyposmotic shock (range ~95–115%, Figure 3C).
Time course of tissue hydration (mean ± SEM, N = 8–9) of longitudinal muscle (A), oesophagus (B), and posterior intestine (C) of H. grisea under both hyposmotic (white symbols) and hyper-osmotic (black symbols) shocks of 20 (squares) and 50% (circles) of dilution or concentration with respect to the isosmotic control saline/buffer (grey diamonds). Symbols indicate: * = 95% confidence interval does not include the value ‘100%’, time zero, along the experiment (15, 30, 45, 60, and 75 min), in the same saline; # = 95% confidence interval does not include the respective control value.
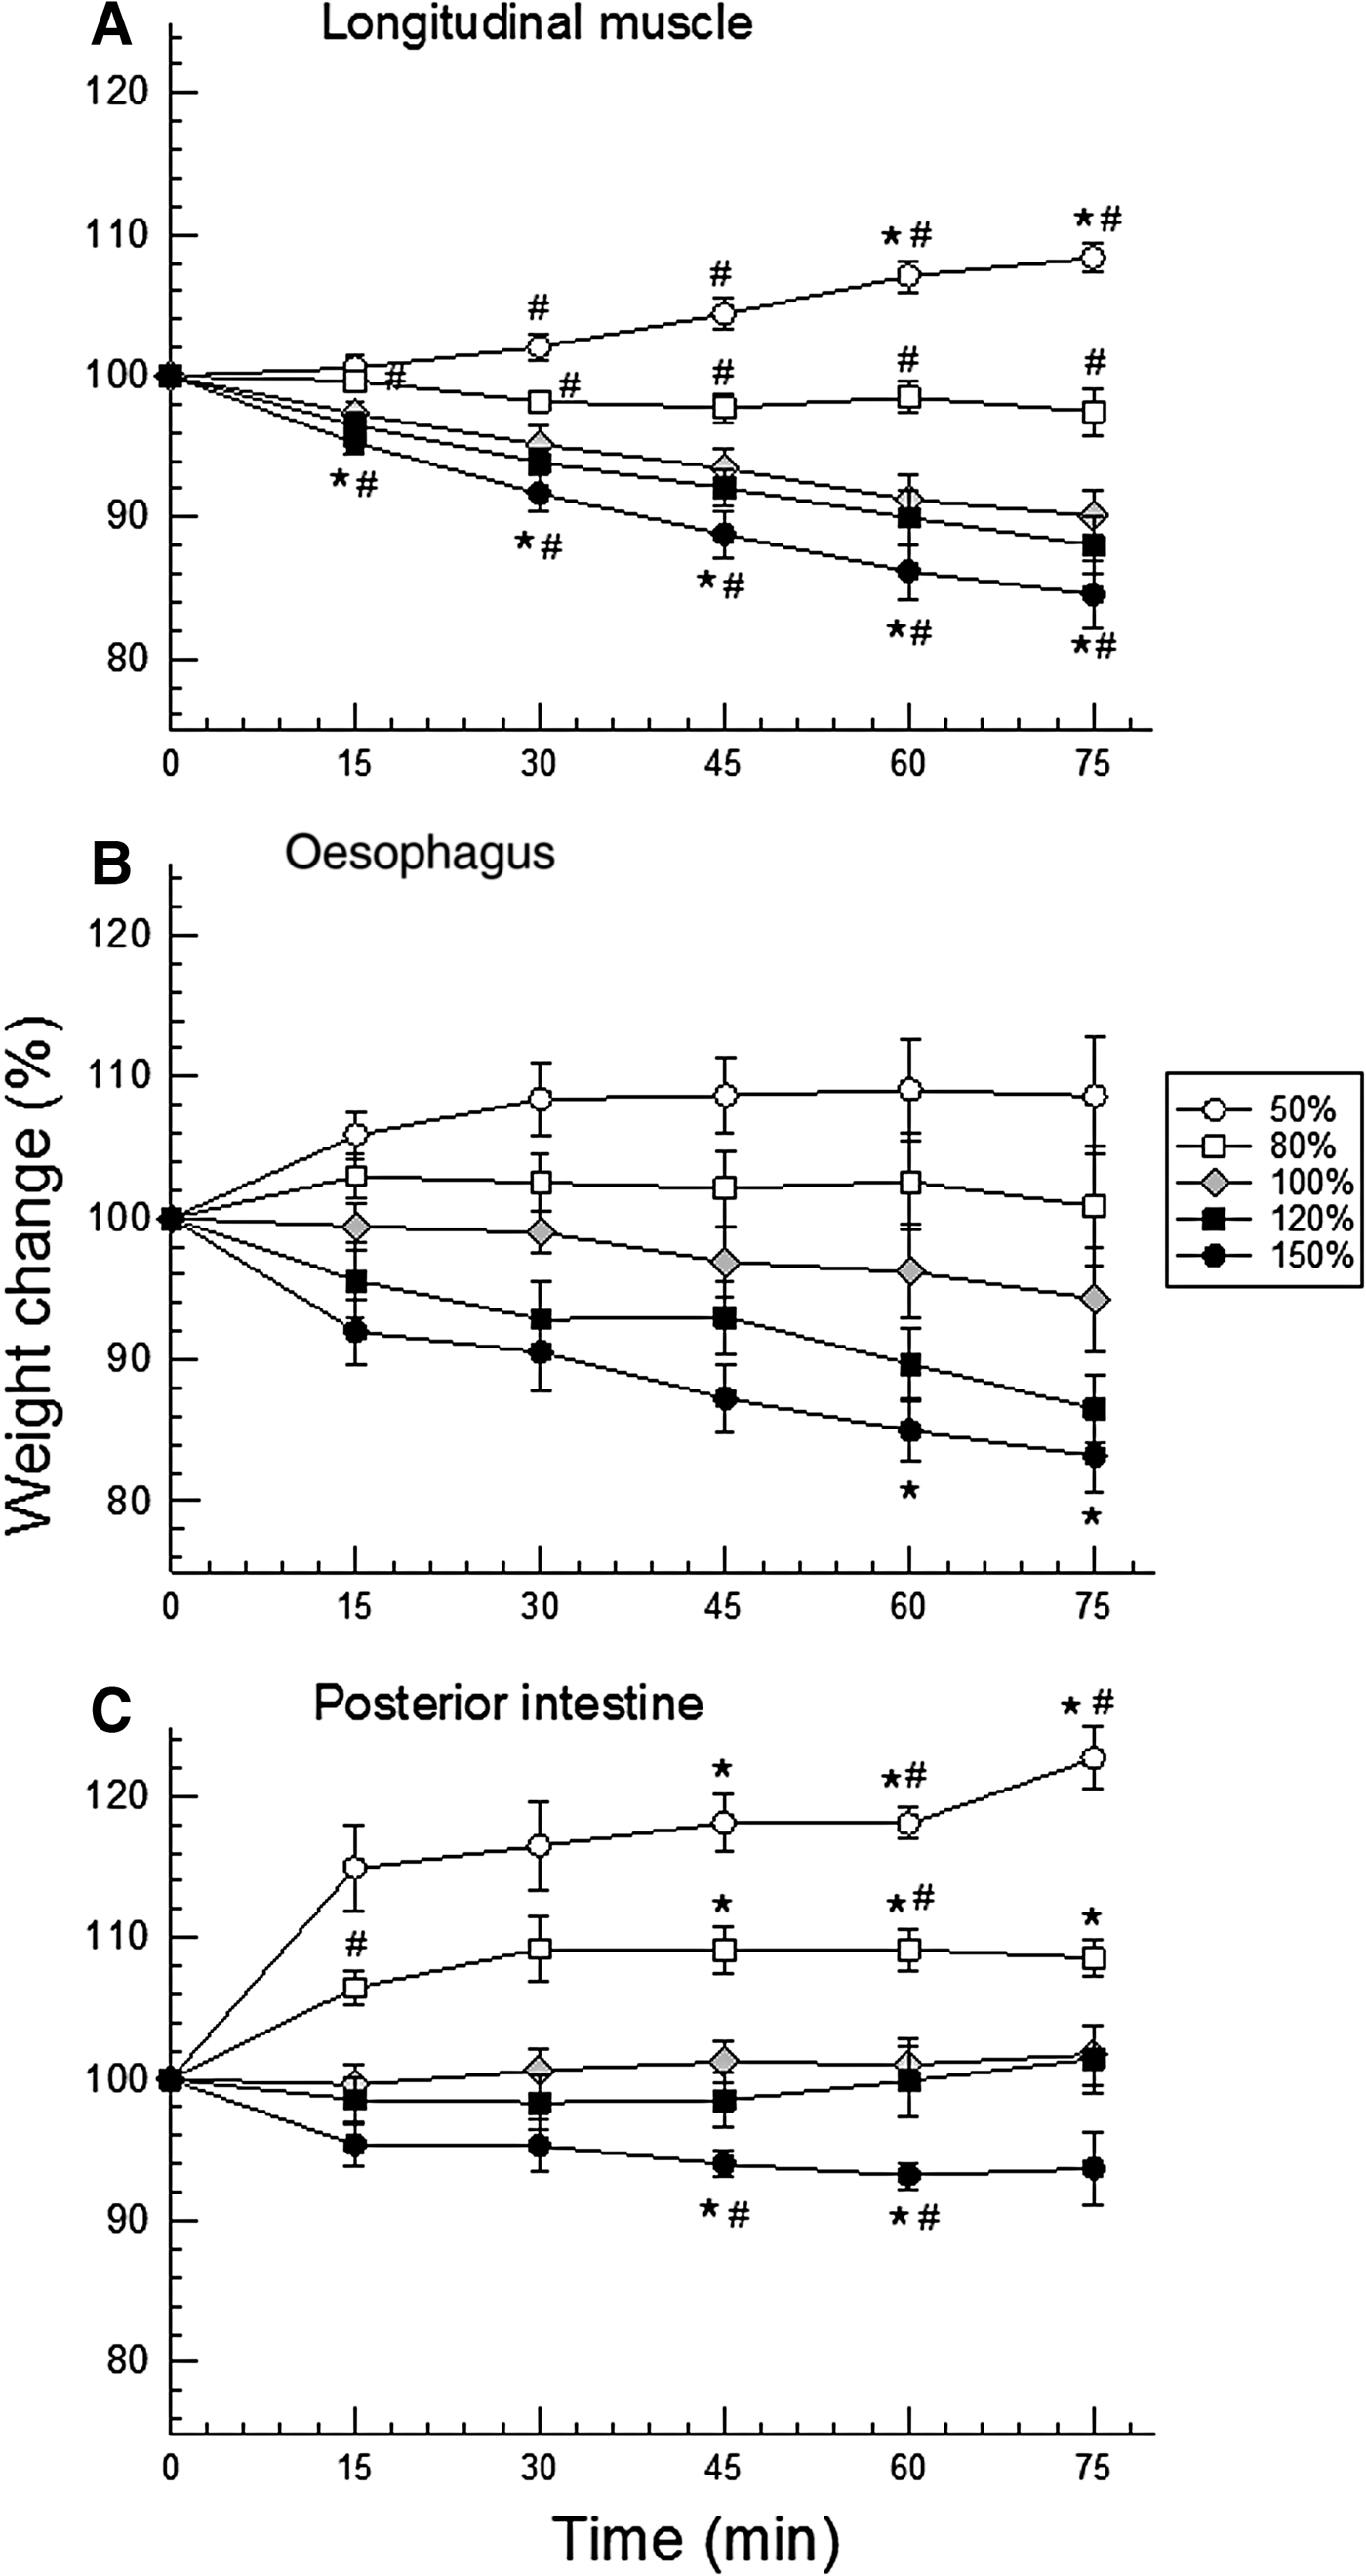
Confidence intervals showed muscle and intestine swelling in both hyposmotic conditions, and shrinking only in the most concentrated saline (respectively Figure 3A, C). However, more differences were detected in muscle. Given to high data variability (SEM), the only difference noted in the oesophagus was the shrinking in the final minutes of the experiment (60–75 min) of exposure to the most concentrated saline (150% saline, Figure 3B).
DISCUSSION
In the intertidal habitat, H. grisea is exposed daily to salinity oscillations (Vidolin et al., Reference Vidolin, Santos-Gouvea and Freire2002; Mendes et al., Reference Mendes, Marenzi and Di Domenico2006). Upon stepwise salinity challenges, H. grisea kept significant ionic gradients upon dilution, more frequently than upon seawater concentration. This result is consistent with our observation of tube feet retracted in low salinity, but extended in high salinity. Finally, H. grisea maintained tissue hydration more efficiently under hyper- than under hyposmotic shocks, in all tissues tested (Figure 3).
Ionic gradients and change in body shape at the end of the experiments
Along the stepwise protocol of seawater dilution or concentration, coelomic fluid (CF) ionic gradients were noted, mainly for potassium, followed by magnesium, then sodium, and finally chloride. Small osmotic or ionic gradients were observed for other species of sea cucumbers, as in Madrid et al. (Reference Madrid, Zanders and Herrera1976), Dong et al. (Reference Dong, Dong and Meng2008), Meng et al. (Reference Meng, Dong, Dong, Yu and Zhou2011, Reference Meng, Dong and Dong2015) or Wang et al. (Reference Wang, Yu, Qin, Dong and Dong2014).
Gradients of potassium and magnesium are really more frequent in echinoderms than gradients of sodium and chloride (Robertson, Reference Robertson1949, Reference Robertson1953; Prusch & Whoriskey, Reference Prusch and Whoriskey1976; Prusch, Reference Prusch1977; Pagett, Reference Pagett1980; Bishop et al., Reference Bishop, Lee and Watts1994; Freire et al., Reference Freire, Santos and Vidolin2011). This response gradient (distance to the isoionic line) is apparent at the final time of exposure under the stepwise dilution (15 psu). The different degrees of the gradients maintained can indicate differential permeabilities and/or differential transport of the different ions (Binyon, Reference Binyon and Boolootian1966; Bishop et al., Reference Bishop, Lee and Watts1994; Vidolin et al., Reference Vidolin, Santos-Gouvea and Freire2007; Freire et al., Reference Freire, Santos and Vidolin2011). Although rarely studied, ionic transporters have been reported in sea urchins (Leong & Manahan, Reference Leong and Manahan1997, Reference Leong and Manahan1999; D'Andrea-Winslow et al., Reference D'Andrea-Winslow, Strohmeier, Rossi and Hofman2001). Our results showed magnesium had a distinctly different response than the other ions. It showed a pattern of apparent regulation/homeostatic control, between salinities 21 and 39 psu (Figure 1C). This is consistent with the detected reduction in CF magnesium in control holothurians that were repeatedly sampled but remained in 35 psu seawater. This result of magnesium disturbance in the controls that have been repeatedly punctured with a needle may relate to a physiological role of magnesium in affecting the stiffness and viscosity of mutable connective tissue of echinoderms (Hidaka, Reference Hidaka1982; Hayashi & Motokawa, Reference Hayashi and Motokawa1986; Motokawa, Reference Motokawa1984, Reference Motokawa1994). These findings on magnesium should be further investigated under complementary approaches and techniques.
In the current study, potassium CF levels were maintained significantly above water values in all salinities, as also reported for Holothuria tubulosa (Robertson, Reference Robertson1953). In agreement, gradients of potassium are systematically found in echinoderms exposed to salinity changes (Robertson, Reference Robertson1949; Binyon, Reference Binyon1962; Lange, Reference Lange1964; Stickle & Ahokas, Reference Stickle and Ahokas1974; Stickle & Denoux, Reference Stickle and Denoux1976; Prusch, Reference Prusch1977; Pagett, Reference Pagett1980; Diehl, Reference Diehl1986; Vidolin et al., Reference Vidolin, Santos-Gouvea and Freire2007; Freire et al., Reference Freire, Santos and Vidolin2011; Santos et al., Reference Santos, Castellano and Freire2013). Asterias forbesi, a starfish adapted to diluted waters (15 psu), as in the Baltic and North Seas, shows chloride and potassium concentrations in ambulacral feet above values measured in seawater (Prusch, Reference Prusch1977). The same pattern was reported for its congener, A. rubens (Binyon, Reference Binyon1962). This is proposed to reflect a strategy that allows the maintenance of hydrostatic pressure in the water vascular system or in the coelomic fluid compartment (Prusch & Whoriskey, Reference Prusch and Whoriskey1976; Prusch, Reference Prusch1977; Stickle & Diehl, Reference Stickle, Diehl, Jangoux and Lawrence1987). In addition, the holothuroid has a reduced endoskeleton, a soft body. Thus, the coelomic compartment can function as a hydrostatic skeleton, its hydrostatic pressure is fundamental (Prusch, Reference Prusch1977).
Interestingly, a total retraction of ambulacral feet and oral tentacles were observed upon stepwise dilution of seawater. However, upon the experiment of stepwise concentration of seawater, many ambulacral feet remained exposed. A purely passive osmotic effect of salinity would not lead to this situation. In dilute seawater, water influx would make tube feet swell and become more turgid, more exposed. The above-mentioned higher potassium concentration in the ambulacral system would also potentially contribute to water influx and swelling of the feet in dilute seawater. But tube feet swelling and exposure was not observed. Conversely, in concentrated seawater, water efflux would make tube feet shrink, and become more flaccid, which did not happen. Ambulacral feet represent an interface and exchange epithelium with environmental water (Robertson, Reference Robertson1949; Boolootian, Reference Boolootian1966; Santos-Gouvea & Freire, Reference Santos-Gouvea and Freire2007), and the retraction of these feet can be a strategy to avoid such exchanges, reducing apparent body wall permeability. In addition, salinity reductions are more frequent in the intertidal region than salinity increases (Diehl, Reference Diehl1986; Stickle & Diehl, Reference Stickle, Diehl, Jangoux and Lawrence1987). Thus, the behavioural response can be an adaptive strategy of H. grisea, as an intertidal dweller, to avoid seawater dilution events. This behavioural response is entirely consistent with the CF gradients detected. If this is a sort of an escape response upon seawater dilution, it may at least in part account for the higher degrees of ionic CF gradients maintained in low salinity seawater. This response, with the resulting CF gradients, would reduce tissue swelling in low salinity. In Holothuria leucospilota, a contraction of the dermis was reported, when the holothurians were exposed to distilled water (Hayashi & Motokawa, Reference Hayashi and Motokawa1986). The behaviour observed in the current study can be, beyond ambulacral feet retraction and an apparent muscle contraction, also a result of change in the consistency of mutable connective tissue, as a response to a diluted media (Eylers, Reference Eylers1982; Motokawa, Reference Motokawa1984; Hayashi & Motokawa, Reference Hayashi and Motokawa1986). With respect to seawater concentration, as the water salinity increases, so does its magnesium concentration. Magnesium has an anaesthetic property (e.g. García-Franco, Reference García-Franco1992), which can delay the behavioural response of isolation.
More complex behaviours related to salinity changes were already registered for echinoderms. Juveniles of Holothuria scabra burrow themselves under salinity reduction from 35 psu to 30, 25, and 20 psu (Mercier et al., Reference Mercier, Battaglene and Hamel1999). Holothuria arenicola is commonly observed buried in intertidal sites which become exposed during low tide (Mosher, Reference Mosher1980). Luidia clathrata curled up the arms when transferred from salinity 25 psu (control) to 35 psu (Diehl & Lawrence, Reference Diehl and Lawrence1984). Strongylocentrotus droebachiensis moves to crevices under salinity reductions caused by heavy rainfall (Vadas et al., Reference Vadas, Elner, Garwood and Babb1986). All behaviours mentioned seem to represent an avoidance or escape response to stressful environmental conditions, here, for H. grisea, especially low salinity.
Tissue water control
All isolated tissues of H. grisea exposed to osmotic shocks maintained their hydration to a certain degree, with less than 20% variation (except for final time of exposure of posterior intestine to 50% saline), but mainly under hyperosmotic conditions. Muscle tissue showed a more delayed response, especially for swelling in hyposmotic salines, and relatively low variability within each group. As a result, it was the tissue for which most weight/hydration differences were detected. Holothurian muscle is the most robust and least fragile of all three tissues tested, and this certainly relates to its lower internal variability in tissue hydration. This affected the result of the statistical analysis using confidence intervals; oesophagus data were the most variable, and as a consequence, no differences were detected. In any case, the main result was that all tissues showed more swelling than shrinkage. This ability to control hydration most probably involves the control of concentrations of organic (amino acids) and/or inorganic (ions) osmolytes, through their transport (organic and inorganic), synthesis or oxidation (organic) (Pierce, Reference Pierce1982; Diehl & Lawrence, Reference Diehl and Lawrence1985; Diehl, Reference Diehl1986; Hoffmann & Dunham, Reference Hoffmann and Dunham1995; Wehner et al., Reference Wehner, Olsen, Tinel, Kinne-Saffran and Kinne2003), and resulted in tissue water maintenance.
The ability of H. grisea to control tissue hydration is likely a response of an osmoconformer to the challenges of the euryhaline intertidal habitat. Tissue hydration control (or tolerance to its wide variation) can be considered highly adaptive for osmoconformers (Foster et al., Reference Foster, Amado, Souza and Freire2010). Holothuria grisea maintains some extracellular ionic gradients, but these are lower than those recorded for the sea urchins Echinometra lucunter, Lytechinus variegatus and Arbacia lixula under the same experimental protocols (Santos et al., Reference Santos, Castellano and Freire2013). In addition, gradients observed in H. grisea are probably transient, as typical for echinoderms (Diehl, Reference Diehl1986), and as discussed in Santos et al. (Reference Santos, Castellano and Freire2013) for the urchins. These gradients would probably not be as apparent if the holothurians would be abruptly exposed to 25 psu or less, 45 psu or higher (see Santos et al., Reference Santos, Castellano and Freire2013). On the other hand, given the flexibility of the body wall of the holothurians, perhaps an abrupt exposure to an osmotic shock, especially seawater dilution, would lead to tube feet retraction and muscular contraction, and reduced apparent permeability to water and ions, and consequent establishment of CF ionic gradients.
Responses upon hypo- and hypersaline challenges
Holothuria grisea showed an apparent avoidance behaviour under seawater dilution, which seems to bring on steeper ionic gradients upon seawater dilution than upon seawater concentration. This response is probably associated with the lower degree of tissue hydration control in hyposmotic conditions. It seems that tissue hydration control is the strategy used by H. grisea under hypersalinity conditions. We did not observe avoidance behaviour under these conditions but did measure concentrated coelomic fluid from the sustained ionic gradients. These responses are consistent among echinoderms. It has been shown for other holothurians, such as Apostichopus japonicus, Isostichopus badionotus, for the starfish Luidia clathrata, and the sea urchins Echinometra lucunter, Lytechinus variegatus and Arbacia lixula: they all also maintain a more constant tissue hydration under hyperosmotic than under hyposmotic conditions (Madrid et al., Reference Madrid, Zanders and Herrera1976; Diehl & Lawrence, Reference Diehl and Lawrence1984; Foglietta & Herrera, Reference Foglietta and Herrera1996; Santos et al., Reference Santos, Castellano and Freire2013).
These behavioural and physiological strategies mean significant euryhalinity for these intertidal echinoderms, compatible with their habitat and frequent exposure to environmental/salinity challenges. In summary, this typical marine osmoconformer avoids hyposaline conditions, contracting its body and retracting its tube feet, resulting in higher stability of CF ionic levels (gradients), as it shows less capacity to control tissue hydration under hyposmotic conditions. It behaves in a more ‘relaxed state’ in high salinity, keeping higher permeabilities, lower gradients, but accompanied by a higher capacity to regulate tissue hydration.
ACKNOWLEDGEMENTS
The authors wish to acknowledge the dedication and many valuable suggestions of both reviewers.
FINANCIAL SUPPORT
Authors gratefully acknowledge the Brazilian Federal Sponsor CNPq for fellowships awarded to IAS (doctorate), GCC (107985/2008-0) and CAF (306630/2011-7).