Introduction
Depression affects 322 million people (4.4%) worldwide, although the prevalence is highest among middle-aged to older adults (55–74 years), particularly women (World Health Organization, 2017). Between 2009 and 2012, 7.6% of US individuals ƒ12 years were categorized with depression, and women, middle-aged to older adults (40–59 years), and persons living below the poverty line experienced higher prevalence (Pratt & Brody, Reference Pratt and Brody2014). Consequently, depression is the leading contributor to disability globally (World Health Organization, 2017), and a significant factor affecting chronic disease management (Chapman, Perry, & Strine, Reference Chapman, Perry and Strine2005). Non-Hispanic black and Hispanic older adults have higher prevalence of subthreshold and major depression compared to non-Hispanic white older adults (Xiang, Leggett, Himle, & Kales, Reference Xiang, Leggett, Himle and Kales2018). Furthermore, racial and ethnic minorities have poor access to mental health care, leading to undiagnosed depression and inadequate treatment (Kim, Reference Kim2014) that can exacerbate chronic disease and its management.
Depression has been viewed both as an independent determinant (Poole & Steptoe, Reference Poole and Steptoe2018) as well as a comorbidity of chronic diseases (O'Connor et al., Reference O'Connor, Vizcaino, Ibarra, Balcazar, Perez, Flores and Anders2015), as persons with chronic medical conditions also have a high prevalence of depressive disorders (Benton, Staab, & Evans, Reference Benton, Staab and Evans2007). Individuals with chronic diseases are at an increased risk of depression or depressive symptoms (Chang-Quan, Bi-Rong, Zhen-Chan, Ji-Rong, & Qing-Xiu, Reference Chang-Quan, Bi-Rong, Zhen-Chan, Ji-Rong and Qing-Xiu2010a; Chang-Quan et al., Reference Chang-Quan, Xue-Mei, Bi-Rong, Zhen-Chan, Ji-Rong and Qing-Xiu2010b), likely triggered by the financial, emotional, and physical strain of managing chronic disease, although physiological mechanisms have also been proposed (Aziz & Steffens, Reference Aziz and Steffens2013; Katon, Reference Katon2011). Alternatively, depression and depressive disorders have been considered as contributors to chronic disease etiology, including cardiovascular disease, diabetes, and obesity (Chapman et al., Reference Chapman, Perry and Strine2005; Mezuk, Eaton, Albrecht, & Golden, Reference Mezuk, Eaton, Albrecht and Golden2008). However, limited evidence exists for pathways in which depression, or depressive symptoms, may facilitate disease development. Studies assessing relationships of depression and disease status have shown associations in both directions for some conditions (i.e. cancer, metabolic syndrome, obesity, cardiovascular disease) (Gothe et al., Reference Gothe, Enache, Wahlund, Winblad, Crisby, Lokk and Aarsland2012; Luppino et al., Reference Luppino, de Wit, Bouvy, Stijnen, Cuijpers, Penninx and Zitman2010; Nemeroff & Goldschmidt-Clermont, Reference Nemeroff and Goldschmidt-Clermont2012; Pan et al., Reference Pan, Keum, Okereke, Sun, Kivimaki, Rubin and Hu2012; Spiegel & Giese-Davis, Reference Spiegel and Giese-Davis2003), while others are less clearly defined (e.g. type 2 diabetes) (Renn, Feliciano, & Segal, Reference Renn, Feliciano and Segal2011; Tabák, Akbaraly, Batty, & Kivimäki, Reference Tabák, Akbaraly, Batty and Kivimäki2014).
One understudied pathway in the depression-chronic disease connection is the role of depression in disturbing the body's allostasis, or process of attaining homeostasis after responding to stressors (Barrett, Quigley, & Hamilton, Reference Barrett, Quigley and Hamilton2016; McEwen, Reference McEwen2003a). Depression can up-regulate proinflammatory cytokines and cortisol (Ogłodek, Szota, Just, Moś, & Araszkiewicz, Reference Ogłodek, Szota, Just, Moś and Araszkiewicz2014) but these, in turn, elicit further depressive symptoms (Dedovic & Ngiam, Reference Dedovic and Ngiam2015; Slavich & Irwin, Reference Slavich and Irwin2014). Inflammatory and cortisol pathways activated independently from depression may also trigger depressive symptoms (Barrett et al., Reference Barrett, Quigley and Hamilton2016; McEwen, Reference McEwen2003a). Moreover, the sustained presence of neuroendocrine and inflammation biomarkers may disrupt multiple downstream physiological systems (e.g. cardiovascular), leading to allostatic load (AL), a cumulative measure of physiological ‘wear and tear’ that is directly associated with mortality (McEwen, Reference McEwen1998b; McEwen & Stellar, Reference McEwen and Stellar1993) and chronic disease (Crews, Reference Crews2007; Mattei, Demissie, Falcon, Ordovas, & Tucker, Reference Mattei, Demissie, Falcon, Ordovas and Tucker2010; Seeman, Singer, Rowe, Horwitz, & McEwen, Reference Seeman, Singer, Rowe, Horwitz and McEwen1997). AL provides an integrated framework to examine the role of chronic or repeated stress on multiple physiological systems, rather than a single system, and incorporates the physiological responses mediating (e.g. neuroendocrine) eventual disease development (McEwen, Reference McEwen1998a, Reference McEwen2003a). High AL has been associated with depressive symptoms in a cross-sectional community sample of US older adults (Kobrosly, van Wijngaarden, Seplaki, Cory-Slechta, & Moynihan, Reference Kobrosly, van Wijngaarden, Seplaki, Cory-Slechta and Moynihan2014) and in a cross-sectional, nationally-representative sample of older Taiwanese adults (Seplaki, Goldman, Glei, & Weinstein, Reference Seplaki, Goldman, Glei and Weinstein2005), but most study designs prevent establishing relationship directionality. One analysis among older adults found cross-sectional, but not longitudinal, associations between AL and depressive symptoms (Juster et al., Reference Juster, Marin, Sindi, Nair, Ng, Pruessner and Lupien2011); associations between depressive symptoms and eventual AL were not tested. The dearth of studies testing the depressive symptom–AL relationship and its directionality warrants robust, longitudinal investigations, especially in at-risk populations.
US mainland Puerto Ricans are a marginalized population experiencing high prevalence of depression (38%) and depressive symptoms (60%), especially compared to other Hispanic/Latino heritages (Tucker et al., Reference Tucker, Mattei, Noel, Collado, Mendez, Nelson and Falcon2010; Wassertheil-Smoller et al., Reference Wassertheil-Smoller, Arredondo, Cai, Castaneda, Choca, Gallo and Zee2014). Simultaneously, mainland Puerto Ricans have high prevalence of cardiometabolic risk factors and disease (Daviglus et al., Reference Daviglus, Talavera, Aviles-Santa, Allison, Cai, Criqui and Stamler2012; Mattei et al., Reference Mattei, Sotres-Alvarez, Daviglus, Gallo, Gellman, Hu and Kaplan2016; Schneiderman et al., Reference Schneiderman, Llabre, Cowie, Barnhart, Carnethon, Gallo and Aviles-Santa2014; Tucker et al., Reference Tucker, Mattei, Noel, Collado, Mendez, Nelson and Falcon2010) and high AL (Mattei et al., Reference Mattei, Demissie, Falcon, Ordovas and Tucker2010; Salazar et al., Reference Salazar, Strizich, Seeman, Isasi, Gallo, Avilés-Santa and Kaplan2016). The Boston Puerto Rican Health Study (BPRHS) longitudinal cohort of Puerto Rican adults (45–75 years) provides a unique opportunity to address these gaps in an at-risk population, as 60% had depressive symptomology (Tucker et al., Reference Tucker, Mattei, Noel, Collado, Mendez, Nelson and Falcon2010), and 61.8% had three to five dysregulated AL parameters (15.4% had ⩾6 dysregulated AL parameters) (Mattei et al., Reference Mattei, Demissie, Falcon, Ordovas and Tucker2010) at baseline. The objective of this study was to investigate bidirectional, longitudinal associations of baseline depressive symptoms or AL with 5-year AL or depressive symptoms, respectively.
Methods
Study population
We analyzed data from the BPRHS (n = 1500), a longitudinal cohort study examining psychosocial stress, AL, and health outcomes. Recruitment and data collection methods have been published in detail elsewhere (Tucker et al., Reference Tucker, Mattei, Noel, Collado, Mendez, Nelson and Falcon2010). Eligible participants were adults (45–75 years), who self-identified as Puerto Rican, were able to respond to questions in English or Spanish, and were living in the Boston, MA metropolitan area at the time of initial recruitment (2004–2007). Census tracks with at least 25 Puerto Rican adults ages 45–75 years were identified using the 2000 Census and, within these tracks, census blocks with ⩾10 Hispanic/Latino adults ages 45–75 years were randomly selected. Participants were recruited using door-to-door enumeration and community outreach strategies. Among those invited to participate (n = 2093), 86.5% agreed and 72.0% (n = 1500) completed the baseline interview. Compared to those who agreed to participate, those who declined tended to be older or to have lived longer in the USA, but did not differ by sex, birthplace, or language spoken (Tucker et al., Reference Tucker, Mattei, Noel, Collado, Mendez, Nelson and Falcon2010). Study visits occurred at baseline, 2-years, and 5-years. Of those participants completing the baseline interview, 83.9% (n = 1258) completed the 2-year and 64.1% (n = 961) completed the 5-year follow-up assessments. Upon obtaining written informed consent from participants, trained bilingual interviewers administered questionnaires and performed anthropometric measures in duplicate and blood pressure measurements in triplicate in the participant's home; the average readings were used as the final values. Questionnaires included demographics, acculturation, depressive symptoms, perceived stress, self-reported medically-diagnosed conditions, medication use, physical activity, dietary intake, smoking status, and alcohol use. Participants provided a 12-h fasting blood sample (for analysis of high-density lipoprotein-cholesterol (HDL-C), and total cholesterol (TC)), C-reactive protein (CRP), glycated hemoglobin (HbA1c), dehydroepiandrosterone sulfate (DHEA-S)), and a 12-h urine collection for analysis of epinephrine, norepinephrine, and cortisol. The Institutional Review Boards at Tufts Medical Center and Northeastern University approved the study.
Measures
Depressive symptoms
The Center for Epidemiology Studies Depression (CES-D) scale assessed depressive symptoms and has demonstrated consistency and validity in older adults (Radloff, Reference Radloff1986), and reliability among Hispanics/Latinos (Moscicki, Locke, Rae, & Boyd, Reference Moscicki, Locke, Rae and Boyd1989), including Puerto Ricans (Tucker, Falcon, Bianchi, Cacho, & Bermudez, Reference Tucker, Falcon, Bianchi, Cacho and Bermudez2000b). The 20-item CES-D scale captured the frequency over the past week that participants experienced feelings and behaviors associated with depression, including poor appetite, feeling sad and lonely, and restless sleep. Response options were assigned a value of 0 (rarely or none of the time), 1 (some or little of the time), 2 (moderately or much of the time), or 3 (most or almost all the time). Total scores ranged from 0 to 60, with higher scores indicating greater depressive symptoms (Radloff, Reference Radloff1977). Internal consistency of the CES-D in our sample was highly reliable (α = 0.91). Based on previously-defined cutoffs for older black and white adults (Cohen, Magai, Yaffee, & Walcott-Brown, Reference Cohen, Magai, Yaffee and Walcott-Brown2005; Vahia et al., Reference Vahia, Meeks, Thompson, Depp, Zisook, Allison and Jeste2010), we defined baseline depressive symptoms as low (<8), subthreshold (8–15), or depression-likely (⩾16). When CES-D was the outcome, we used the continuous score. Two additional variables captured the total number of times across the three visits (0–3) that participants had (1) any depressive symptoms (subthreshold or depression-likely) and (2) depression-likely symptoms. In the sensitivity analysis, we also tested a higher cutoff (⩾20) for depression-likely symptoms, as recommended for the general population (Villagut, Forero, Barbaglia, & Alonso, Reference Villagut, Forero, Barbaglia and Alonso2016) and tested among a different US mainland Puerto Rican population (Robison, Gruman, Gaztambide, & Blank, Reference Robison, Gruman, Gaztambide and Blank2002). This 3-category depressive symptom variable was: low (<8), subthreshold (8–19), or depression-likely (⩾20). We tested CES-D as a continuous exposure variable, but results were non-significant and did not portray the distinctions of the depressive symptom–AL relationship in our cohort.
Allostatic load
AL was calculated from 11 parameters of biological functioning, representing five physiological systems: hypothalamus-pituitary-adrenal (HPA) axis (DHEA-S, cortisol), sympathetic nervous system (SNS; epinephrine, norepinephrine), inflammation (CRP), metabolic (waist circumference, HbA1c), and cardiovascular (systolic (SBP) and diastolic (DBP) blood pressure, HDL-C, and TC). The following biological parameters had clinically-defined high-risk cutoffs: waist circumference (men: >102 cm; women: >88 cm), HbA1c (>7%), SBP (>140 mmHg), DBP (>90 mmHg), HDL-C (<40 mg/dl), and TC (⩾240 mg/dl). Previously-defined quartile and high-risk cutoffs were used for the remaining parameters: DHEA-S (men: ⩾589.5 ng/ml; women: ⩾368.5 ng/ml), cortisol (men: ⩾41.5 μg/g creatine; women: ⩾49.5 μg/g creatine), epinephrine (men: ⩾2.8 μg/g creatine; women: ⩾3.6 μg/g creatine), norepinephrine (men: ⩾30.5 μg/g creatine; women: ⩾46.9 μg/g creatine), and CRP (>3 mg/l). The cut-offs for these latter parameters have been previously employed in defining AL in this cohort (Mattei et al., Reference Mattei, Demissie, Falcon, Ordovas and Tucker2010, Reference Mattei, Bhupathiraju and Tucker2013). The sex-specific cut-offs for neuroendocrine parameters represent previously documented sex differentials (Goldman et al., Reference Goldman, Weinstein, Cornman, Singer, Seeman, Goldman and Chang2004), and the CRP cut-off is based on a cumulation across population studies (Pearson et al., Reference Pearson, Mensah, Alexander, Anderson, Cannon, Criqui and Vinicor2003). A point was assigned to each parameter if the value exceeded the cutoff. An additional point was assigned to respective parameters when participants used medications for hypertension, diabetes, hyperlipidemia, or testosterone. Points were summed across all parameters to calculate the composite AL score (0–11). The AL score was further categorized according to previous analysis in this cohort (Mattei et al., Reference Mattei, Demissie, Falcon, Ordovas and Tucker2010): low (0–2), moderate (3–5), or high (⩾6) AL. One additional variable captured the number of times participants were categorized with high AL across the three visits (0–3). Points were also summed across each AL subsystem to produce subsystem scores: HPA-axis (0–2), SNS (0–2), inflammation (0–1), metabolic (0–2), and cardiovascular (0–4). We tested AL as a continuous exposure variable, but results were non-significant and did not capture the nuances of the relationship between AL and CES-D in our cohort.
Potential confounders
Potential confounders included sociodemographic characteristics, health behaviors, perceived stress, and language-based acculturation, based on previous analyses examining AL as an exposure or an outcome (Forrester, Leoutsakos, Gallo, Thorpe, & Seeman, Reference Forrester, Leoutsakos, Gallo, Thorpe and Seeman2019; Kobrosly et al., Reference Kobrosly, van Wijngaarden, Seplaki, Cory-Slechta and Moynihan2014; Mattei, Bhupathiraju, & Tucker, Reference Mattei, Bhupathiraju and Tucker2013; Salazar et al., Reference Salazar, Strizich, Seeman, Isasi, Gallo, Avilés-Santa and Kaplan2016). Sociodemographic data included age, sex, income-to-poverty ratio (IPR), and educational attainment. IPR was calculated as the ratio of total household income to a year-specific federal poverty threshold, a measure of need that considers basic food costs, household size and composition, and age of the household head (U.S. Census Bureau, 2016). We categorized participants as either ⩽120% or >120% of the IPR. Health behaviors included physical activity, diet quality, alcohol use, and smoking status. Physical activity was assessed using a modified Paffenbarger questionnaire. Total hours spent on typical activities in a 24-h period were multiplied by respective weighting, associated with the activity intensity and oxygen consumption, to define a physical activity score (Tucker, Bermudez, & Castaneda, Reference Tucker, Bermudez and Castaneda2000a). Dietary intake was assessed using a valid semiquantitative food frequency questionnaire (FFQ), based off of the National Cancer Institute Block-FFQ and adapted to incorporate appropriate foods and portion sizes for this population (Tucker, Bianchi, Maras, & Bermudez, Reference Tucker, Bianchi, Maras and Bermudez1998). The Alternate Healthy Eating Index-2010 (AHEI-2010) captured overall diet quality, consisting of 11 dietary components related to chronic disease risk. AHEI-2010 scores ranged from 0 (lowest diet quality) to 110 (highest diet quality) (Chiuve et al., Reference Chiuve, Fung, Rimm, Hu, McCullough, Wang and Willett2012). We imputed missing baseline AHEI-2010 scores for 60 participants in our analytical sample with multiple imputations for chained equations using predictive mean matching. The Perceived Stress Scale (PSS) measured the extent to which participants regarded their lives as stressful. Higher scores (range: 0–40) indicated greater perceived stress (Cohen, Kamarck, & Mermelstein, Reference Cohen, Kamarck and Mermelstein1983). Language-based acculturation was assessed with a questionnaire adapted from the Bi-Dimensional Acculturation Scale for Hispanics (Marin & Gamba, Reference Marin and Gamba1996), which captured the use of either Spanish or English language in seven different daily activities (e.g. watching TV, speaking with friends). A summary score (0–100) was calculated. Higher scores indicated greater language-based acculturation (more use of English).
Statistical analyses
Our analytical sample included 620 participants with complete data on CES-D and AL at baseline and 5-year follow-up. Of these, 604 participants had complete CES-D scores at all three visits and 543 participants had complete AL data at all three visits.
Participant characteristics were compared by baseline CES-D symptoms category (low v. subthreshold v. depression-likely) and by baseline AL category (low v. moderate v. high), using ANOVA or Student's t tests for continuous variables and chi-square tests for categorical variables. Multilevel random intercept and slope (time) linear regression models were used to examine associations between 3-category baseline CES-D score and 5-year continuous AL score, and between baseline 3-category AL and 5-year continuous CES-D score. Model 1 was adjusted for age (time) and sex. Model 2 was adjusted for Model 1 covariates plus baseline IPR category and educational attainment. Model 3 was adjusted for Model 2 covariates plus baseline physical activity level, AHEI-2010, smoking status, and alcohol use. Model 4 was adjusted for Model 3 covariates plus baseline language-based acculturation and PSS. All models accounted for the outcome variable at baseline and 2-year follow-up. We used Tukey's test to determine the significance of pairwise comparisons. We used multilevel random intercept regression models to test relationships of 3-category baseline CES-D score with each of the five AL subsystem scores (HPA-axis, SNS, inflammation, metabolic, and cardiovascular). Multilevel random intercept and slope (time) linear regression models (n = 604) were also separately examined for the association between the number of times with any depressive symptoms (subthreshold or depression-likely) or with depression-likely symptoms across the three visits and 5-year continuous AL score. Similarly, we tested the association between the number of times categorized with high AL and 5-year depressive symptoms (n = 543). Analyses were conducted in SAS v9.4 (SAS Institute Inc., Cary, NC, USA) with a significance level set at α = 0.05.
Results
Participant characteristics
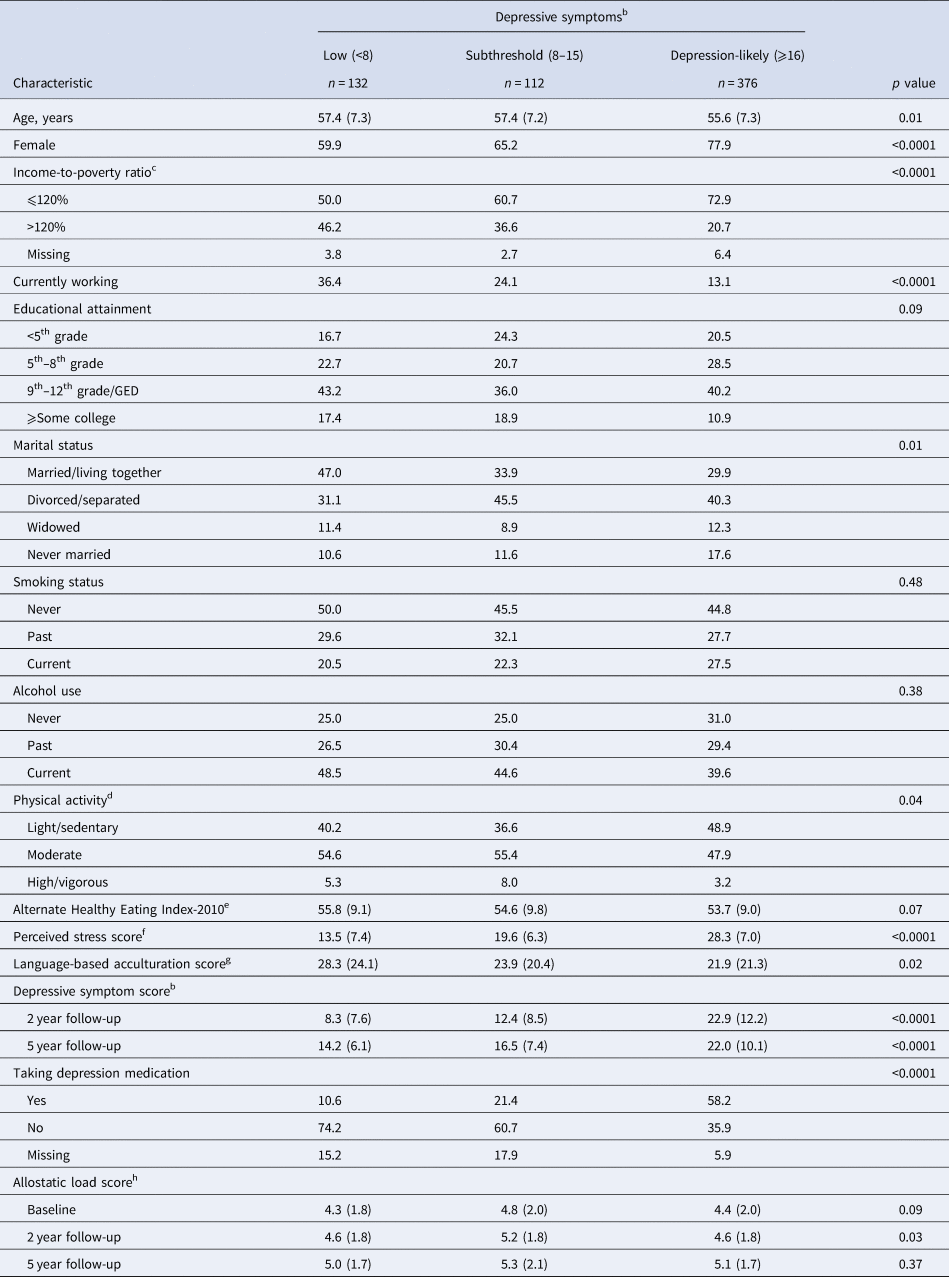
At baseline, 18.1% and 60.6% of participants were classified with subthreshold and depression-likely symptoms, respectively (Table 1). Compared to low or subthreshold depressive symptoms, participants classified with depression-likely symptoms at baseline were younger, less likely to be currently working, married/living with a partner, physically active, and more likely to be female, living ⩽120% of the IPR, or taking depression medication. These participants also tended to have a higher PSS score and lower language-based acculturation score. Compared with low depressive symptoms, participants with subthreshold depressive symptoms at baseline were more likely to be female, living ⩽120% of the IPR, or physically active, and less likely to be currently working or married/living as married. These participants also tended to have a higher PSS score, lower language-based acculturation score, and higher AL score at 2-year follow-up.
Sample characteristics by baseline depressive symptoms among participants in the Boston Puerto Rican Health Study (n=620)a

a Values shown as mean (s.d.) for continuous variables or percentages for categorical variables.
b Assessed using the Center for Epidemiology Studies Depression (CESD) scale (range: 0–60).
c Ratio of total household income to appropriate and year-specific federal poverty threshold. Scores categorized above/below 120%.
d Sum of hours spent in typical activities over a 24-h period, multiplied by weight factors associated with oxygen consumption for each activity. Scores categorized as light or sedentary (<30), moderate (30–40), or heavy (>40).
e Assessed using 11 dietary components. Higher scores indicate higher diet quality (total score range from 0 to 110).
f Measures the degree to which one's life is viewed as stressful, ranging from 0 to 40, with higher values indicating higher perceived stress.
g Higher scores (range 0–100) indicated greater acculturation (more use of English).
h Calculated from 11 parameters of biological functioning (range: 0–11).
From baseline to 5-year follow-up, 1.2%, 11.8%, 24.2%, and 62.9% of participants were categorized with any type of depressive symptoms (subthreshold or depression-likely) zero, one, two, and three times, respectively. Across the three visits, 21.0%, 22.9%, 23.5%, and 32.6% of participants were categorized with depression-likely symptoms zero, one, two, and three times, respectively.
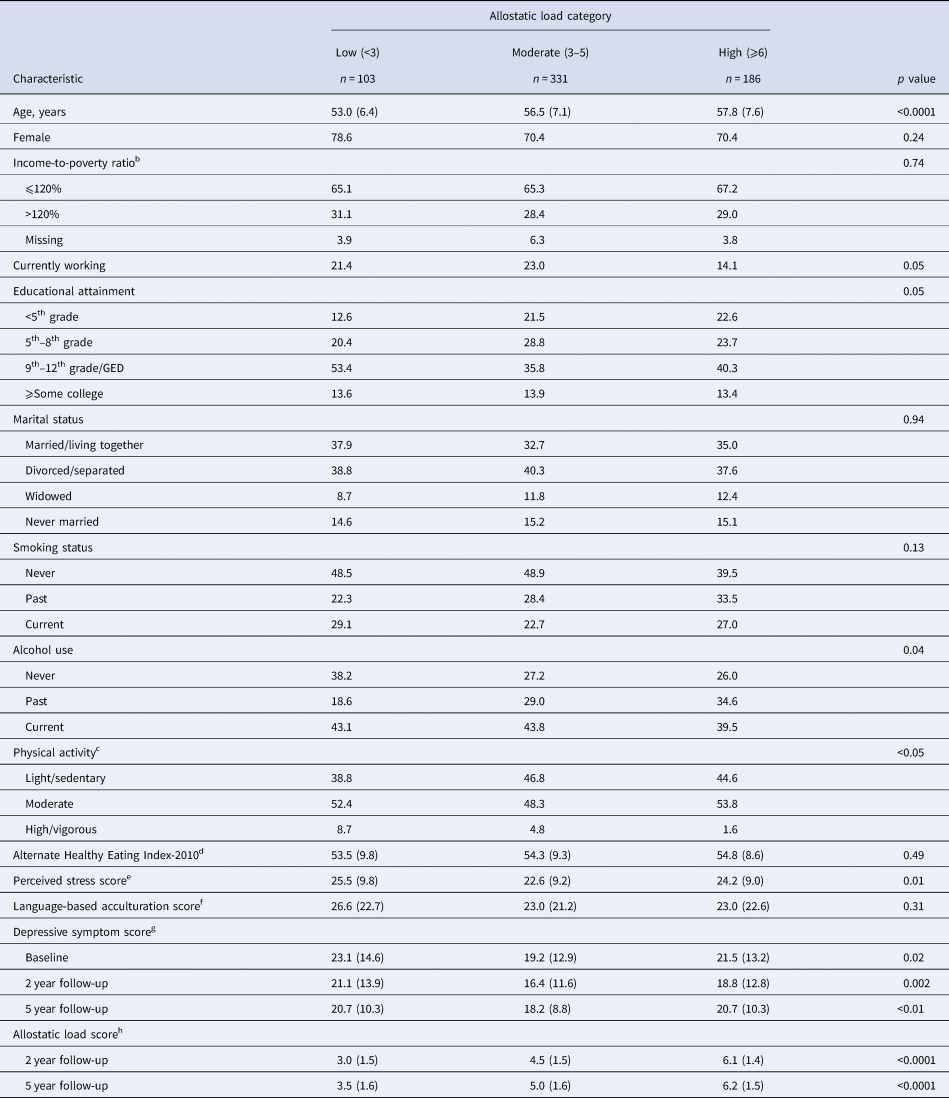
At baseline, 53.4% and 30.0% of participants had moderate and high AL, respectively (Table 2). Compared with low AL, participants with moderate or high AL were older and more likely to be a past drinker. Participants with moderate AL had a lower PSS score and CES-D score at baseline, 2-year, and 5-year follow-up.
Sample characteristics by baseline allostatic load category among participants in the Boston Puerto Rican Health Study (n = 620)a
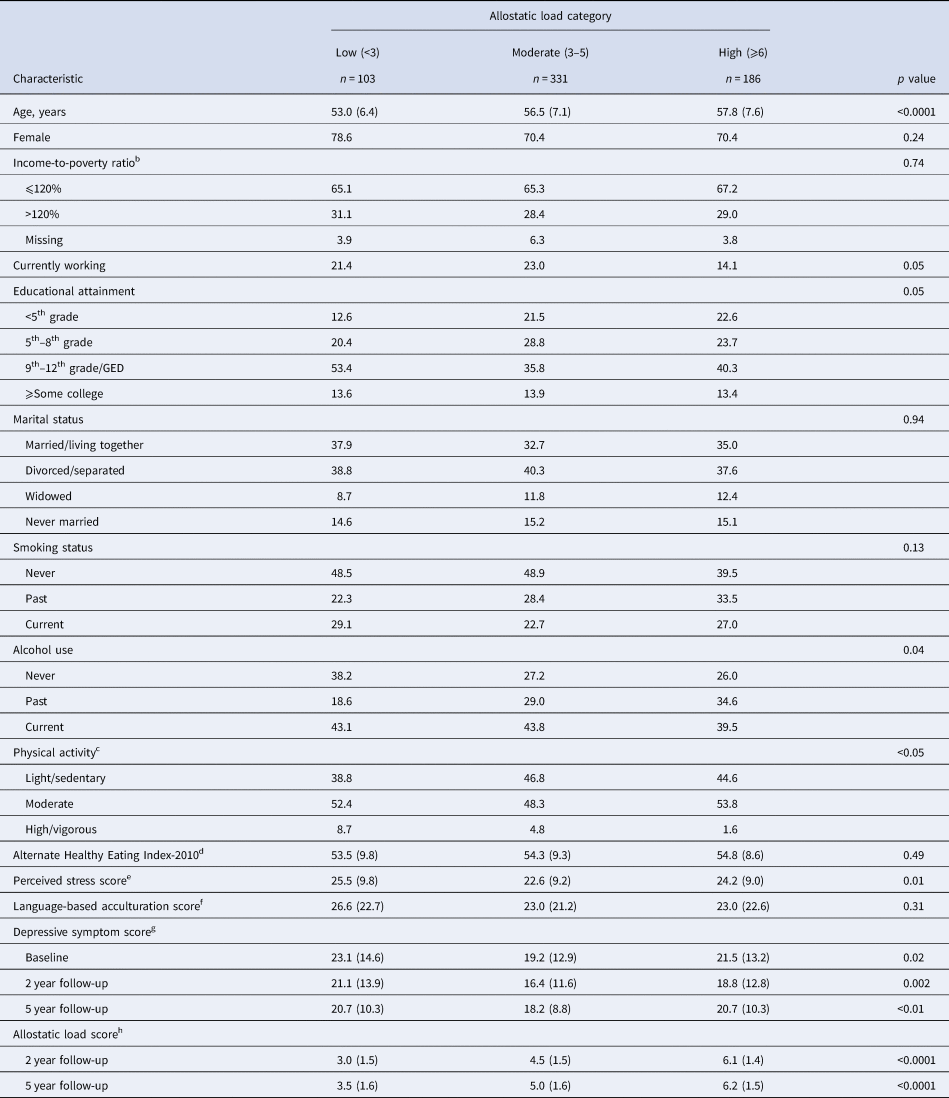
a Values shown as mean (s.d.) for continuous variables or percentages for categorical variables.
b Ratio of total household income to appropriate and year-specific federal poverty threshold. Scores categorized above/below 120%.
c Sum of hours spent in typical activities over a 24-h period, multiplied by weight factors associated with oxygen consumption for each activity. Scores categorized as light or sedentary (<30), moderate (30–40), or heavy (>40).
d Assessed using 11 dietary components. Higher scores indicate higher diet quality (total score range from 0 to 110).
e Measures the degree to which one's life is viewed as stressful, ranging from 0 to 40, with higher values indicating higher perceived stress.
f Higher scores (range 0–100) indicated greater acculturation (more use of English).
g Assessed using the Center for Epidemiology Studies Depression (CESD) scale (range: 0–60).
h Calculated from 11 parameters of biological functioning (range: 0–11).
Allostatic load across time
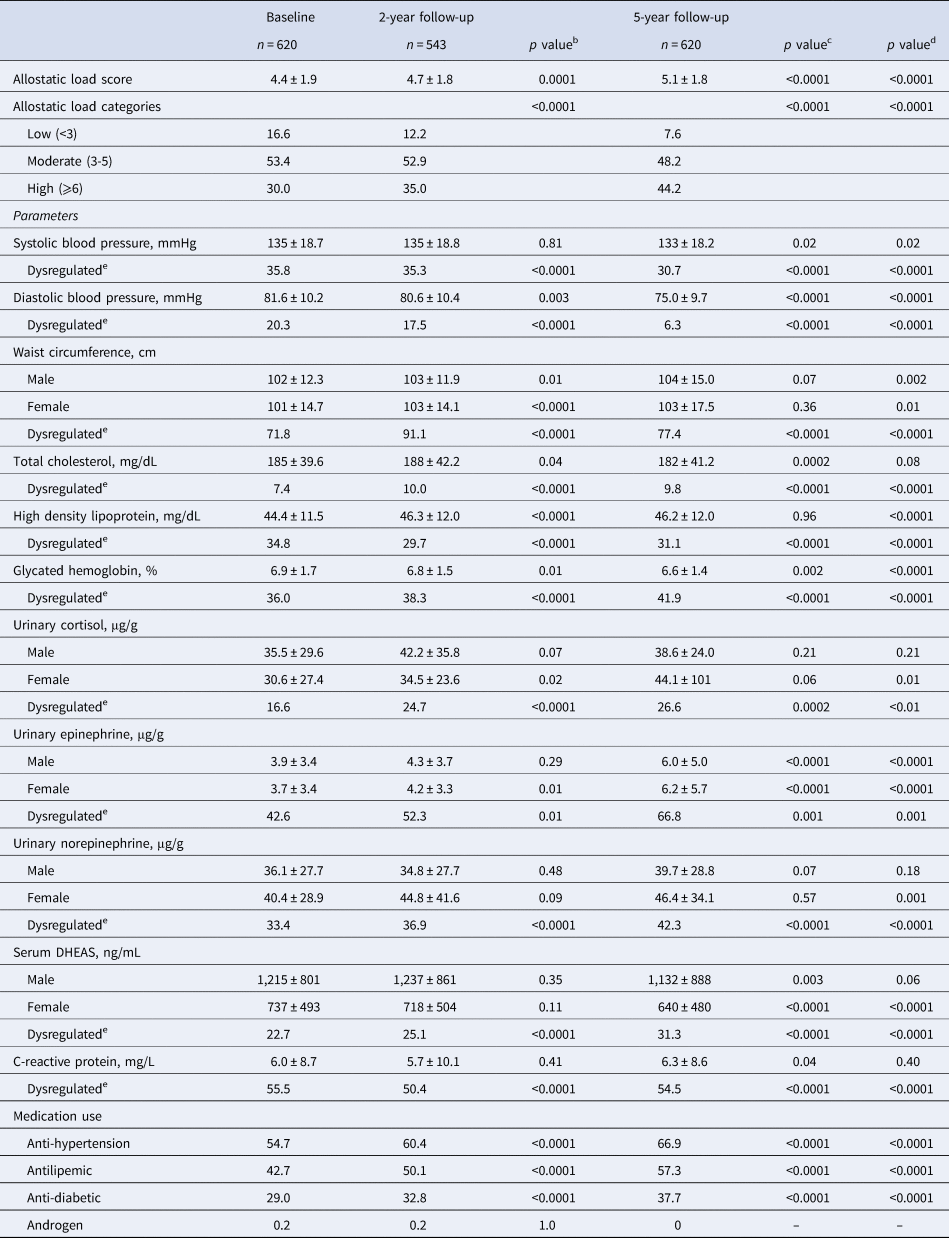
Mean AL score tended to increase from baseline to 5-year follow up. A higher percentage of participants were categorized with moderate or high AL at 5-year follow-up compared to baseline (Table 3). At 5-year follow-up compared to baseline, participants tended to have higher waist circumference, HDL-C, and epinephrine, and lower blood pressure and HbA1c, and were more likely to use antihypertension, antilipidemic, and anti-diabetic medications.
Allostatic load and individual parameters at three time points among participants in the Boston Puerto Rican Health Study (n = 620)a
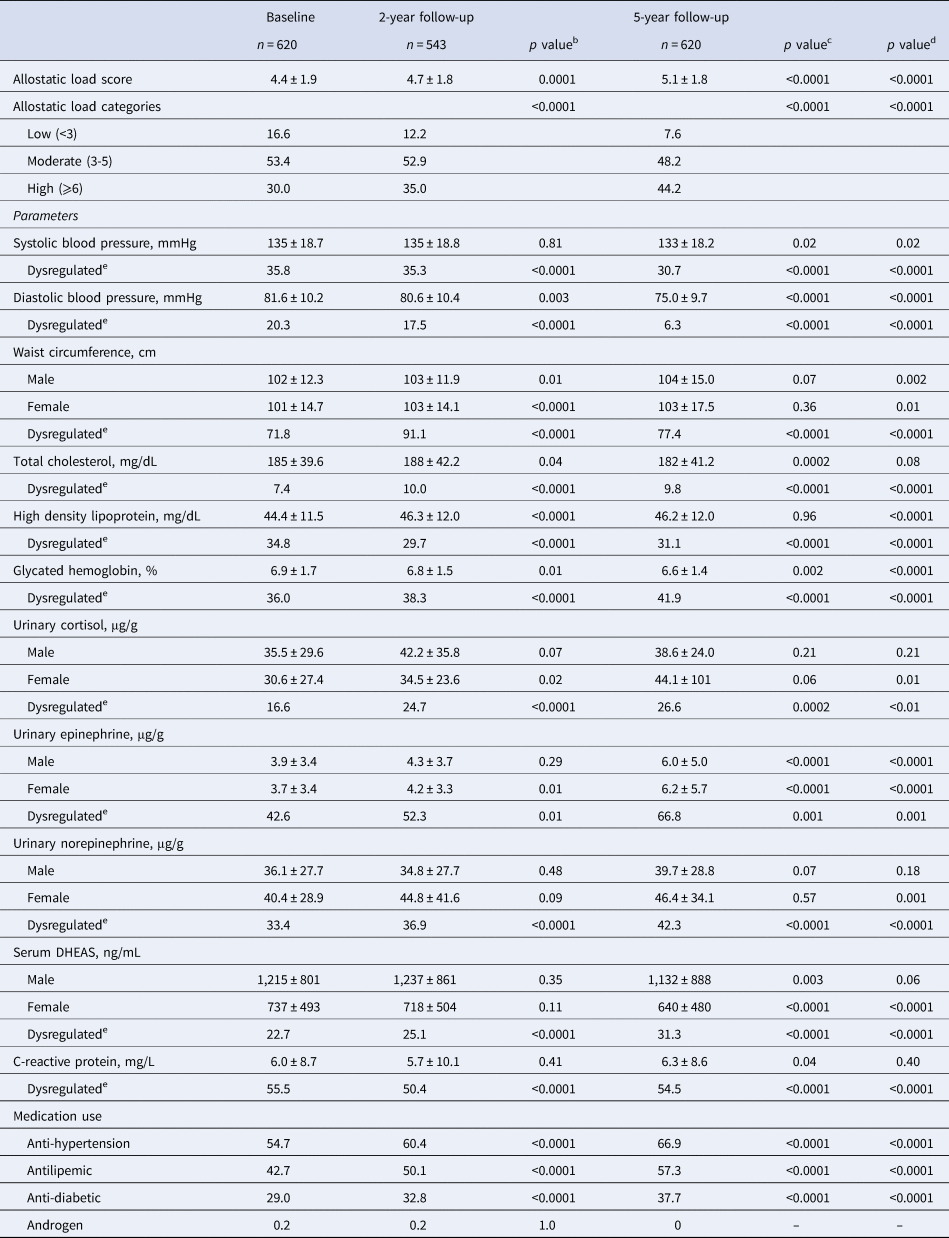
a Values shown as mean (s.d.) for continuous variables or percentages for categorical variables.
b Comparison between baseline and 2-year.
c Comparison between 2-year and 5-year.
d Comparison between baseline and 5-year.
e Cut-offs for dysregulated components: waist circumference (men: >102 cm; women: >88 cm), HbA1c (>7%), systolic blood pressure (>140 mmHg), diastolic blood pressure (>90 mmHg), HDL-C (<40 mg/dl), total cholesterol (⩾240 mg/dl), DHEA-S (men: ⩾589.5 ng/ml; women: ⩾368.5 ng/ml), cortisol (men: ⩾41.5 μg/g creatine; women: ⩾49.5 μg/g creatine), epinephrine (men: ⩾2.8 μg/g creatine; women: ⩾3.6 μg/g creatine), norepinephrine (men: ⩾30.5 μg/g creatine; women: ⩾46.9 μg/g creatine), CRP (>3 mg/l).
Multilevel mixed models
Baseline depressive symptoms and 5-year AL
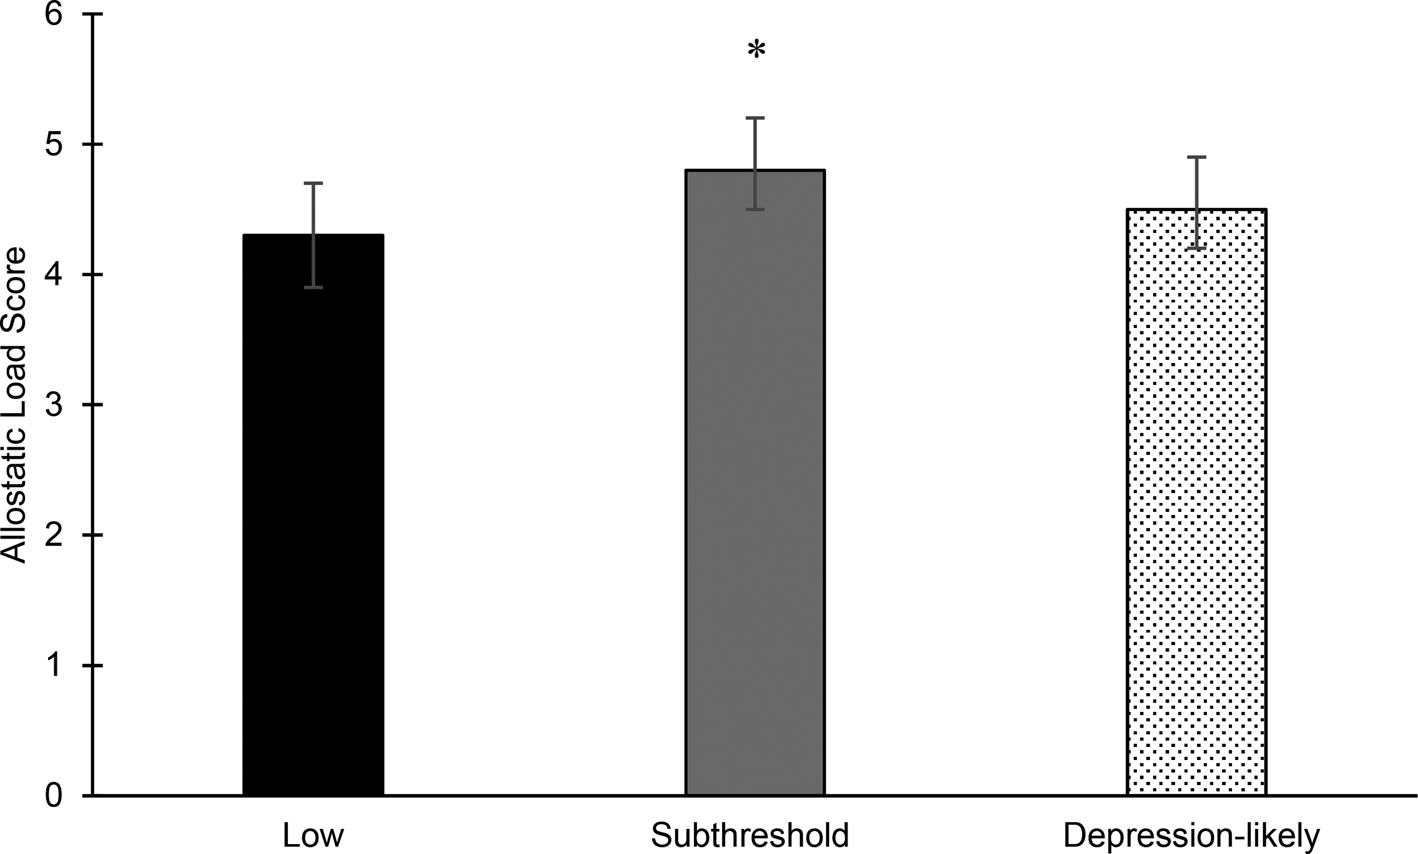
Having baseline subthreshold, compared to low, depressive symptoms were significantly associated with higher 5-year AL score, in minimally-adjusted models (online Supplementary Table S1). In fully-adjusted models, baseline subthreshold depressive symptoms remained associated with higher 5-year AL score [mean (95% CI): 4.8 (4.5–5.2)], compared with low depressive symptoms [4.3 (3.9–4.7)] (Fig. 1). Depression-likely symptoms were not significantly associated with higher 5-year AL score, [4.5 (4.2–4.9)]. Having baseline subthreshold, depressive symptoms were associated with higher SNS [mean (95% CI): 1.0 (0.8–1.1); p < 0.05] and metabolic scores [1.2 (1.0–1.3); p < 0.05] compared to low depressive symptoms [SNS: 0.8 (0.7–0.9)]; metabolic: 1.0 (0.8–1.1) (online Supplementary Table S2). No other baseline depressive symptom categories were associated with AL subsystem scores. In sensitivity analyses using the cutoff of ⩾20, subthreshold depressive symptoms remained associated with 5-year AL score [mean (95% CI): 4.8 (4.5–5.1); p < 0.05] compared to low depressive symptoms [4.3 (3.9–4.7)], but depression-likely symptoms were not associated with 5-year AL score [mean (95% CI): 4.5 (4.1–4.8)] (online Supplementary Table S3).
Adjusted mean (95%CI) (Adjusted for baseline and Year 2 allostatic load, age, sex, and baseline 120% of income-to-poverty ratio, education, physical activity, Alternate Healthy Eating Index-2010, smoking, alcohol use, acculturation, and perceived stress. Tukey's test adjusted for multiple comparisons.) allostatic load score at 5-year follow-up by baseline depressive symptom (Assessed using the Center for Epidemiology Studies Depression (CES-D) scale (range: 0-60). Scores categorized as low (<8), subthreshold (8-15), and depression-likely (⩾16) symptoms.) category in the Boston Puerto Rican Health Study (n = 620). *Significantly different than low category at p < 0.05.

Number of times with depressive symptoms and 5-year AL
Each additional timepoint with any type of depressive symptoms (subthreshold or depression-likely), compared to low depressive symptoms, was associated with a 0.2 (0.1) increase in AL from baseline to 5-year follow-up (p = 0.047). The number of times classified with depression-likely symptoms, compared to low or subthreshold depressive symptoms, from baseline to year 5-year follow-up was not associated with 5-year AL score [β(s.e.): 0.1 (0.1), p = 0.39].
Baseline AL and 5-year depressive symptoms
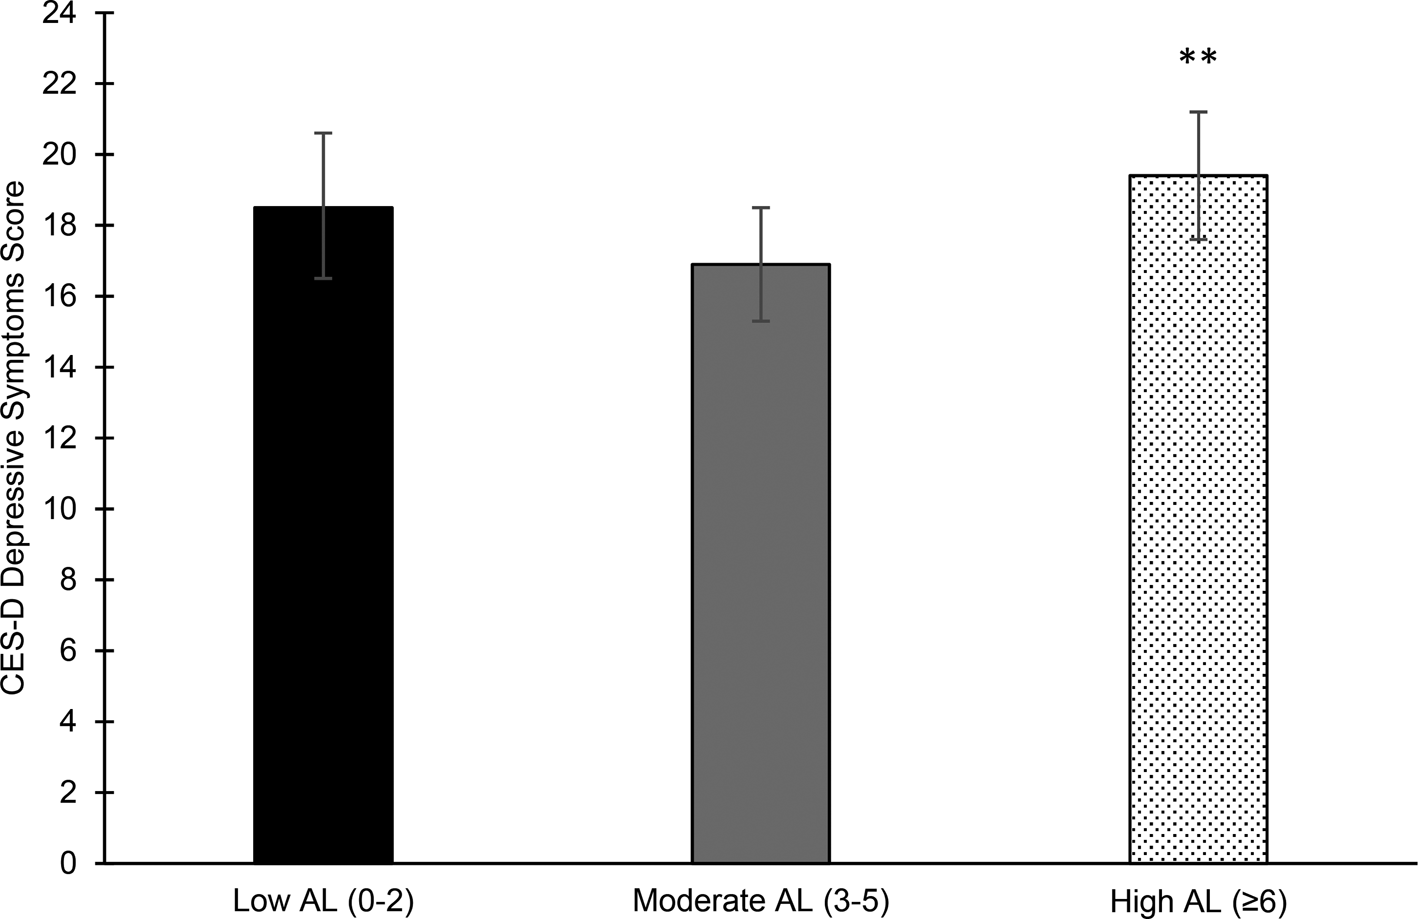
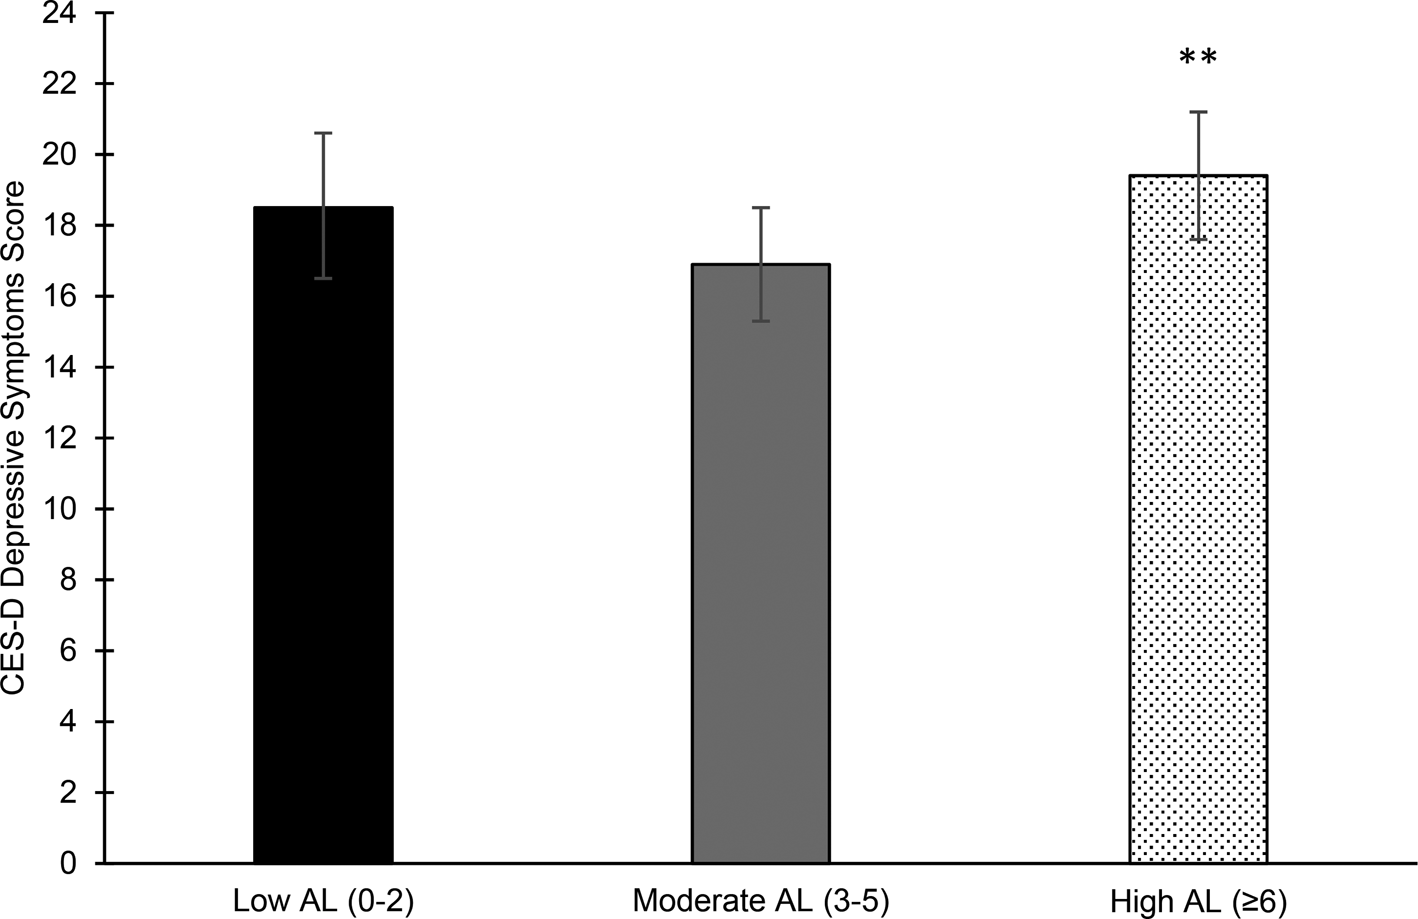
Baseline high, compared with moderate, AL was significantly associated with higher 5-year depressive symptom score in minimally-adjusted models (online Supplementary Table S4). In fully-adjusted models, baseline high AL remained associated with higher 5-year depressive symptoms [mean (95% CI): 19.4 (17.6–21.2)], compared to baseline moderate AL [mean (95% CI): 16.9 (15.3–18.5)], but low AL at baselined was not associated with 5-year depressive symptoms [mean (95% CI):18.5 (16.5–20.6)] (Fig. 2).
Adjusted mean (95% CI) (Adjusted for baseline and Year 2 depressive symptoms, age, sex, and baseline 120% of income-to-poverty ratio, education, physical activity, Alternate Healthy Eating Index-2010, smoking, alcohol use, acculturation, and perceived stress. Tukey's test adjusted for multiple comparisons.) Center for Epidemiology Studies Depression (CES-D) depressive symptoms at 5-year follow-up by baseline allostatic load category (Calculated from 11 parameters of biological functioning (range: 0-11). Scores categorized as low (<3), moderate (3-5), or high (⩾6).) in the Boston Puerto Rican Health Study (n = 620). **Significantly different than Moderate category at p < 0.01.
Number of times with high AL and 5-year depressive symptoms
Each additional timepoint with high, compared to low or moderate, AL was associated with a 0.5 point higher depressive symptom score (p = 0.04).
Discussion
In this sample of older mainland US Puerto Rican adults, we found a bidirectional relationship between AL and depressive symptoms. Subthreshold depressive, compared to low, symptoms at baseline were associated with higher mean AL over 5-year, which may be functioning through the SNS and metabolic system. High, compared to moderate, AL at baseline was associated with higher mean depressive symptoms over 5-year. Furthermore, an increasing number of times with subthreshold or depression-likely symptoms (or high AL) over 5-year was associated with increases in AL (or CES-D) score over 5-year. The bidirectional relationship suggests that low-income and minority populations may be particularly sensitive, as experiences of social inequity can get ‘under the skin’ (APA Working Group on Stress and Health Disparities, 2017).
Existing evidence for the AL–depression relationship is mixed. Juster et al. (Reference Juster, Marin, Sindi, Nair, Ng, Pruessner and Lupien2011) found a cross-sectional, but not longitudinal, association between AL and depression, suggesting an acute response. Age was a stronger predictor of depressive symptoms over time than AL in their sample (Juster et al., Reference Juster, Marin, Sindi, Nair, Ng, Pruessner and Lupien2011). However, compared to our analyses, Juster et al. (Reference Juster, Marin, Sindi, Nair, Ng, Pruessner and Lupien2011) had fewer AL markers, with only one marker for the SNS (cortisol) and none for inflammation, perhaps limiting their scope for assessing multi-system dysregulation. Their sample was also small (n = 58), older (median: 67.6 years), predominantly non-Hispanic white, with low baseline depression levels (none taking medication), and mean AL (2.2) (Juster et al., Reference Juster, Marin, Sindi, Nair, Ng, Pruessner and Lupien2011), which is in stark comparison to our sample of minority adults (60.6% with depression-likely symptoms and mean AL of 4.5 at baseline). Similar to our findings, Kobrosly et al. (Reference Kobrosly, van Wijngaarden, Seplaki, Cory-Slechta and Moynihan2014) demonstrated in a cross-sectional, predominately non-Hispanic white, well-educated older adult sample that AL was independently associated with overall, affective, and somatic depressive symptom scores (Kobrosly et al., Reference Kobrosly, van Wijngaarden, Seplaki, Cory-Slechta and Moynihan2014). Their sample had low AL (mean: 1.7) and depressive symptoms (mean: 7.9) but, like our study, their AL score included markers of the HPA-axis, SNS, inflammation, metabolic, and cardiovascular systems and they assessed depressive symptoms using the 20-item CES-D. Other comparable studies have employed scores of multi-system physiological dysregulation, instead of AL, using data from the National Health and Nutrition Examination Survey (NHANES). Multi-system physiological dysregulation was not independently associated with depressive disorder among middle-aged to older adults in any racial/ethnic group (Rodriquez et al., Reference Rodriquez, Livaudais-Toman, Gregorich, Jackson, Nápoles and Pérez-Stable2018). Although Hispanics/Latinos and non-Hispanic blacks reported higher levels of depression than non-Hispanic whites, physiological dysregulation did not appear to explain these differences, perhaps due to the cross-sectional design or the lack of neuroendocrine biomarkers, important mediators in the stress response which are often dysregulated prior to cardiometabolic markers. However, another NHANES study found that multi-system physiological dysregulation was associated with overall, affective, and somatic depressive symptoms when the sample was restricted to adults aged ⩾60 years (Kobrosly, Seplaki, Cory-Slechta, Moynihan, & van Wijngaarden, Reference Kobrosly, Seplaki, Cory-Slechta, Moynihan and van Wijngaarden2013). The contrasting findings from Rodriquez et al. (Reference Rodriquez, Livaudais-Toman, Gregorich, Jackson, Nápoles and Pérez-Stable2018) and Kobrosly et al. (Reference Kobrosly, Seplaki, Cory-Slechta, Moynihan and van Wijngaarden2013) may be attributed to the age differences between the two samples, as depressive symptoms are more common among older adults (World Health Organization, 2017), or to the way that depressive symptoms were conceptualized; Rodriquez et al. (Reference Rodriquez, Livaudais-Toman, Gregorich, Jackson, Nápoles and Pérez-Stable2018) used a cutoff for being at risk for depressive disorder, whereas Kobrosly et al. (Reference Kobrosly, Seplaki, Cory-Slechta, Moynihan and van Wijngaarden2013) used a continuous score for depressive symptoms and scores for affective v. somatic symptoms. The culmination of evidence across these studies and ours suggests that older age and minority group membership may concurrently exacerbate the AL-depression link, especially when considering dysregulation of a wider range of physiological systems and various ways to conceptualize depression. Older adults and minority populations have a high prevalence of cardiometabolic conditions (World Health Organization, 2017), and minorities like Hispanics/Latinos are exposed to a greater number of social stressors (APA Working Group on Stress and Health Disparities, 2017).
Our findings for baseline depressive symptoms and 5-year AL are noteworthy. Most hypothesized pathways suggest that AL leads to depression, but potential pathways also exist in reverse. Depression initially leads to amygdala hyperactivity (Juster et al., Reference Juster, Marin, Sindi, Nair, Ng, Pruessner and Lupien2011; McEwen, Reference McEwen2003a). Repeated stress may up-regulate hormone and hormone receptors in the basolateral amygdala (Choi et al., Reference Choi, Kim, Kim, Park, Lee, Kim and Han2015), including glucocorticoid concentration (McEwen, Reference McEwen2003a), which facilitates memory of adverse events, further triggering amygdala reactivity (McEwen, Reference McEwen2012). Eventually, the amygdala, hippocampus, and prefrontal cortex undergo structural changes, resulting in cognitive impairment and increased aggression, anxiety, and fear (McEwen, Reference McEwen2003a). Additionally, chronic perceived or actual threats cause the body to develop resistance to glucocorticoid hormones (Slavich & Irwin, Reference Slavich and Irwin2014), dysregulating the HPA-axis (Juster et al., Reference Juster, Marin, Sindi, Nair, Ng, Pruessner and Lupien2011; McEwen, Reference McEwen2003a), and subsequently up-regulating the proinflammatory immune response (Leonard & Myint, Reference Leonard and Myint2009). Proinflammatory cytokines communicate with the brain to influence mood, cognition, and behavior, aspects foundational to depression (Leonard & Myint, Reference Leonard and Myint2009), and increase the risk of inflammation-related disease and viral infection (McEwen, Reference McEwen2003b). These same stress responses are observed during the depression (McEwen, Reference McEwen2003a; Ogłodek et al., Reference Ogłodek, Szota, Just, Moś and Araszkiewicz2014), which may help explain why diseases with an inflammatory basis (e.g. metabolic syndrome, coronary heart disease, rheumatoid arthritis) often co-occur with depression (Slavich & Irwin, Reference Slavich and Irwin2014), and provide evidence to support our findings. Long-term dysregulation of these hormones is associated with heightened blood platelet reactivity and cardiovascular disease risk among those with major depression (McEwen, Reference McEwen2003a). Similarly, recurrent, but not single, episodes of major depression have been associated with greater 5-year risk of cardiovascular disease and diabetes (Windle & Windle, Reference Windle and Windle2013). Subthreshold depression is prevalent among those with cardiac illness and may increase the risk of cardiovascular disease mortality (Iqbal & Iqbal, Reference Iqbal and Iqbal2019). Subthreshold depressive symptoms may have exacerbated cardiovascular markers in our older adult population, although we observed more 5-year dysregulation in metabolic markers. Higher baseline depressive symptoms have been associated with longitudinal increases in BMI and waist circumference, and these relationships were not bidirectional (Needham, Epel, Adler, & Kiefe, Reference Needham, Epel, Adler and Kiefe2010; van Reedt Dortland, Giltay, van Veen, Zitman, & Penninx, Reference van Reedt Dortland, Giltay, van Veen, Zitman and Penninx2013). However, research has shown bidirectional relationships between depressive symptoms and glucose metabolism (Roy & Lloyd, Reference Roy and Lloyd2012), which are posited to function through the HPA-axis, immune, and inflammatory mediators (Demakakos, Zaninotto, & Nouwen, Reference Demakakos, Zaninotto and Nouwen2014; Stuart & Baune, Reference Stuart and Baune2012). CRP, interleukin (IL)-1, IL-6 (Howren, Lamkin, & Suls, Reference Howren, Lamkin and Suls2009), and nocturnal cortisol, but not DHEA (Hartaigh et al., Reference Hartaigh, Loerbroks, Thomas, Engeland, Hollands, Fischer and Bosch2012) may also have bi-directional relationships with depression. We found differences in 5-year SNS, but not inflammation, marker changes by baseline depressive symptoms, which may have led to differences in metabolic marker changes. Co-morbid depression and diabetes are common (Ducat, Philipson, & Anderson, Reference Ducat, Philipson and Anderson2014). Longitudinal evidence suggests that depression may be associated with type 2 (Deleskog et al., Reference Deleskog, Ljung, Forsell, Nevriana, Almas and Möller2019) and gestational (Hinkle et al., Reference Hinkle, Buck Louis, Rawal, Zhu, Albert and Zhang2016) diabetes development, although the direction of the association is not fully established (Roy & Lloyd, Reference Roy and Lloyd2012).
Depressive symptomatology in our sample was high and persistent, fitting the model of ‘repeated stressors’ (Slavich & Irwin, Reference Slavich and Irwin2014). Previous research in this cohort demonstrated that Puerto Ricans may have stressful social ties (Falcon, Todorova, & Tucker, Reference Falcon, Todorova and Tucker2009). Social stressors, like interpersonal loss, social rejection (Slavich & Irwin, Reference Slavich and Irwin2014), and negative family interactions (Priest et al., Reference Priest, Woods, Maier, Parker, Benoit and Roush2015) are strongly related to depression initiation, to inflammation (Slavich & Irwin, Reference Slavich and Irwin2014), and to greater subjective and objective biobehavioral reactivity (anxiety/depression and AL) (Priest et al., Reference Priest, Woods, Maier, Parker, Benoit and Roush2015). Furthermore, stressful relationships are often exacerbated by environmental conditions like low socioeconomic or social status (Slavich & Irwin, Reference Slavich and Irwin2014), of which affected the majority of our sample. Inflammation may be the link connecting existing cardiometabolic conditions, like metabolic syndrome (Chan, Cathomas, & Russo, Reference Chan, Cathomas and Russo2019), and social stress exposure (Finnell & Wood, Reference Finnell and Wood2018) to major depressive disorder. Hypothesized ways this occurs through certain inflammatory factors (e.g. IL-6, TNF) crossing the blood-brain barrier and pro-inflammatory cytokines degrading the integrity of the blood-brain barrier (Finnell & Wood, Reference Finnell and Wood2018).
Our findings of increased AL are with subthreshold depressive, but not depression-likely, symptoms may have occurred for several reasons. Persons with subthreshold depression may be less likely to be prescribed medication and/or given appropriate mental health support (Tuithof et al., Reference Tuithof, ten Have, van Dorsselaer, Kleinjan, Beekman and de Graaf2018), compared to persons with major depression (Xiang et al., Reference Xiang, Leggett, Himle and Kales2018). At baseline, our participants with depression-likely symptoms were more likely to report taking depression medication. Higher health care utilization by persons with major depression (Luppa et al., Reference Luppa, Sikorski, Motzek, Konnopka, Konig and Riedel-Heller2012) may also indicate that they, compared to those with subthreshold depression, may be more likely to be screened and treated for co-morbid health conditions. Additionally, people with depression may have poorer lifestyle behaviors (Kendzor et al., Reference Kendzor, Chen, Reininger, Businelle, Stewart, Fisher-Hoch and McCormick2014; Walsh, Senn, & Carey, Reference Walsh, Senn and Carey2013), poorer quality of life (Sivertsen, Bjørkløf, Engedal, Selbæk, & Helvik, Reference Sivertsen, Bjørkløf, Engedal, Selbæk and Helvik2015), greater cognitive impairment (Clarke, Skoufalos, Medalia, & Fendrick, Reference Clarke, Skoufalos, Medalia and Fendrick2016), or be less likely to adhere to medications to manage their other chronic conditions (Dirmaier et al., Reference Dirmaier, Watzke, Koch, Schulz, Lehnert, Pieper and Wittchen2010), underscoring the complexity of the depression–AL relationship.
This study has several limitations. First, the CES-D may reflect temporary symptoms rather than clinically-diagnosed depression. However, symptoms can capture perceived feelings which may not otherwise be ascertained in a population, like Puerto Ricans, where depression is often undiagnosed and diagnosis is stigmatized (Lopez, Sanchez, Killian, & Eghaneyan, Reference Lopez, Sanchez, Killian and Eghaneyan2018; Vega, Rodriguez, & Ang, Reference Vega, Rodriguez and Ang2010). Our analyses may not capture all ideal AL parameters, as a standardized AL definition does not exist; however, we used biomarkers representing multiple systems, including primary biomarkers (i.e. neuroendocrine) which is strongly recommended (Gallo, Fortmann, & Mattei, Reference Gallo, Fortmann and Mattei2014). Likewise, primary AL biomarkers have acute responses to external stimuli and changes in circadian rhythms, thus, our single-point assessment may limit their accuracy (Gallo et al., Reference Gallo, Fortmann and Mattei2014). Additionally, we only had one inflammation marker, CRP, and IL-6 may be more correlated with depression (Bremmer et al., Reference Bremmer, Beekman, Deeg, Penninx, Dik, Hack and Hoogendijk2008). While our study findings provide a good representation of middle-aged and older Puerto Rican adults in the USA, which may be applicable to similar Hispanic/Latino groups, our bidirectional findings should be confirmed in other populations. Likewise, our small proportion of males in the cohort limited our ability to test sex-specific differences in the AL-depressive symptom relationship, which could provide additional insight for screening and treatment.
Our study has several notable strengths. First, we modeled the bidirectional relationships of depressive symptoms and AL using longitudinal data, which allowed us to investigate the effect of the exposure at baseline with the outcome over 5 years. Most previous studies have used cross-sectional data, limiting causal inference. Longitudinal data also permitted the use of multi-level, random intercept and slope models, accounting for both interindividual and intraindividual variation in outcomes. Depressive symptoms were assessed using the CES-D, a valid and reliable tool among Hispanics/Latinos (Moscicki et al., Reference Moscicki, Locke, Rae and Boyd1989; Radloff, Reference Radloff1977; Tucker et al., Reference Tucker, Falcon, Bianchi, Cacho and Bermudez2000b). Our AL score included neuroendocrine and inflammation biomarkers, capturing upstream, in addition to downstream, dysregulation. We also adjusted for most health behaviors in our models, important confounders (Duivis et al., Reference Duivis, de Jonge, Penninx, Na, Cohen and Whooley2011; Forrester et al., Reference Forrester, Leoutsakos, Gallo, Thorpe and Seeman2019; Mattei et al., Reference Mattei, Bhupathiraju and Tucker2013).
Through the AL framework, this study provides new insights into bidirectional pathways connecting the commonly comorbid conditions of depression and chronic disease, while underscoring the underestimated consequence of subthreshold depressive symptoms on allostasis. Improved and expanded depressive symptom screenings in clinical and public health settings would cast a wider net to better capture marginalized individuals that need treatment, regardless of existing chronic diseases. Simultaneously, promoting greater access to subthreshold and major depression diagnosis and treatment may provide primordial or primary prevention of chronic diseases, and may connect individuals with existing chronic disease to necessary resources and support to help them reduce their risk of depression. Future research should explore practical ways for clinicians and practitioners to expand depressive symptom screenings and should test the effects of depression treatments on AL and the effects of behavioral interventions for chronic disease on depressive symptoms. Likewise, future investigations into potential moderating factors, such as socioeconomic status, acculturation, and health behaviors, may help identify individuals at highest risk of depression or AL.
Supplementary material
The supplementary material for this article can be found at https://doi.org/10.1017/S0033291720005139.
Author contributions
ACM, RSX, and JM conceptualized the study questions. ACM and RSX conducted the analysis. ACM wrote the manuscript. KLT acquired the funding for the cohort. All authors reviewed and edited the manuscript, and all authors approved the final version.
Acknowledgements
The Boston Puerto Rican Health Study was supported by the National Institutes of Health (NIH)-National Institute on Aging (P01-AG023394) and by the US Department of Agriculture, Agriculture Research Institute (58–1950-7-707). Dr Amanda C. McClain received support for this study from a NIH-National Heart Lung and Blood (NHLBI) Mentored Research Scientist Development Award (K01-HL150406). Dr Josiemer Mattei received support for this study from a NIH-NHLBI Mentored Career Development Award to Promote Faculty Diversity (K01-HL120951).
Conflicts of interest
None.
Ethical standards
‘The authors assert that all procedures contributing to this work comply with the ethical standards of the relevant national and institutional committees on human experimentation and with the Helsinki Declaration of 1975, as revised in 2008.’ and ‘The authors assert that all procedures contributing to this work comply with the ethical standards of the relevant national and institutional guides on the care and use of laboratory animals.’