I. INTRODUCTION
In recent years, layered silicate nanocomposites have gained enormous academic and industrial research interest.Reference Picard, Vermogen, Gérard and Espuche1–Reference Hegde and Bhat4 Studies have often shown enhanced properties in the final products derived by clay loading as low as 0.5 wt% compared to conventional composites with a large amount of fillers. The nanoclay dispersion is currently being used to improve modulus, tensile strength, barrier properties, flame resistance, and thermal and structural properties of many plastics instead of conventional micron-size additives.Reference Kojima, Usuki, Kawasumi, Okada, Fukushima, Karauchi and Kamigaito5–Reference Loo and Gleason7
Polypropylene (PP) is one of the most widely used polymers in the form of film, fiber, nonwovens, and molded products. It is used in a wide range of applications ranging from nonwovens used for baby’s diaper to industrial and home furnishing products. The major advantages of PP are its low cost, high strength, toughness, low processing temperature, and good resistance to chemicals.Reference Mazhani8
Crystal structure of PP is very well investigated before and depends on the tacticity and crystallization condition.Reference Karger-Kocsis9, Reference Brückner, Meille, Petraccone and Pirozzi10 The most commonly found form of isotactic PP is the monoclinic α-form (a = 0.665 nm, b = 2.096 nm, c = 0.650 nm, and β = 99.33°). The β-phase is often observed on isothermal crystallization in an intermediate temperature range (105–140 °C) or on slow cooling through this range.Reference Zheng, Lu, Toh, Zheng and He11 Influence of nanoclay additives on the crystal structure of PP has also been previously investigated. The nanoclay additive at low concentrations is also known to suppress the formation of the β-phase.Reference Zheng, Lu, Toh, Zheng and He11 The γ-crystalline form with the orthorhombic unit cell (parameters, a = 0.851 nm, b = 0.995 nm, and c = 4.168 nm) is the least observed, and it is formed in the case of melt crystallized at high pressure or under restriction.Reference Karger-Kocsis12 Yuan et al.Reference Yuan, Deshmane, Pesacreta and Misra13 have shown epitaxial growth of γ-phase in the presence of nanoclay additives.
Nanoclay based on montmorillonite is a layered mineral deposit of smectite family extracted from volcanic ash deposit in brine seas.Reference Douglas, Karl and Donald14 Individual clay particle has high aspect ratio with surface area of ∼600 nm2 and thickness of only 1 to a few nanometers. Crystal structure of silicate layer consists of central octahedral sheet of alumina or magnesia fused to two external silica tetrahedron sheets. Charge on the surface is known as cation exchange capacity (CEC) expressed in meq/100 g. Leuteritz et al.Reference Leuteritz, Pospiech, Kretzschmar, Willeke, Jehnichen, Jentzsch, Grundke and Janke15 compared nanocomposites of four different natural clay (montmorillonite)-layered silicates with different CEC in PP. Highest impact strength properties are observed for the nanocomposites with the highest CEC.
Silicate clay layers have polar hydroxyl groups, which make them incompatible with nonpolar olefins. Thermodynamically, the strongly hydrophilic clay and hydrophobic polymers lack attractive enthalpic forces to overcome the electrostatic force that pulls sheets together. The free energy of mixing between clay and polymer is positive and so the mixing is not thermodynamically favorable. So in natural form, clay can disperse only in hydrophilic polymers. To render the surface more organophilic, cations of surface has to be replaced by cationic surfactants.16–Reference Greenland19 In melt compounded system, to create favorable enthalpic interactions and to lower surface free energy to achieve exfoliation of the clay requires the inclusion of a “compatibilizer.”Reference Hasegawa, Kato, Tsukigase and Usuki20–Reference Rogers, Takacs and Thompson22 Such agents are tailored to have an enthalpic attraction with the clay surface as well as with the chains of the polymer, mitigating the poor thermodynamics of mixing, thus making production of a well-dispersed exfoliated clay–polymer nanocomposite with strong interfacial adhesion possible.
PP-grafted maleic anhydride (PP-g-MA) is a widely investigated compatibilizer. Seo et al.Reference Seo, Kim, Kim and Kim23 compared the crystallization kinetics of i-PP and maleic anhydride grafted PP (m-PP) and their blends. Crystallization half time (t 1/2) for m-PP was lower than that of i-PP. It was suggested that diffusional activation energy is lower for maleic anhydride grafted PP, whereas the nucleation rate is higher. This results in the formation of finer morphology.Reference Seo, Kim, Kim and Kim23 Kim et al.Reference Kim, Lee, Lee, Ha, Park and Char24 investigated the crystallization kinetics of maleated PP–clay hybrids with additive wt% ranging from 3 to 20. They found that the crystallization rate of modified silicate hybrids was slower compared to natural nanoclay hybrids. Unmodified silicate platelets formed agglomerate and hence acted as nucleating agents, whereas the exfoliated modified silicate platelets acted as barriers for crystallization.
The extent of intercalation of polymer chains within the clay galleries depends on the processing conditions and amount of clay present in the system. Maiti et al.Reference Maiti, Nam, Okamoto, Hasegawa and Usuki25 reported that at high temperatures, crystallization rate is slow, hence the polymer chains are in melt state for longer duration and have enough time to intercalate inside the galleries. Higher segregation of clay particles was observed at higher crystallization temperatures due to the existence of molten state for longer time. At low crystallization temperatures, the system solidifies quickly and hence the diffusion of chains in between the clay galleries is minimal.
In this research, PP concentrates with 1 to 15 wt% Cloisite Na+ additives were investigated for crystallization kinetics and mechanism. Crystallization mechanism is analyzed using a combination of different techniques. Importance was given to understand the crystallization mechanism and to investigate the extent of inclusion/exclusion of clay platelets from PP matrix at different weight percentage (wt%) of clay.
II. EXPERIMENTAL
A. Materials and sample preparation
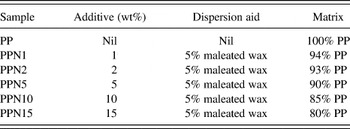
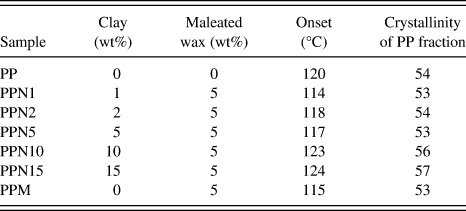
Polymer concentrates for this research were generously provided by Techmer PM (Clinton, TN). The isotactic PP with melt flow rate of 35 g/10 min, maleated wax, and different wt% Cloisite Na+ were melt compounded in a counter-rotating twin screw extruder (L/D = 28:1 mm). The extrusion zone temperature was maintained in the range of 205–210 °C. Concentrates and their composition are shown in Table I.
Polypropylene (PP) concentrates used for injection molding trial.

B. Testing and characterization
1. Differential scanning calorimetry (DSC)
The melting and crystallization behaviors of concentrates were analyzed using the Mettler Toledo DSC 822e (Columbus, OH). The instrument was calibrated using an indium standard with a melting point (T m) of 156.8 °C. Samples (5–7 mg) were heated in the temperature range of 25 to 200 °C at a heating rate of 20 °C/min, held at 200 °C for 5 min and cooled at 20 °C/min in a N2 atmosphere. Percentage of crystallinity, X c%, of nanoclay-incorporated samples was calculated from enthalpies of crystallization using Eq. (1),

where ∆H is the measured heat of fusion of the sample, ∆H 100% is the heat of fusion of the 100% crystalline PP, which is taken as 190 J/g for this study, and ϕ is the sum of weight fraction of additive and maleated wax.26 For isothermal crystallization kinetics studies, samples of ∼6 ± 0.5 mg were heated from 40 to 200 °C/min, held at 200 °C for 15 min, cooled from 200 °C to different crystallization temperatures (120, 123, 125, 128, and 130 °C) at a cooling rate of −60 °C/min and held for 30 min. All these crystallization temperatures were in the range for β-phase formation.
The relative crystallinity at different crystallization time, X (t), was obtained from the ratio of the area of the exotherm up to time t divided by the total exotherm given by Eq. (2).
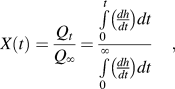
where Qt and Q ∞ are the heat generated at time t and infinite time, respectively, and dh/dt is the heat flow rate.Reference Weng, Chen and Wu27 Observed increase in crystallinity with time X(t) was estimated by Avrami equation (3), which represents unimpeded spherical crystal growth.Reference Mucha and Królikowski28

Equation (3) can be rearranged as Eq. (4),

From the plot of ln[−ln(1−X (t))] versus ln(t), Avrami exponent n (slope) and rate constant K (y-intercept) were determined.Reference Avrami29 For spherulitic form of crystal growth, n values are often obtained between 1 and 4.
2. Crystallization half time, t 1/2
The crystallization half time, t 1/2, is a convenient measure of the rate of crystallization. It is the time at which the extent of crystallization is 50% of the attained crystallinity. Experimentally, t 1/2 can be derived from the plot of relative crystallinity X(t) versus time t. The molecular weight, presence of plasticizer, and its influence on the course of crystallization can be assessed by t 1/2.Reference Sharples30
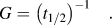
3. Rate of crystallization, G
Reciprocal of half time, G, can be used as an indication of the crystallization rate, as given by Eq. (5),Reference Weng, Chen and Wu27
4. Polarized light microscopy (PLM) analysis of spherulite crystallization
Experimental conditions used for isothermal crystallization kinetics of PP concentrates in DSC analysis were simulated using the combination of hot-stage and polarized light microscope. The spherulite micrographs of different PP concentrates at 125 and 135 °C were analyzed using METTLER FP82HT hot stage (Columbus, OH) controlled by FP90 Processor. Two separate hot stages were used for this analysis. Small samples were first placed on a glass slide on the hot stage, which was maintained at 250 °C. After complete melting, the glass slide was shifted to the second hot stage, which was maintained at the preset crystallization temperatures of 125 and 135 °C. At 125 and 135 °C, spherulite micrographs were taken at 300, 600, and 900 s using Olympus BX51 polarized optical microscope (Center Valley, PA) in transmission mode.
5. Scanning electron microscopy (SEM)
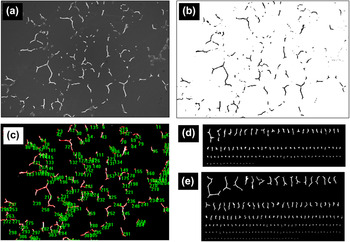
SEM images of the spherulite and interspherulite regions were taken using the Leo 1215 electron microscope with field emission gun. The samples were coated with gold for 10 s using the SPI sputter coater. Image magnification was in the range of 100–1700×. Total area of SEM image was used as reference to calculate interspherulite region. SEM image of sample with 1 wt% clay is shown in Fig. 1(a). SEM images were converted into black and white image using Image J software as shown in Fig. 1(b). The total area of interspherulite region in SEM image was calculated using count/size tool available in Image Pro plus as shown in Fig. 1(c). Interspherulite region for control PP and PPN1 is arranged according to their size as shown in Figs. 1(d) and 1(e). Clearly, there is an increase in interspherulite region for PPN1.
(a) Scanning electron microscopy (SEM) image of concentrate with 1% clay additive, (b) micrograph processed with Image J software, (c) image Pro plus count size tool, (d) inter-spherulite region objects in control polypropylene (PP) arranged according to size, and (e) inter-spherulite region objects in concentrate with 1 wt% clay additive arranged according to size.

6. Energy dispersive spectrometer (EDS)
Oxford Pentafet EDS system (Buckinghamshire, UK) was used to evaluate chemical composition of interspherulite region. ZAF quantitative method: ZAF (three iterations) with the system resolution of 127 eV and running Link ISIS software was used for data analysis.
7. Transmission electron microscopy (TEM)
The nanocomposite morphology, extent of PP chain intercalation between clay platelets was studied by TEM. Thin sections of thickness less than 70 nm perpendicular to machine direction of injection-molded bar samples were prepared using RMC Power tome CRX microtome (Mesa, AZ) equipped with the diamond knife. TEM image of section was obtained from Hitachi H-800 (Tokyo, Japan) operated at 200 kV.
III. RESULTS AND DISCUSSION
A. Nanocomposite morphology
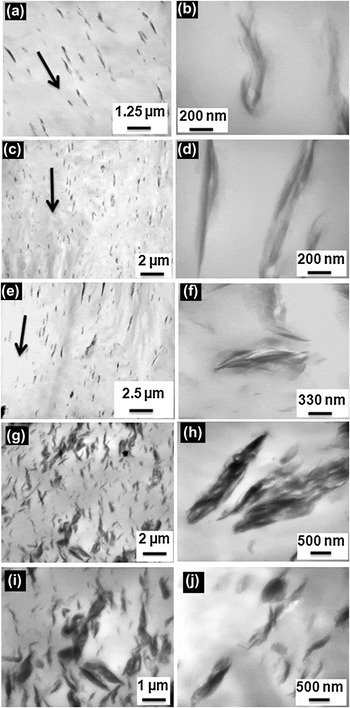
TEM micrographs of PP with 1–5 wt% clay are included in Figs. 2(a)–2(f). Micrographs revealed intercalated and flocculated morphology for all the samples.Reference Ray and Okamoto31 Sections revealed preferential orientation of platelets for sample with low wt% of additives [Figs. 2(a), 2(c), and 2(e)]. Shear-induced preferential orientation of clay platelets parallel to the surface of mold has been investigated and reported before.Reference Shen, Tjiu and Liu32 The observed orientation behavior is due to the sensitive response of layered nanoparticle to shear deformation.Reference Wang, Zhao, Yang, Liang, Zhang, Du, Fu, Yu and Chen33 TEM micrographs of PP with 10 and 15 wt% are shown in Figs. 2(g)–2(j). The micrographs of these clay stacks at high magnification show fine clay platelets and galleries dispersed without appreciable order or orientation.
Transmission electron microscopy images of (a) PPN1, (b) PPN1 at high magnification, (c) PPN2, (d) PPN2 at high magnification, (e) PPN5, (f) PPN5 at high magnification, (g) PPN10, (h) clay stack in PPN10 at high magnification, (i) PPN15, and (j) clay stack in PPN15 at high magnification.

B. Thermal analysis and crystallization mechanism
1. Melting and crystallization
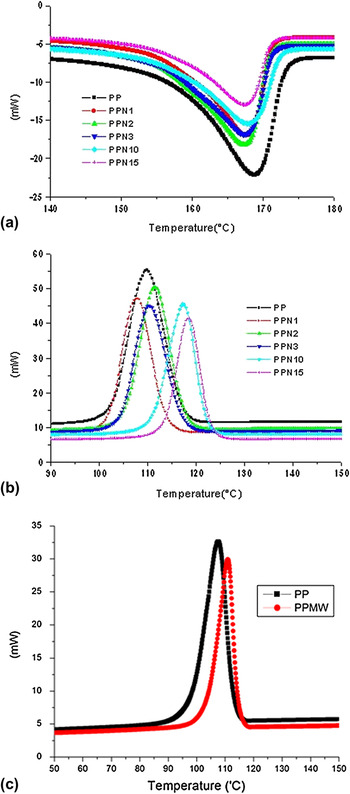
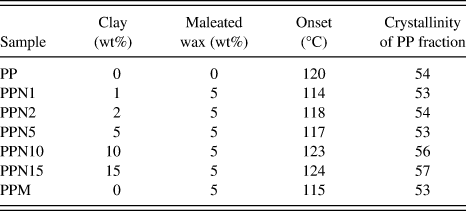
Influence of clay additive on the crystallization mechanism was investigated using DSC. DSC scan results from heating and cooling segments are shown in Figs. 3(a) and 3(b), respectively. Compared to lower concentrations, the peak crystallization temperature is 10 °C higher for samples PPN10 and PPN15 [Fig. 3(b)], which indicates more nucleating effect of the clay. Reason for this more nucleating effect will be discussed later. Maleated wax is just another noncrystallizing fraction similar to clay additive. Hence, for calculating the crystallinity, wax and clay are also accounted as shown in Eq. (1). Within the experimental error, there is no difference in the crystallinity of the samples with less than 5% clay additive, and the presence of maleated wax also has little effect on the crystallinity of the PP fraction. PPN10 and PPN15 showed slightly higher crystallinity. This appears to be due to higher nucleating effect in these concentrates. Differences could also involve the distribution of clay platelets in these two concentrates compared to PPN1, PPN2, and PPN5 as observed in TEM micrographs.
Differential scanning calorimetry (DSC) scans of different samples in (a) heating cycle, (b) cooling segment, (c) thermal analysis cooling segment of PP with wax.

Effect of 5 wt% wax on the crystallization was also investigated. Results of cooling segments for PP with 5 wt% wax PPM are shown in Fig. 3(c). There is no appreciable influence of wax on the crystallization of PP. Results of crystallinity for PPM is shown in Table II. As noted above, the crystallinity of the PP is not much affected by the presence of the maleated wax in the absence of clay. This indicates that the difference in crystalline fraction and crystallization behavior is imparted by the presence of clay additives rather than the presence of wax.
Thermal analysis results for different concentrates.
2. Isothermal crystallization kinetics
Results of isothermal crystallization kinetics are shown in Figs. 4(a)–4(c). Sigmoid shape is observed for all the samples. Crystallization involves two steps: primary crystallization that involves initial nucleation and growth and secondary crystallization that involves internal changes and perfection within spherulites. Effect of different wt% of nanoclay additives on the relative crystallization kinetics at 125 °C is shown in Fig. 4(a). There is significant difference in relative crystallization kinetics for samples PPN10 and PPN15 compared to PPN1, PPN2, and PPN5 as shown in Fig. 4(a). Concentrates PPN1, PPN2, and PPN5 reach saturation after control PP. However, samples PPN10 and PPN15 attain saturation before control PP. Antinucleating effect is observed for the lower wt% clay concentrates PPN1, PPN2, and PPN5. Sigmoid shape shifts toward longer duration. This is due to good dispersion and hindrance to polymer chain mobility. In the case of PPN10 and PPN15, high nucleation rate overrides the slow diffusion rate. Large number of smaller spherulites in unit area reduce the time required to fill the interstices. This difference in chain mobility and crystallization will be clearer in PLM results section.
DSC isothermal crystallization kinetics study results: (a) relative crystallinity versus time for different PP concentrates at 125 °C measured using DSC, (b) effect of temperature on crystallization kinetics of control PP, and (c) effect of temperature on crystallization kinetics of PPN15.

Effect of crystallization temperature on the isothermal crystallization of control PP and concentrates with clay (PPN15) is illustrated in Figs. 4(b) and 4(c), respectively. For both the samples, with increasing crystallization temperature (T c), the crystallization shifts to longer time and crystallization peak becomes flatter. Observed results of decrease in crystallization rate at higher crystallization temperature (T c) are in complete agreement with the kinetic theory of crystallization. Increase in the crystallization temperature will result in a decrease in supercooling (ΔT = T m−T c) and lower nucleation and growth rate.Reference Mubarak, Martin and Harkin-Jones34 Even at high temperature, crystallization rate is higher for concentrates with higher wt% of clay. For PPN15 [as shown in Fig. 4(c)], at each crystallization temperature of 120, 123, 125, 128, and 130 °C, the rate of transformation is quicker compared to that of control PP [Fig. 4(c)]. This shows that PPN15 exhibits substantially greater nucleation and crystallization at higher temperature compared to control PP.
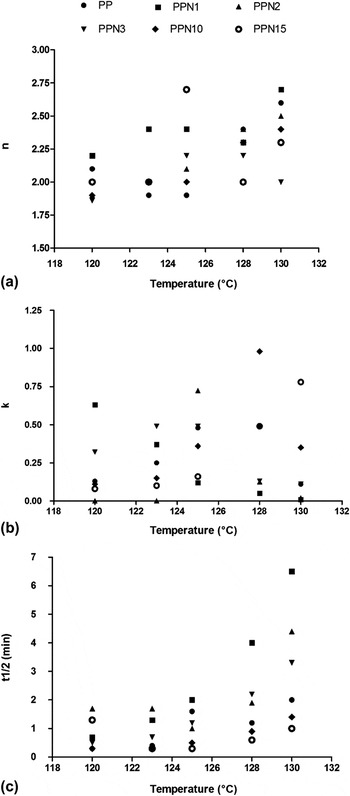
From the plots of log[−ln(1 − X(t))] versus log(t), Avrami exponent (n) and Avrami rate constant (K) were determined. Results of Avrami exponent (n), rate constant (K), and half time of crystallization (t 1/2) are shown in Fig. 5. Avrami’s exponent “n” showed increasing trend with increase in crystallization temperature (T c) as shown in Fig. 4(a). The “n” varies within the range of 1.8–2.7, which is due to spherulitic form of crystal growth.Reference Mazhani35 The value of “n” of ∼2.0 indicates instantaneous nucleation and growth of crystals, which is probably two-dimensional under the experimental conditions.Reference Wunderlich36
Crystallization parameters (a) Avrami exponent “n”, (b) Avrami rate constant “K”, and (c) half time of crystallization at different crystallization temperatures.

The rate constant (K) showed increasing trend till 128 °C for PP and decreased at 130 °C. For the concentrates with low wt% of clay, rate constant (K) did not show any specific trend. For the PPN10, the rate constant (K) showed increasing trend till 128 °C and decreased at 130 °C, whereas for PPN15, rate constant (K) was higher even at 130 °C. This indicates the presence of greater rate of crystallization even at higher temperature, within the time frame of the experiment.
Results of crystallization half time, t 1/2, which is the time at which the extent of crystallization is 50% of the attained crystallinity, are shown in Fig. 5(c). Results show parabolic trend. For each sample, the t 1/2 is least at one crystallization temperature. For PP, the t 1/2 is least at 123 °C. The t 1/2 is higher for PP, PPN1, PPN2, and PPN5 compared to PPN10 and PPN15. This further illustrates higher crystallization rate in PPN10 and PPN15.
Avrami analysis just gives qualitative data and hence care should be taken while making conclusion about the observed n and K values.Reference Sharples30 Better interpretation of nucleation, morphology, and the mechanism of crystallization should be made by the combination of different analysis techniques.Reference Wang, Zhao, Yang, Liang, Zhang, Du, Fu, Yu and Chen33 So the crystallization kinetics studies were also carried out using polarized light microscope and hot stage.
C. Crystallization mechanism analysis using PLM
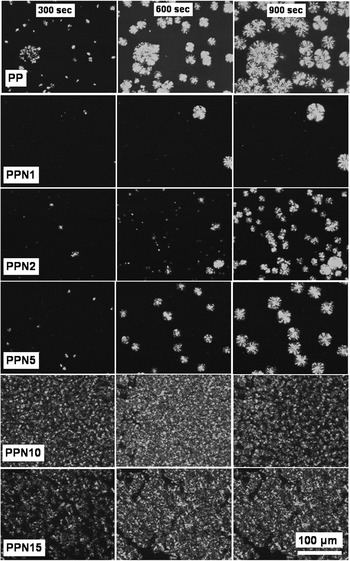
To understand the difference in crystallization mechanism in detail between different concentrates, the spherulite analysis was carried out at different temperatures using hot stage and polarized optical micrograph (POM). Small samples were first placed on glass slide on the hot stage, which was maintained at 250 °C, and the POM image of molten phase of each concentrate at 250 °C was examined. PP and PPN1 showed homogenous featureless melt, whereas appearance of 1- to 2-μm-size features was observed in the case of PPN2 and PPN5. In the case of PPN10 and PPN15, 10- to 15-μm-size clay agglomerates were observed (at 250 °C).
After melting, the glass slide was shifted to the second hot stage, which was maintained at the preset crystallization temperature of 125 or 135 °C. Spherulite micrographs were taken at 300, 600, and 900 s using Olympus BX51 polarized optical microscope (Center Valley, PA) in transmission mode.
Sequence of spherulite photographs at 300, 600, and 900 s for the different concentrates at 125 °C is shown in Fig. 6. Control PP has a large number of small spherulites. But PPN1, PPN2, and PPN5 have fewer but larger well-developed spherulites. In the case of PPN10 and PPN15, complete area of the micrographs is full of fine spherulites at all crystallization times examined.
Sequence of photographs of different concentrates at 125 °C at 300, 600, and 900 s for different samples (crystallization conditions are included in the Experimental section).

Micrographs of PPN1, PPN2, and PPN5 reveal lower nucleation rate and less impingement compared to control PP, which is due to hindrance to polymer chain diffusion by relatively well-dispersed fine clay platelets. These results are in complete agreement with reduced crystallization rate observed in isothermal crystallization kinetics [Fig. 3(a)]. The delayed sigmoid shape for PPN1, PPN2, and PPN5 compared to control PP is due to hindrance to polymer chain diffusion by dispersed clay platelets, whereas in the case of PPN10 and PPN15, high nucleation rate dominates the slow diffusion of chains and results in a large number of small spherulites.
Sequences of photographs at 300, 600, and 900 s for the different concentrates at 135 °C are shown in Fig. 7. Spherulite density is much lower in the case of PPN1, PPN2, PPN5, and control PP. However, for PPN10 and PPN15, the microstructure remains full of a large number of well-dispersed spherulites. The results confirm the presence of significant nucleation sites at high temperature for the concentrates with higher wt% of clay additives. Results shown in Figs. 6 and 7 are in complete agreement with DSC crystallization kinetics [Fig. 4].
Sequence of photographs of different concentrates at 135 °C at 300, 600, and 900 s (crystallization conditions are included in the Experimental section).

D. Thermodynamics
Thermodynamically, the strongly hydrophilic clay and hydrophobic polymer chains lack attractive enthalpic forces to overcome the electrostatic force, which pulls sheets together. Although there is an enthalpic benefit to dispersing the ordered clay sheets into the polymer, restriction of polymer chains within clay galleries would lead to a reduction in their entropy. The net effect is that the free energy of mixing between clay and polymer is positive, so the mixing is not thermodynamically favorable. Without a thermodynamic drive to disperse the clay sheets, they will instead readily agglomerate into large domains to minimize interfacial area and unfavorable surface free energy, with the polymer matrix. Agglomeration of clay platelets negatively impact mechanical properties, as clay agglomerates act as defect sites where the composite is weakened. Also, polymer chains will have inferior adhesion with agglomerated clay, thus poor load transfer between clay and the polymer matrix. An ideal nanocomposite system would essentially have dispersed particles on the molecular scale with strongly adhered polymer chains. Along with the above-mentioned thermodynamic driving force, crystallization, chain diffusion, and spherulite formation also govern the nanocomposite morphology.
E. Exclusion of clay during spherulite formation and growth
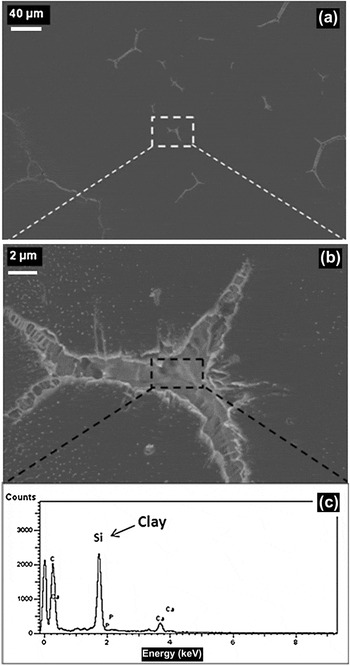
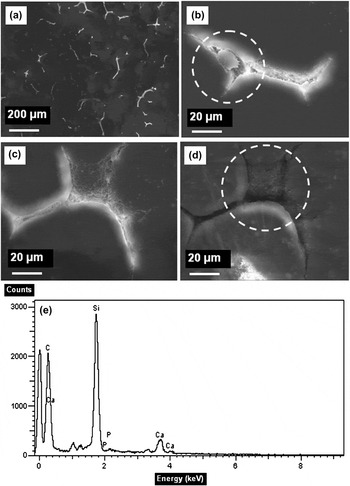
The thermodynamics of the system suggests that the dispersion of nanoclay would likely be unstable and the clay may be moved to spherulite boundaries during crystallization. To investigate and elucidate exclusion of clay platelets from growing spherulites, a combination of SEM and EDS was used. SEM images of interspherulitic region and EDS scans of PPN1 and PPN10 are shown in Figs. 8 and 9. With the increase in clay wt%, higher segregation and hence an increase in the interspherulitic region was observed. Details of the method used to calculate the above interspherulite area are explained in Fig. 1. The area of interspherulitic region was 377 μm2 for control PP, 580 μm2 for PPN1, and 743 μm2 for PPN10. This segregation at the interspherulitic region is due to the exclusion of clay during crystallization and growth of crystals and spherulites.
SEM micrograph of interspherulitic region: (a) lower magnification, (b) higher magnification, and (c) energy dispersive spectroscopy (EDS) image of interspherulitic region of PP with 1 wt% clay.

SEM micrograph of interspherulitic region: (a) lower magnification, (b) crystallized species in the interspherulitic region (c) agglomerates in the interspherulitic region, (d) agglomerates in the interspherulitic region, and (e) EDS of interspherulitic region of PPN10.

F. Proposed model of crystallization and spherulite formation
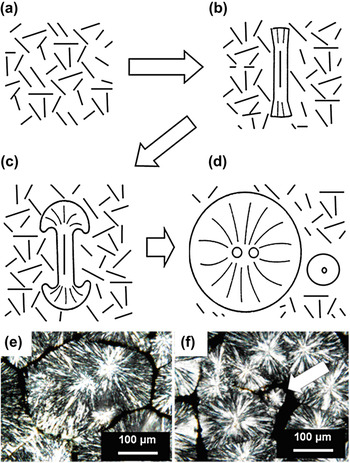
On the basis of the observed results, a schematic model of possible growth mechanism of spherulite nucleation and exclusion of clay platelets is shown in Figs. 10(a)–10(d). Clay stacks in molten matrix is illustrated in Fig. 10(a). Crystal development starts with nucleation on rod-like or plate-like units between the clay stacks, Fig. 10(b). The nucleation may also initiate between clay stacks. With the polymer chain diffusion and add-on, rod-like feature transforms to spherulite. Growth is different and changes with time as illustrated in Figs. 10(b)–10(d).Reference Sharples30 The clay platelets, which are unenclosed by PP chain and crystals, tend to be excluded out of spherulite and into the boundaries, as shown in Figs. 10(b)–10(d).
(a) Clay platelets in molten polymer matrix, (b) on cooling, spherulite nucleation occurs between clay stacks, (c) growth of large spherulite, (d) formation of smaller spherulites as a result of polymer chain deficiency and also due to crystallization of compounds that are more difficult to crystallize, (e) polarized light micrographs of PPN10, and (f) small size spherulite in between large spherulites.

Figure 10(e) shows two spherulites in the case of PPN10 that started to grow nearly at the same time, then merged and impinged. Also (for PPN10), in between large spherulites, there are smaller spherulites [Fig. 10(f)]. At the end of secondary crystallization (growth and perfection of spherulite), when there is scarcity of polymer chain, smaller spherulites are formed. These smaller spherulites are likely a result of crystallization of more slowly crystallizable components and crystallization of impurities, which are rejected from the growing fibrils during spherulite development.Reference Sharples30 This exclusion of slowly crystallizable species hinders the overall growth of spherulite.
Considering the presence of micron-size agglomerate for PPN2, PPN5, PPN10, and PPN15 in molten state at 250 °C, the mechanism of clay exclusion from the PP chains can be compared to zone refining of steel.Reference Mullin37
During the solidification, the clay platelets from the agglomerated mass, which are not included in spherulite, are excluded out to the spherulite boundary. These structural differences will have an impact on the mechanical and physical properties of the products produced from these compositions, which will be addressed in our further publications.
IV. CONCLUSIONS
Crystallization and morphology development in PP with various levels of nanoclay additives were investigated using a combination of thermal analysis, SEM, TEM, optical microscopy, and hot-stage microscopy. Different crystallization mechanisms were observed in PP at lower (1–5) wt% nanoclay additives compared to PP with higher wt% (10–15) of nanoclay in PP. Half time of crystallization (t 1/2) and maximum time for crystallization (t max) are higher for samples with 1 to 5 wt% clay additives compared to samples with 10 to 15 wt% clay additives due to hindrance to crystallization by large number of dispersed clay platelets. At the 10 and 15 wt% clay additives, the high nucleation rate overrides the slow polymer chain diffusion rate. It is difficult to achieve completely exfoliated morphology at high wt% add-on level. SEM micrograph and EDS scan results showed exclusion of clay platelets in the interspherulite region. During cooling and crystallization of molten PP concentrate with clay, unenclosed clay platelets are excluded and gather at interspherulite regions. Results illustrate that along with the thermodynamic driving force, which causes the clay platelet to agglomerate, spherulite formation also drives the ultimate morphology.
SUPPORTING INFORMATION
In this research, linear low-density polyethylene (LLDPE)-based maleated wax was used as a compatibilizer between polypropylene (PP) and Cloisite Na+. Schematic of possible interaction between the clay platelet, PP chain, and maleated wax is shown in Fig. S1.
ACKNOWLEDGMENTS
Special thanks to Techmer PM, Clinton, Tennessee for providing the concentrates. Financial support from the Center for Materials Processing (CMP) is also appreciated.