Introduction
Rice in Guinea Bissau plays a very important role in the agricultural and global economy of the country: several authors estimate that this staple crop reaches 75% of the consumed cereal, and more than 60% of the surface devoted to cereal farming (Temudo, Reference Temudo2011).
Strong transformation has been occurring in Guinea Bissau in this sector in the last 50 years (Chabal, Reference Chabal1988). Net exporter till the beginning of the ‘60s, nowadays the country has become a rice importer, with more than 60,000 tons/year of milled rice to cover the deficit. Moreover, rice is the rate of exchange of several goods, even cashew, the second crop of the State (Kyle, Reference Kyle2015; Nuijten et al., Reference Nuijten, Temudo, Richards and Okry2013).
In Guinea-Bissau, rice is currently produced in three ecosystems – rainfed uplands, lowlands (rainfed and irrigated), and mangrove swamp, with the latter mainly concentrated in the valleys of the rivers Mansoa and in the south of the country. In all the three ecologic conditions, rice is almost only cultivated during the rainy season, from May to October (Adaptation Fund, 2017; FAO and ICRISAT, 2019; Medina, Reference Medina2008). In some areas designated as bas-fond, irrigation can be practiced, and rice is also grown during the dry season (The World Bank Group, 2018).
The present work is focused on mangrove rice farming. This ecosystem is the most extensive rice cultivation system in Guinea Bissau where coastal areas are abundant (Cabral and Costa, Reference Cabral and Costa2017; IUCNC, 2018). Lower sides of mangrove rice fields are bordered by natural mangrove swamps. These plants act as breakwater, and once the strength of the waves is reduced, the water level is controlled by means of dikes of compacted earth manually built by farmers (Temudo and Cabral, Reference Temudo and Cabral2017).
Historically, mangrove swamp rice system has provided the bulk of production in the country (Souza and Luz, Reference Sousa and Luz2018). Nowadays, due to lack of repair and maintenance of infrastructure, especially following the civil war in the late 1990s, several areas are abandoned and no more cropped (Kyle, Reference Kyle2015; LVIA, 2016). Moreover, the steep productive decline in comparison with the Portuguese colonial period was also caused by global warming and to the inconsistent valorization of the local genetic material that the public institutions carried out (Havik et al., Reference Havik, Monteiro, Catarino, Correia, Catarino and Romeiras2018).
The manually built dykes are key elements to balance the hydrological system and regulate water flows (rain and marine). In fact, during the dry season, farmers let the tidal sea water inundate the paddy fields to provide nutrients and prevent the development of weeds. According to this set of practices, rice farmers developed varieties tolerant to salt and other abiotic stress (Adesina and Seidi, Reference Adesina and Seidi1995; FAO, 2000; UNFCC, 2006).
This rice production system is based on human labor with very limited possibility of mechanization. Rice is grown on furrows that can be as high as 0.5 m according to the position of the field and its submersion level (Andreetta et al., Reference Andreetta, Huertas, Lotti and Cerise2016, Nanque, Reference Nanque2015).
Despite research and development efforts focused on the development and introduction of improved varieties, production capacity failed to keep pace with rice consumption, lowering self-sufficiency from 0.78 in the ‘90s to 0.58 from 2001 to 2005 (Temudo and Schiefer Reference Temudo and Schiefer2003).
Due to the low possibility of mechanization and/or controlling environment parameters, such as water level and availability, genetic resistance to extreme abiotic factor was identified as a key point for increasing the quantity and stability of yield (Temudo and Schiefer, Reference Temudo and Schiefer2003).
Amid global concerns over poverty reduction, food security, and the failure of development interventions, studies on the effectiveness of research and development of modern rice varieties in West Africa have produced contradictory results (Adesina and Seidi, Reference Adesina and Seidi1995; Nuijten et al., Reference Nuijten, van Treuren, Struik, Mokuwa, Okry, Teeken and Richards2009; Zinnah et al.,Reference Zinnah, Compton and Adesina1993). In their study (Reference Dalton and Guei2003), Dalton and Guei reported productivity gains obtained because of rice varietal improvement in seven countries, but Guinea-Bissau was not included.
Currently, the New Rice for Africa (NERICA) varieties are being heralded as the foundation of a Green Revolution for Africa ensuring food security and poverty reduction (Dalton and Guei, Reference Dalton and Guei2003). While Diagne (Reference Diagne2006) argues that estimated potential adoption rates are far from being attained due to allegedly limited diffusion of seeds. Some scholars criticized the approach used in the development of NERICA varieties on the grounds that the war-torn rural populations in West Africa might benefit from reversing the mainstream breeding strategy by improving Oryza glaberrima Steud. with genes of Oryza sativa L. (Richards, Reference Richards2006). Nuijten et al. (Reference Nuijten, van Treuren, Struik, Mokuwa, Okry, Teeken and Richards2009) present evidence for new genotypes of interspecific hybrids of African and Asian rice that may be used in formal crop breeding. Davidson (Reference Davidson2010) has demonstrated that access to farmers’ explicit knowledge (whether technical, ritual, or otherwise) can be particularly difficult in societies—such as the West-African rice farming ones as this is deeply entangled with implicit, non-verbal knowledge and very complex communicative strategies.
Genetic material adopted in Guinea Bissau needs to have several traits. In fact, varieties need to be salt tolerant and adapted to flooding or aridness depending on the cultivation area. In some year, rice has to cope even with water paucity with a following period of flooding. Moreover, plants should resist to over maturity to permit harvest when favorable conditions occur. The really ample cropping conditions observed in this small country brought to a wide rice genetic variability (Temudo, Reference Temudo2011). At the present, the material cropped by farmers is a mixture of different ecotypes or varieties that lead to severe difficulties during cultivation, harvest, and milling. On top of this, the maximum yield obtainable could never be reached to the presence of not-performing plants for that condition. Bearing in mind these conditions, the adoption of varieties that came from other research programs never gave consistent and impacting results (Kanlindogbe et al., Reference Kanlindogbe, Sekloka and Kwon-Ndung2020).
To foster rice production, and in particular Mangrove rice, the first stepping stone was to furnish varieties stable among years and well adapted to these environmental characteristics. In fact, a good variety in mangrove ecosystem should have high salt adaptability; good productivity; a short medium growing cycle in upland swamp; a longer growing cycle in lowland swamps; reduced tall to help during manual harvest, with the exception of lowland swamps where water tends to become deep; generally, no husk for a better milling, with the exception of areas subjected to bird predation.
Unfortunately, the ecotypes grown in the environment were miscellaneous of several varieties and usually called with the local names that tend to be different from site to site or, by contrast, diverse names are used for really similar genetic material. The confusion made in the name of varieties made the exchange or the trade difficult and will not permit future improvement of agronomic practices.
In this context, the NGO Lay Volunteers International Association (LVIA) started in 2015 a series of programs focused on the improvement of the mangrove swamp rice cultivation. In this paper, the program adopted to improve genetic material and the bottom-up approach used to drive the program are explained and discussed. Namely, the paper describes:
-
the collection of recommendation and feedbacks from local farmers and technicians in the selection and collection of rice strains;
-
the adoption of accredited methods for biodiversity collection, identification, cultivation, multiplication, and assessments of rice strains (Jackson, Reference Jackson1995; Mew et al., Reference Mew, Borromeo and Hardy2001; Zhang and Schoenly, Reference Zhang and Schoenly1999; Zhu et al., Reference Zhu, Gale, Quarrie, Jackson and Bryan1998);
-
the assessment of the purity and homozygotic grade, as well as rice phylogenetic by mean of molecular analysis.
Material and Methods
Identification and assessments of local rice biodiversity with the bottom-up approach
At the end of the growing season 2015 the LVIA team, together with the consultancy of the Parco Tecnologico Padano (PTP) of Lodi and the coordination of Valoryza, started the survey of the rice biodiversity already present in the country and the collected sample grains in the Regions of Oio, Cacheu, and Tombali.
The collection was carried out through interviews to farmers in several villages where rice was cultivated as staple food. During these visits, all farmers of the village were asked about the best rice varieties cropped, as well as a sample of the grains for each variety. Together with the material collected, a basic questionnaire was fulfilled regarding the traits of each variety. In the questionnaire a description of the varieties was undertaken, for example, the length of the growing cycle (short, medium, or long); the resistance to stresses such as salinity, drought, flooding, and diseases; the milling easiness; and the provenience, if known.
Panicles of each accession were manually threshed, air dried, and seeds were stored at room temperature in dry conditions. To all collected samples, a numerical code was assigned from 1 to 103.
In order to make sample sized for the molecular analysis, a multiplication season was set in Bissorà (Lat.: 12.22243595995163, Long.:−15.44728322004333) in the dry season (November 2016 – May 2017). First multiplication of the material was conducted by seeding a single line of 1 m as elementary plot for each sample, divided by a half meter corridor from each plot, and a meter corridor by each row. Seeds were collected by a single panicle and directly seeded on wet soil; soil was carefully flooded 2 days after seeding. Fertilization was carried out before seed bed preparation with manure and weeds were manually removed. The collection from the multiplication plots was conducted by manually harvesting homogeneous panicles in the field, taking particular attention to avoid the harvest of different material. Samples were air dried and stored at room temperature.
Molecular analysis
Part of the material from the first multiplication was sent to Italy for a set of genotypic analysis. The effective correspondence between the name given during the collection and the real name was assessed by means of a molecular analysis carried out at the PTP, located in Northern Italy.
Samples were prepared for the DNA extraction through mechanical husk and hull removal. DNA profiling was attained using fingerprinting by SSR (Single Sequence Repeat) marker. DNA extraction was carried out twice on samples of 5 seeds each sample. NucleoSpin Plant II (Macherey-Nagel) was used for nucleic acid quantitation. Purity of extracted DNA was evaluated through spectrophotometric absorbance (ratio 260/280) that permitted to avoid the presence of proteins, phenolic compounds, and fatty acids from the extracted DNA.
Extracted DNA was analysed by means of 24 different SSR markers and subsequent runs on AB3730 electrophoresis sequencer. The SSRs used for this screening were previously evaluated for large-scale genetic essays on seeds representing wide variety of rice germplasm, both subspecies Oryza sativa indica and japonica, as well as Oryza glaberrima samples. Riclass library and Darwin and iTOL softwares were used for phylogenetic analysis.
Variety purification
At the beginning of 2016 rainy season (May–October), propagation material from Bissorà was seeded in the Village of Uncur (Lat.: 12.040861404304271, Long.: 15.486166469797375) where the population provided labor under LVIA team supervision. The multiplication was carried out adopting the technique of panicle – row, with the seeds form a single rice panicle grown in a row, with 3 replications per variety. This permitted to easily conduct further purification during the cropping season and to harvest only one row in case of differences due to crossing, segregation, or errors during transplant or the whole rows in case of homogeneous plants.
Seeding was conducted in both years first in a nursery and then when plants reached the stage of 4–5 leaves (BBCH 14–15) transplanted in open field. The distance between rows of the same variety ranged from 20 to 30 cm, depending on the year, while among varieties was 1 m. Weed control was conducted manually, as well as all other cropping operation, including harvest and threshing. Even if rice is considered to have a really low percentage of out-crossing, the field design was undertaken considering the length of the growing cycle of each ecotype on the base of the questionnaire fulfilled the first year and on the assessment of the flowering data during the second year, in order to offset flowering periods, and avoid crossing.
With the aim to describe and catalogue the collected rice biodiversity, in both seasons, the main plants and kernel morphometric traits were measured and assessed. This will help, in turn, to create the descriptive data sheet (technical sheet) of the material distributed to farmers.
The aim of the next molecular analysis was to assess if the genetic material, at the end of each growing cycle, reached the homozygosis, and the reproductions could begin. The technique adopted was the same previously described. The homozygous material was seeded in bigger fields, the other took two different ways, depending on the quality of the material. Ecotypes that resulted too much variable were abandoned, while on the others a subsequent set of panicle – row was performed in the following year.
Variety selection
After two years of purification, 20 varieties resulted to be homozygous and stable. These varieties were multiplied during 2018 to have a sufficient amount of material and to monitor appreciation by farmers.
Among the purified material, the decision regarding the varieties to spread among farmers and on the market was taken following a multi-criteria approach. For this purpose, the yield recorded was related to farmer’s appreciations. In fact, the opinions of farmers regarding the traits of the material to be cropped, sold, or consumed consider not only the production attainable but also the plant habitus, stress resistance, ease of collecting, and threshing. Every year (2016, 2017 and 2018), before collection, the farmers of the village were invited to express their preference on the cropped material. A simple percentage was assigned counting the number of preferences obtained per each accession related on the total amount of votes.
During the rainy seasons 2016, 2017, and 2018, an experimental field was established in Bissorà. In this area, the possibility to irrigate the plots permitted to obtain seed production in each year, as well as the evaluation of the potential yield in favorable and homogeneous conditions. Material of each variety was seeded separately in a nurse, and then transplanted when plants reached the stage of 4–5 leaves (BBCH 14–15). Fertilization was conducted by adding 50 kg/ha of N-P-K 15 – 15 – 15, while hand weeding was conducted twice per year. An area of 4 × 4 m was collected and air dried at open air until maturity moisture was reached (12%). Plants were manually trashed and seed cleaned and weighted.
Data collected were subjected to ANOVA with the free statistical software R, package agricolae (Ritz and Streibig, Reference Ritz and Streibig2005), and groups of homogeneity were detected with the Wallet post hoc test. Before ANOVA, the data were tested for homogeneity utilizing Levene test.
Results
Identification and assessments of local rice biodiversity with the bottom-up approach
At the end of the survey, 21 villages were visited with 84 samples collected. Nine villages were in the region of Cacheu with 38 samples collected, 46 samples in Oio on 8 villages, and 19 in the southern region of Tombali on 4 villages. The overall amount of sample was 103. The number of varieties collected in each village ranged from 2 to 9, demonstrating that growers tend to diversify varieties depending on fields conditions.
Historical variety of Guinea Bissau such as Selì, Kablac, and Tom demonstrated to be still widespread in the country, as more than 10 samples were collected in the 21 villages, confirming the high adaptation of this material to the local condition and the consequent importance to work on home-grown biodiversity. On the other side, an ample number of unique varieties showed the cultivation of segregated material really adapted to the peculiar village conditions.
Molecular analysis
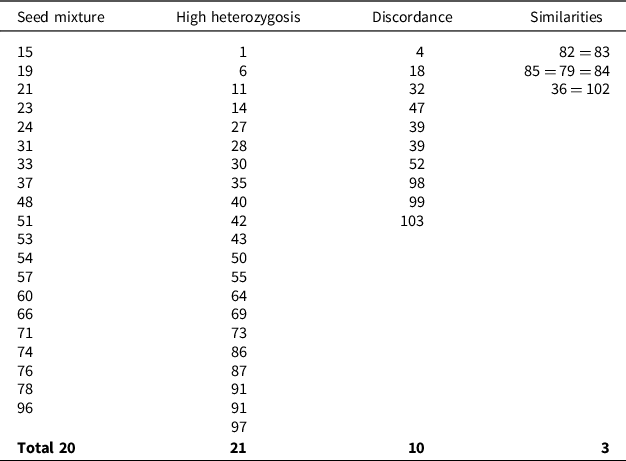
Genetic analysis permitted to clearly identify if a sample was referred to an ecotype or a mixed population (Table 1). Then, it was possible to merge same varieties called with different names, as well as plan the following purification process for material with a good grade of purity.
Results of the genetic analysis on collected populations in detail (numbers stand for the variety code)

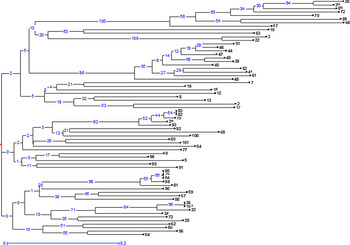
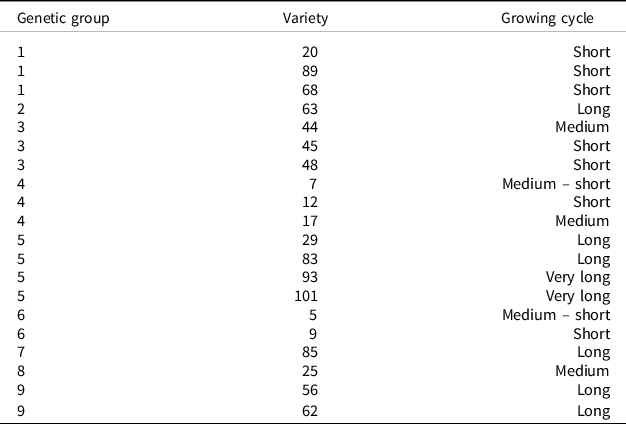
The results of the molecular analysis reported the presence of 9 genetic distinct groups with the possibility to merge together 7 samples in 3 pooled variety as their profile revealed to be exactly the same (Table 1 and Figure 1). Moreover, 20 samples were considered mixture of seeds and discarded. Twenty-one varieties resulted to have a high heterozygosis grade. In some cases, the two analytic replications performed were not in accordance, showing to be probably a seed mixture cropped from a long period. Highly variable accessions and mixture or samples in discordance were not used for the following steps but stored for a possible future use.
Phylogenetic tree for genetic diversity conducted with microsatellite polymorphism analysis.

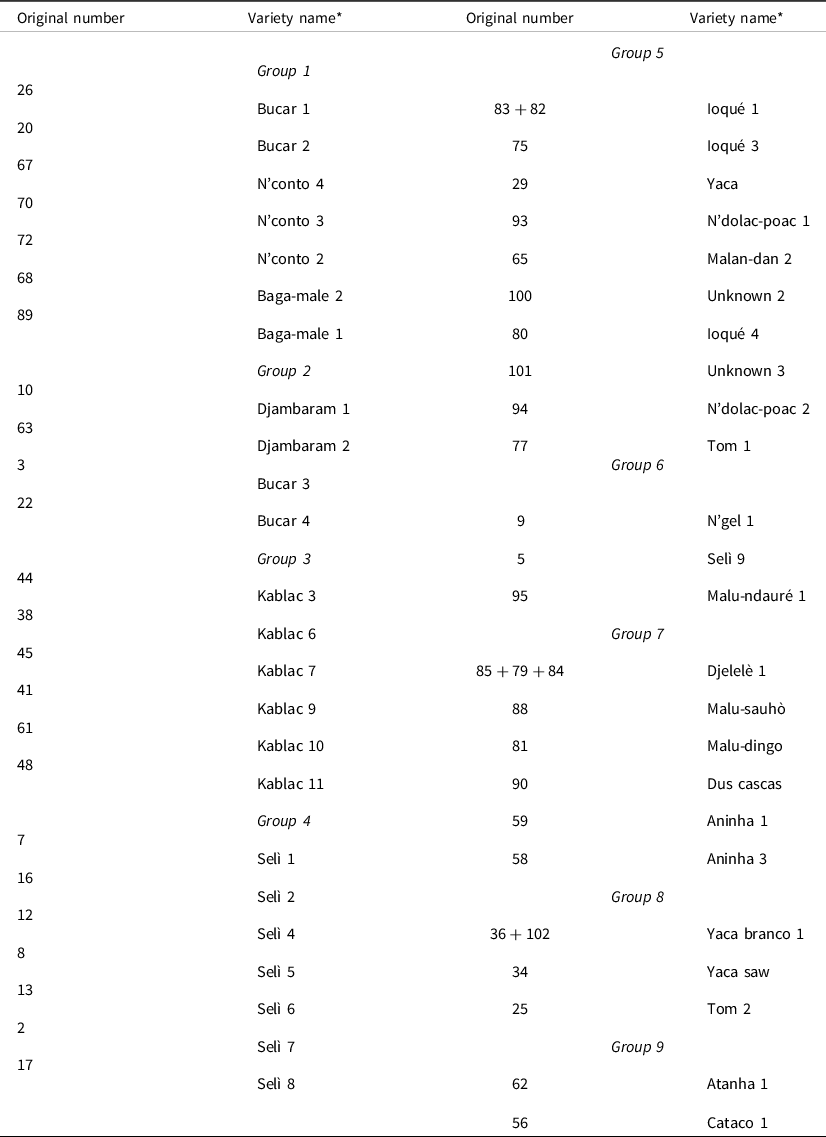
Considering the results obtained, the team decided to proceed with the purification activity on 52 ecotypes (Table 2), also considering the populations that were merged together.
Genetic grouping of the varieties used for the purification process with the name based on the original scouting and assigned code

Genetic grouping detected with the genetic analysis confirmed in several cases the name conferred by farmers to the accessions. As for example, groups 3 and 4 identified Kablak and Selì, respectively. More variegate was the classification for the other groups. In fact, group number 6 is formed by 3 varieties with different names, phylogenetically closely related with the other really variable group 5 (Figure 1).
The phylogenetic tree, drawn excluding mixtures and highly heterozygotic, confirmed the high homogeneity of groups 3 (Kablak) and 4 (Selì). The length of the branches in group number 1 may indicate a differentiation occurred long time ago followed by an isolation of the genetic material. Although it has to be considered that samples of group 1 came from both villages in the north (Gunal) and from the south (Campeane), enough isolated from the main towns.
Variety purification
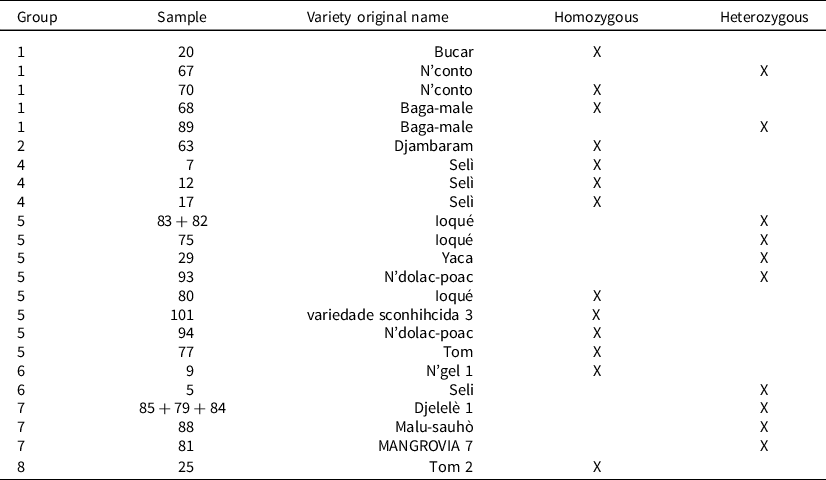
At the end of the rainy season 2016 (November), the analysis showed a good presence of material that can be considered ‘variety’ in the strict sense of the term, or ecotypes than can be potentially purified in the following cropping season (Table 3).
Samples with sufficient homogeneity that were re-seeded in the rainy season 2017

Even if still variable, some samples such as those of the groups 9 and 3, in order to avoid to lose an ample amount of genetic diversity, and due to the strong interest of farmers for those ecotypes, varieties 10, 26, 38, 44, 45, 48, 56 and 62 were maintained in the purification program in the following season.
At the second year, the varieties resulted homozygous and stable were 20 (Table 4). These varieties were multiplied during 2018 to have a sufficient amount of material and to collect appreciation by farmers.
Variety homozygous at the end of the rainy season 2017 that were sent to multiplication in 2018 and growing cycle type

Variety selection
At the end of the growing season 2018, the variety chosen to proceed with the diffusion where selected taking into consideration the growing cycle. In some areas of Guinea Bissau, where the rainy period is longer and with higher amount of precipitation, farmers tend to use longer growing cycle. Conversely, where rains are lower and irregular, growers prefer to crop shorter maturity varieties. To try to fulfill almost all the peculiarity of the country, at least one variety per growing cycle was selected.
On both yield and appreciation, the factor ‘Year’ did not result significant; therefore, the data were pooled together.
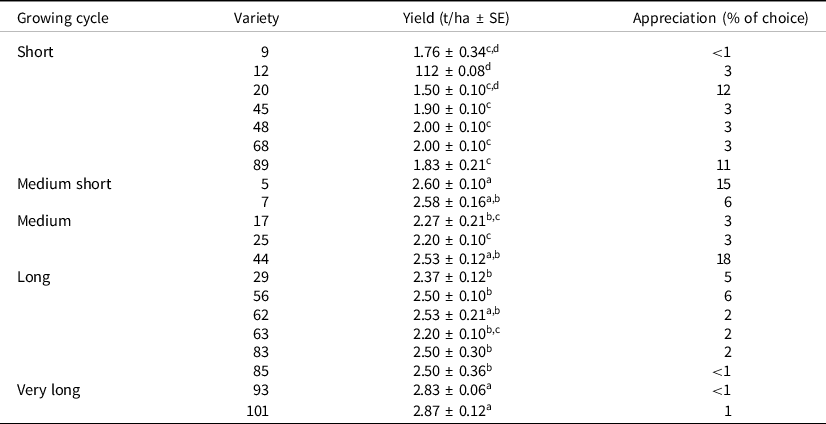
As expected, longer growing cycle varieties furnished higher yield (Table 5), with values higher than 2.8 t /ha, while medium reached no more than 2 t /ha. Although, it has to be noted that not in all conditions the productive values of the long and very long growing cycle can be obtained. In several cases, farmers prefer to use a shorter maturity variety with a grater possibility to have a yield. In fact, the majority of votes were expressed to medium, medium short, and short groups. Even if accession 101 resulted the more productive, together with 93, 62, 7, and 44, only the last received an appreciation higher than 6%. This confirmed the importance to include farmers in the decision process regarding improvement of genetic material. Variety number 7, even if high yielding and a slightly good appreciation, was not chosen due to the long awn on the panicle that made woman threshing troublesome.
Yield (t/ha) and farmer’s appreciation score for each variety. Letters refer to significance among varieties, according to the wallet post hoc test

SE, Standard errors.
Considering both the yield obtained and the overall appreciation by farmers, among the short variety number 20 (Bucar) and 89 (Baga-male) were selected, 5 (Selì) among medium-short, 44 (Kablak) among medium, 56 (Cataco) among long, and 101 for very long. The name of the last variety, the tallest and among the most productive, resulted unknown. The sample came from the south where the risk of flooding is higher, and it may probably come from Guinea Conakry, due to the normal exchange of material at the border.
Discussion
This paper described the methodology used and the results obtained to valorize local rice biodiversity in Guinea Bissau. Among the ample genetic material available in the country, no purification activities were carried out in the past decades. This led to the cultivation of mixture of populations or ecotypes and not to uniform varieties. In fact, considering the collected material, only on about 50% of ecotypes, the purification was carried out, ending with less than 20% of material considered stable and uniform.
In this country rice is cultivated under highly stressed conditions, rice paddies are small and with several peculiarities. Farmers known each plot and the possibility to choose among different varieties in terms of growing cycle, height, salt adaptation, etc., which will represent a terrific improvement in terms of yield and stability. Moreover, manual or simple mechanical milling could be positively affected by processing more uniform grains. Especially in the actual conditions, where the milling efficiency is very low due to rudimental machines and uneven grains.
After 4 years of activity, starting from 103 ecotypes collected through the country, 20 varieties were released with a good grade of purity, able to satisfy modern agriculture standards and the protocol promulgated by Cedao, valid in the State even if not adopted de facto. Due to the impossibility for the LVIA team to foster variety disseminations, 6 were multiplied and spread to growers.
Other than the results described in terms of number of varieties released, this work could furnish an example on the bottom-up approach adopted. In fact, the material used for the genetic improvements was collected among farmers, fostering local biodiversity potential. Growers were asked to furnish the ecotypes considered the most promising and appreciated for their specific traits. Then, along the multiplication and purification process, they learned how to maintain seeding material with a good grade of purity. Moreover, at the end of the project, they were asked again to select the varieties with the most positive traits. This represented, in turn, a win-win solution. Farmers obtained back an ameliorated material, and public resources were used to satisfy farmers need.
On top of this, the characterization carried out over the period could be used as starting point for future genetic improvements as well as varietal crossing to combine different positive rice traits. The material will also be assessed for salt adaptability and allelopathic potential as suggested by several authors (Mekawy et al. Reference Mekawy, Assaha, Yahagi, Tada, Ueda and Saneoka2015; Tesio and Ferrero, Reference Tesio and Ferrero2010).
The material not selected for dissemination among farmers will be maintained by the local LVIA team for further adaptation studies and genetic improvement.
Acknowledgements
The authors are glad to thank the LVIA team and the farmers for their precious collaboration and suggestions throughout the project.
Funding
The study was carried out thanks to the projects AID 010 308 “MANGROVIA – “Valorizzazione della risicoltura di mangrovia e tutela dei mangrovieti nelle Regioni di Cacheu, Oio, Tombali e Bolama-Bijagos” co-financed by AICS (Agenzia Italiana per la Cooperazione allo Sviluppo) and “No Intchi Mbema: Reforço da fileira da sementes de arroz” code FED/2016/378–916, co-financed by the European Union.
Conflicts of Interest
The authors declare no conflicts of interest.