Introduction
The US market for organic foods has grown rapidly in the past decade as they have become increasingly affordable and available in mainstream grocery stores. In 2000, conventional supermarkets for the first time sold more organic food than any other venueReference Dimitri and Greene1. Growth in the US organic industry has been fairly steady, averaging between 15 and 21% per year since 19972. Retail sales of organic foods increased from $3.6 billion in 1997 to $13.8 billion in 2005, representing 2.5% of total US food sales. Sales of organic foods are estimated to rise to $23.8 billion by 20103. Among the organic food categories, fruits and vegetables by far comprised the largest retail sales ($5.4 billion in 2005), having grown at an average annual rate of 21% during 1997–2003Reference Dimitri and Oberholtzer4.
Organic foods, once considered a niche product sold primarily in specialty shops, are gaining wider acceptance among consumers. According to the 2005 Whole Foods Market5 Organic Trend Tracker, 65% of Americans have tried organic foods and beverages, compared to 54% in both 2003 and 2004. An estimated 46% of total organic food sales are now handled by the mass-market channel, which includes supermarkets, grocery stores, mass merchandisers, and club stores2.
Organic products are credence goods—consumers do not know whether a product is organic unless they are toldReference Giannakas6. The US Department of Agriculture (USDA) standards for organic foods, implemented in October 2002, aim at boosting consumer confidence in the organic label and, hence, facilitating further growth in the organic food industry. Consumer preference for organic food based on perceived desirable attributes and characteristics has been widely documented. Yiridoe et al.Reference Yiridoe, Bonti-Ankomah and Martin7 provided a comprehensive review of literature on consumer perceptions and preference toward organic foods. Organic food was commonly perceived as a healthy and environmentally friendly option. Based on telephone interviews conducted in the United Kingdom, Tregear et al.Reference Tregear, Dent and McGregor8 reported that 45% of respondents claimed to purchase organic produce because of concern for their own health while only 9% claimed to purchase for environmental concern. Previous studies have demonstrated that the consumer's level of income, age, gender (female), and the presence of children are the primary factors found in organic food purchaseReference Davies, Titterington and Cochrane9–Reference Govindasamy and Italia12.
The contingent valuation approach has traditionally been employed to examine how high a price premium consumers are willing to pay for organic products and how socio-economic and demographic factors affect their willingness to pay. The findings from the extant literature tend to confirm that organic food products command a price premiumReference Thompson and Kidwell11, Reference Goldman and Clancy13–Reference O'Donovan and McCarthy16. However, the reported organic price premiums that consumers are willing to pay differ substantially among various studies. Goldman and ClancyReference Goldman and Clancy13 found, in general, that a third of respondents in New York were willing to pay a 100% price premium for organic foods. Thompson and KidwellReference Thompson and Kidwell11 reported that price premiums for organic produce ranged from 40 to 175% of their conventional counterparts, while O'Donovan and McCarthyReference O'Donovan and McCarthy16 demonstrated that about 70% of Irish consumers were not willing to pay more than a 10% price premium for organic meat. Interestingly, Chang and ZepedaReference Chang and Zepeda17 observed that most participants in their study agreed that an organic price premium over conventionally produced foods is justified, but most of them did not know how much. They suggested that aside from the main problem of availability, price is a key obstacle preventing non-organic consumers from trying organic goods. In fact, a survey by Walnut Acres18 reported that 68% of consumers cited high prices as the main reason they did not buy organic foods. Chang and ZepedaReference Chang and Zepeda17 suggest that increasing consumer awareness of organic farming and certification may be the most effective way of moving organic foods into the mainstream.
Empirical analyses of the US demand for organic produce have been limited and have focused mainly on how socio-economic and demographic factors affect willingness to pay for organic foods. There is little systematic study based on actual purchases of organic foods using national data. The objective of the study was to use the 2005 NielsenReference Nielsen19 Homescan data to examine the effects of product attributes, market factors, and consumer characteristics on the price of fresh produce. The study focused on price premiums associated with the organic attribute of fresh fruits and vegetables purchased at retail outlets.
Data
The NielsenReference Nielsen19 Homescan panel consists of representative US households that provide food purchase data for at-home consumption. In 2005, the panel included more than 8500 households, which reported their purchases of foods that were sold as random weight or with the Uniform Product Code (UPC) at retail outlets. For UPC-coded (or packaged) food products, organic produce can be identified by the presence of the USDA organic seal or with organic-claim codes created by NielsenReference Nielsen19. For random-weight items, NielsenReference Nielsen19 uses a coding system, which identifies organic produce. Homescan panelists do not report the unit prices for each food item; they report the total expenditure and the quantity of each food item purchased. In addition, the Homescan data include product characteristics and promotion information, as well as detailed socio-demographic information of each household.
For the purpose of this study, household purchase records of fresh produce, in general reported weekly, were aggregated into quarterly data. Before seasonal aggregation, purchase records were sorted and identified with the circumstance under which fresh produce were purchased. Specifically, each purchase can be identified by such as presence of UPC (packaged or not), type (organic or not), store (discount store or not), and sale (on sale or not). Prices for organic and conventional produce were derived as unit values—the ratio of the reported expenditures to the reported quantities for each purchase record, net of any promotional and sale discounts. To avoid potential problems that may be caused by inadvertent reporting errors, the derived unit prices for organic and conventional produce that were greater than the sample mean plus three standard deviations were considered as outliers and hence were excluded from the sample data.
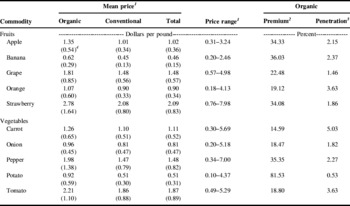
Table 1 shows the average unit prices computed from Homescan panelists purchase records for organic and conventional fresh produce in 2005. As shown in Table 1, prices paid for fresh produce vary over a wide range, and the percentages of organic premiums over their conventional counterparts also vary greatly. Based on the sample information, organic premiums vary from about $0.16 lb−1 (bananas) to $0.71 lb−1 (strawberries) for fruits and from around $0.15 lb−1 (onions) to about $0.52 lb−1 (peppers) for vegetables. However, bananas and potatoes were found to command the highest relative price premiums among the fruits and vegetables, respectively. The percentages of organic premiums relative to conventional prices are 36% for bananas and 82% for potatoes.
Summary of sample statistics for selected fresh produce, 2005.

1 All prices ($ lb−1) were computed as a unit price paid by dividing total expenditure, net of any promotional and sale discounts, by the total quantity purchased.
2 The organic premium is computed as the organic price premium divided by the conventional average price.
3 The organic penetration represents the ratio of the quantity of organic produce purchased relative to the purchase of conventional produce.
4 The numbers in parentheses are standard deviations.
It is of interest to note that, in general, when the percentages of organic price premiums are at their highest, the ratios of organic purchase relative to conventional purchases, organic penetration, are at their lowest. For example, Table 1 shows that potatoes command the highest organic price premiums (81.53%) but also have the lowest organic penetration (0.53%). Likewise, carrots have the lowest reported organic premiums (14.59%), while exhibiting the highest organic penetration (5.03%) in terms of the quantity of organic produce purchased relative to conventional produce. Similarly, the inverse relationship between organic penetration and organic premiums is also evident and observed in the panelists' purchasing behavior of oranges, which has the lowest organic price premium and the highest organic penetration among fresh fruits. Apple, banana, strawberry and pepper also show relative high price premiums being associated with relative low organic penetration. Tomatoes provide another example from the sample data showing high organic penetration that is related to low price premium. However, some exceptions are noted in Table 1 as in the cases of grape and onion, which show a relatively low price premium and low percentages of organic purchase relative to conventional produce.
Hedonic Model
Recognizing some of the shortcomings and limitations of the neoclassical demand model, LancasterReference Lancaster20 developed an alternative theory of consumer demand suggesting that it is the properties or characteristics of goods from which utility is derived. According to LancasterReference Lancaster20, consumption is an activity in which goods and services, singly or in combination, are inputs and in which the output is a collection of characteristics. Lancaster'sReference Lancaster20 theory of the demand for characteristics plays a crucial role and lays the necessary conceptual framework in the development of modern hedonic demand literature.
Expanding on the idea that consumers purchase goods because of the utilities derived from the characteristics or attributes that the goods possess, economists have applied Lancaster'sReference Lancaster20 theory to agricultural products and developed hedonic approaches for exploring price–quality relationships to estimate the implicit values of product characteristicsReference Rosen21–Reference Ladd and Suvannunt23. Hedonic modeling efforts rely on the fact that consumers and producers recognize these product attributes in approximately the same ways, and that the choices each group makes lead to an equilibrium condition that neither the consumers nor the suppliers have any incentive to change.
The underlying assumption of a hedonic model is that products can be distinguished simply and uniquely by their characteristics. Thus, demand for various desired characteristics can be derived from consumer willingness to pay for a product. As a result, marginal or implicit values can be estimated for each attribute at the observed purchase price, which is linked to the number of characteristics contained in the goods purchased. For empirical analysis, the hedonic model for the study can be expressed as

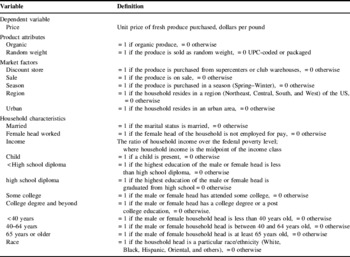
where P it is the price of the produce paid by the ith household in time t; ORGit represents the organic attribute of the produce; MKTit represents a set of market factors and characteristics such as packaging, type of store, on-sale occasion, and season of purchase; SOCit is a set of socio-demographic factors that characterize the household, and e it is the error term. The list of variables representing product attributes, market factors, and household characteristics is presented in Table 2.
Variables included in the hedonic model.

The hedonic price model represents essentially a reduced-form equation reflecting both supply and demand influences. There is little theoretical guidance with respect to the appropriate functional form that can be applied a priori in the regression analysis. Previous studies have used various functional forms, including the linear functionReference Boland and Schroeder14, Reference Palmquist24–Reference Taylor and Brester26, the semi-log functionReference Palmquist24, Reference Estes and Smith27, Reference Steiner28, and the more flexible functional form of a Box–Cox transformation modelReference Halvorsen and Pollakowski29, Reference Loureiro and McCluskey30. Consequently, the choice of the functional form for the hedonic price equation remains an empirical issue. In the study, we chose the linear form for ease in result interpretation.
Given the nature of Homescan data that may contain multiple observations from the same household, the error terms are likely to be cluster-correlated and not independently distributed. Thus, the covariance estimates obtained from applying the standard ordinary least square estimation are likely to be biased, which would yield inappropriate standard errors and misleading tests of statistical significanceReference Brogan31. The error terms in the hedonic price equation were assumed to be cluster-correlated, and we used the Stata32 program, which performs the regression procedure via the weighted least squares for survey data, to estimate the hedonic equations.
Empirical Results
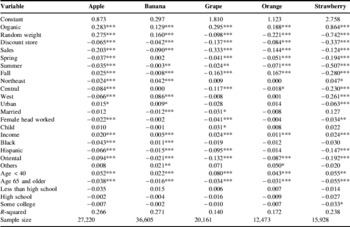
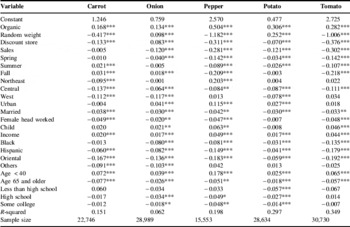
In this study, we estimated the linear hedonic models for ten selected fresh produce. The five fruits (apple, banana, grape, orange and strawberry) and five vegetables (carrot, onion, pepper, potato and tomato) were selected for the analysis because they are the most popular and valuable produce purchased by NielsenReference Nielsen19 Homescan panelists in terms of purchase frequency and sale values. The regression results for fresh fruits and vegetables are presented in Tables 3 and 4, respectively. The sample sizes vary by produce, depending on the purchase frequency. The goodness-of-fit measure, R 2, varies from 0.140 (grape) to 0.271 (banana) for fruits and from 0.062 (onion) to 0.349 (tomato) for vegetables. The relatively low R 2s reported in Tables 3 and 4 do not indicate poor model fit, and they are to be expected because cross-sectional data are used. Overall, the regression results appear reasonable and satisfactory because most of the estimated coefficients are statistically significantly different from zero with expected signs.
Estimated regression model results for fresh fruits, 2005.

Note: ***, **, and * indicate the estimated coefficients are significantly different from zero at least at the 1, 5, and 10% significance level, respectively. The significance level of the constant term is not indicated.
Estimated regression model results for fresh vegetables, 2005.

Note: ***, **, and * indicate the estimated coefficients are significantly different from zero at least at the 1, 5, and 10% significance level, respectively. The significance level of the constant term is not indicated.
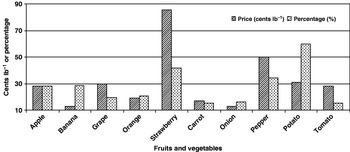
As shown in Tables 3 and 4, estimated price premiums for all ten fruits and vegetables were found to be statistically significantly different from zero at the 1% probability level. Organic price premiums for fruits were found to vary greatly, ranging from a low of 13 cents per pound for bananas, to a medium of 30 cents per pound for grapes and to a high of 86 cents per pound for strawberries. Among the five vegetables with the largest sale values in 2005, the organic price premiums were estimated to range from a low of 13 cents per pound for onions, to a medium of 28 and 31 cents per pound for tomatoes and potatoes, and to a high of 50 cents per pound for peppers. Except for peppers and strawberries, we found the organic price premiums to converge in the 13–21 cents-per-pound range among the fresh produce studied. In general, fresh produce with greater variation in seasonal availability (e.g., strawberries) was found to command a higher organic premium than produce that is available year round (e.g., bananas and onions).
Previous studies using a contingent valuation approach typically expressed organic price premiums as a percentage over the prices of conventional produce instead of absolute dollars and cents, because it is easier for respondents to report their willingness to pay for organic produce in relative terms. Moreover, in many cases the actual prices paid for organic foods were not available. In this study, we estimated the organic price premiums in dollars and cents and we also computed the estimated premiums relative to the prices of conventional produce so that we can compare our estimates to those reported in the literature. In terms of percentages, the ratio of the estimated organic premiums to average prices of conventional produce varies from less than 20% for grapes to over 42% for strawberries.
For vegetables, the percentages of organic premiums to conventional prices vary from about 15% for tomatoes and carrots to as high as 60% for potatoes. The high price premiums associated with organic potatoes is consistent with previous findings. According to a case study conducted by Wyman and DiercksReference Wyman and Diercks33, growers needed price premiums that ranged from 24 to 228% over conventional potatoes just to break even depending on the variety of potatoes. They suggest this is due to the higher costs and lower yields of organic potato production relative to other organic produce. For ease of comparison, the estimated price premiums for organic produce both in terms of dollars and cents and in percentages are shown in Figure 1.
Organic price premiums: fresh produce, 2005. Source: Nielsen Homescan panel data, 2005.

As expected, the results show that fresh produce prices are significantly affected by various product attributes, market conditions, and consumer characteristics. The estimated coefficients for random-weight produce (price premiums or discounts of random-weight produce versus packaged produce) were found to be highly significant among all fruits and vegetables. However, the signs on the estimated coefficients are mixed, as they can be either positive or negative. A positive coefficient signals that the random-weight produce (e.g., apples) was sold at a higher price than its packaged counterpart. Packaged apples are sold at a lower price than random-weight apples because of quantity discount. For the same reason packaged bananas, onions, and potatoes were sold at a discount price compared to their random-weight counterparts. On the other hand, the random-weight tomatoes were priced lower than packaged tomatoes, this is because packaged tomatoes are usually of more consistent quality or less ordinary varieties (such as grape or on-vine tomatoes) than random-weight tomatoes. Random-weight grapes, oranges, strawberries, carrots, and peppers were found to be priced lower than their packaged counterparts as well. The price discount for random-weight produce is particularly noticeable for strawberries (74 cents per pound), peppers ($1.18) and tomatoes ($1.01).
As expected, fresh produce sold at discount stores were priced significantly lower, except for onions (Table 4). Significant price discounts at discount stores ranged from 7 cents per pound for apples and potatoes to a high of 34 cents for strawberries and 38 cents for tomatoes. It is surprising to see that onions sold at discount stores were priced significantly higher than onions sold elsewhere.
Not surprisingly, fresh produce were priced significantly lower when they were on sale than not on sale, except for carrots. Price discount on carrots when they were on sale was found to be statistically insignificant. When on sale, apples were sold for 20 cents less per pound than regular-priced apples (Table 3). Grapes and tomatoes were discounted the most when they were on sale, averaging 33 cents per pound for grapes and 30 cents for tomatoes.
Considerable seasonal price variations among fresh produce were evident from the estimated results. In general, produce prices were found to be significantly higher in the winter when the production and supply of fresh produce are limited, compared to other quarters. This is true for grapes, strawberries, peppers, potatoes, and tomatoes. For apples and oranges, their prices appear to peak in the fall season when the harvest of new crops enters the fresh produce market. The results also indicate that there are some significant regional variations on produce prices. Specifically, we found households that reside in the south paid a significantly higher price for apples and carrots than those residing in other regions of the United States. On the other hand, households in the northeastern and western regions paid a significantly higher price for bananas, about 4 and 9 cents per pound, respectively, than the southerners. Households in the urban areas, in general, paid significantly higher prices for fresh vegetables such as onions, peppers and potatoes than those living in the rural areas.
With respect to household characteristics, we found that married households and households with an employed female head paid a lower price for fresh produce than their counterparts. In particular, married households paid a significantly lower price for fresh vegetables at 3–4 cents per pound less than not-married households. Significantly higher prices were paid for grapes, onions, peppers and tomatoes when there was a child present in the household.
Further as expected, households with higher income also paid a higher price for produce than less-well-off households. Higher-income households are more likely to purchase higher priced or higher quality food products or shop at retail outlets that offer more customer service and/or are located in high rent areas. Our finding is consistent with those of Thompson and KidwellReference Thompson and Kidwell11 who found that higher household income increases the probability that a household will choose to shop at specialty grocery stores, which tend to maintain higher prices on average, not only for fresh produce but also for other products. The results also show that prices paid for fresh produce varied significantly among households of different race and ethnicity. This finding suggests that Hispanic and oriental households consistently paid a significantly lower price for fresh produce, except for oranges, than white households. Black households were also found to pay significantly lower prices, less than white households, for some fruits (apples and bananas) and most vegetables (except for carrots).
The age of the household head (represented in three categories) is mostly highly significant, and the coefficient can be either positive or negative. The estimated coefficients are positive when the age of the household head is below 40 years old and negative when the household head is older than 65 years of age. This implies that younger consumers bought fresh produce at a higher price than their older counterparts. Govindasamy and ItaliaReference Govindasamy and Italia12 reported that younger respondents were more willing to pay a premium for organic produce than were older respondents. With the exception of peppers purchased by consumers under the age of 40, the estimated coefficients vary from 2 to 8 cents per pound in prices paid.
In this study, we found almost no significant associations between educational attainment and prices paid for fresh fruits (Table 3). However, some evidence suggests that household heads with college or postgraduate degrees were paying a higher price on onions, peppers and potatoes than their counterparts. Previous studies have reported mixed findings concerning the relationship between educational attainment and organic purchase behavior. Our study appears in agreement with the findings of Roddy et al.Reference Roddy, Cowan and Hutchinson10 suggesting that ‘organic purists’ are more likely to be highly educated and in a high-income category. Govindasamy and ItaliaReference Govindasamy and Italia12, on the other hand, reported that consumers' willingness to pay a premium for organic produce decreases as the level of education increases.
Summary and Conclusions
Organic demand and markets have received considerable research interest. Many studies have examined how high a price premium consumers are willing to pay for organic products and how socio-economic and -demographic factors affect their willingness to pay, using a contingent valuation approach. These studies have measured attitudes toward the purchase of organic produce rather than actual purchases. To our knowledge, empirical analyses of demand for organic produce have been limited and there is no systematic study, using national data, of variations in price premiums across produce type, season, market area, and consumer characteristics.
This study estimated a hedonic price model based on data from the 2005 NielsenReference Nielsen19 Homescan panel, a nationally representative panel, to assess consumer valuation of various attributes of fresh produce, including organic production. The hedonic methodology proved useful as a tool for analyzing price variation in fresh produce and as a mechanism for examining consumer preferences for particular product attributes. Overall, the signs and magnitudes of the organic price premiums obtained in this study appear to be reasonable and plausible.
The results show significant organic price premiums for all fresh produce examined in this study, varying from 15% above the average conventional price for carrots and tomatoes to just above 60% for potatoes. In terms of absolute price level, we estimated that the organic price premiums vary from 13 cents per pound for bananas and onions to 86 cents per pound for strawberries. Our results reflect a range of price premiums for organic produce that is noticeably lower than previous studies, such as that of Thompson and KidwellReference Thompson and Kidwell11. This could be attributed to the reported steady growth of the US organic industry since 1997 and the increase retail sales of organic foods2. Furthermore, the estimated high premium for potatoes appears reasonable and consistent with previous study, as Wyman and DiercksReference Wyman and Diercks33 showed that a high markup is needed for organic potato production to become profitable.
These results provide interesting insights to the general public as well as the organic industry concerning the prices that consumers are paying in the marketplace for organically produced fresh produce. As suggested by previous studiesReference Thompson and Kidwell11, Reference O'Donovan and McCarthy16, Reference Chang and Zepeda17, willingness to pay for organic foods varies greatly among consumer groups. Aside from availability, higher prices for organic produce could be a key deterrent that discourages nonorganic consumers from purchasing organic foods. By increasing the consumer awareness of organic foods and the positive attributes associated with organic foods, price could become a lesser consideration with nonorganic consumers. The organic price premiums reported in this study appear quite large for some produce and additional research of these high price premiums is recommended.
Particular attention and further study may be needed for the organic pepper industry. Because of their hardiness and ease of propagation, peppers are crops that lend themselves to small-scale and part-time farming operations and are grown in 48 statesReference Lucier and Jerardo34, Reference Burden35. In a highly diverse production market such as the pepper market, substantial growth potential may exist in niche markets, particularly the organic market. In view of increasing interest of and demand for locally grown foods in recent years and the fact that organic peppers command a higher organic price premium, both in terms of absolute and relative price premiums, than other fresh vegetables considered in this study, we would expect further expansion of the local organic pepper industry.
The Homescan data are available for several years before and after the implementation of the USDA Organic Standards; consequently, the data are suitable for monitoring the organic food market in future studies. Furthermore, our analysis is limited to the at-home market. An important food-related lifestyle change of the past two decades is the increase in consumption of food prepared away from home. In 1970, food away from home accounted for 26% of total US food spending36. The share rose to 42% in 2006. The rising popularity in eating out could potentially present an additional growth of demand to the organic produce industry. However, there is little to no information available about consumer demand for organic foods when they eat out. Further research to study the demand for organic produce in the food away from home markets is needed to provide a more complete picture of the overall demand for organic produce.
Acknowledgements
Research for this study was supported by USDA-ERS Cooperative Agreement No. 43-3AEM-5-80043. The views expressed in this study are those of the authors, and do not necessarily reflect those of the USDA.