I. INTRODUCTION
Since its discovery in the eighteenth century, piezoelectricity has become of great interest in the development of materials and devices. The piezoelectric polyvinylidene fluoride (PVDF) was first reported in 1969.Reference Kawaii1 Under a process of stretch and poling, this material as a film was found to have significant piezoelectricity. Studies followed showed that the material has high piezoelectricity much larger than any other polymers.Reference Nix and Ward2 There are discussions about mechanisms of piezoelectricity, some are physical dimension based and others polarization.Reference Broadurst, Mlmerg, Mopsik, Harris and Perlman3–Reference Furukawa, Wen, Suzuki, Takashina and Date8 Both explanations accept that the polymer chains align together under an electrical field or a mechanical force.Reference Fukada9 Understanding the mechanisms of PVDF has remained of great interest.
There are many industrial applications using PVDF because of its outstanding energy conversion property. Examples are ultrasonic transducers,Reference Ohigashi and Shigenari10, Reference Sussner, Michas, Assflay, Hunklinger and Dransfeld11 hydrophones,Reference Powers, Wang, Herbert and Glass12, Reference Tamura, Yamaguchi, Oyaba and Yoshimi13 electroacoustic transducers,Reference Yamaka, Wang, Herert and Glass14 and many others such as actuators, fuel cells, piezomotors, power generators, and sensors.Reference Fang, Liu, Xu, Dong, Wang, Chen, Cai and Liu15–Reference Yoo, Frank, Mori and Yamaguchi27 We have been involved in the development of hybrid insects where power generation remains a challenging issue.Reference Lee, Mika, Cooper and Liang28, Reference Mika, Lee, González, Vinson, Liang and Varadan29 In this work, we will focus on this material and its physical and chemical properties, their application in energy harvesting, followed by our recent work in phase transformation and its effects on energy conversion.
A. Materials
The PVDF material is known for its unique piezoelectric properties for energy harvesting. This material is light, flexible, and biocompatible. This makes it an ideal candidate for fabricating microdevices, such as a microelectromechanical system (MEMS).Reference Jee, Lee, Mika and Liang30–Reference Lee, Cooper, Mika, Clayton, Garg, González, Vinson, Khatri and Liang33 The piezoelectric material has five different microstructures, α, β, γ, δ, and ε. The generation of potential is believed to be caused by the alignment of its dipole structure.Reference Wang, Lee, Cooper and Liang34 Phase transformation has been reported to be related to piezoelectricity.
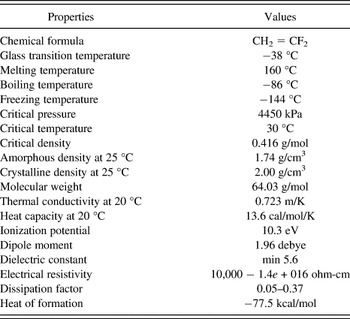
PVDF polymer has a repeated monomer unit, CH2 = CF2, which is a gas at room temperature and pressure, and relatively stable.Reference Wang, Herbert and Glass35 Their physical, mechanical, thermal, and electrical properties have been widely reported. Table I lists basic properties of the vinylidene fluoride (VDF) monomer. The solubility of VDF is less than 0.02 g/100 g in water at room temperature. The toxicity of VDF monomer is low at ambient environment. Commercial synthetic processes involve gaseous pyrolysis reactions. The preparation reactions of VDF are known by the following chemical equation:

Properties of the vinylidene fluoride.

PVDF polymer is prepared by the polymerization reaction that is produced by addition of monomer to the monomer unit catalyst:

where n > 1000.
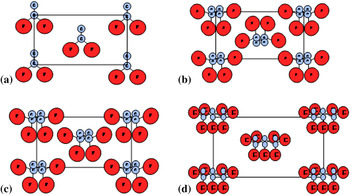
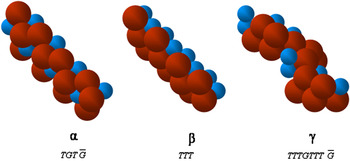
There are at least five polymorphic forms of PVDF depending on the history of fabrication or polymerization. The three major chain conformations are shown in Fig. 1 without hydrogens. Figure 1(a) is the crystal structure of β phase, referred to as all-trans, although successive −CF2 groups must be deflected by about 7° in opposite directions from the planar zigzag conformation to accommodate the fluorine atoms.Reference Hasegawa, Takahashi, Chatani and Tadakoro36 It has piezoelectric properties better than most other piezomaterials, and is charged and aligned (Fig. 2). Figure 1(b) shows  structure of α phase, although the bond rotations are deduced from the crystal structure at T = 179° and G = 45° rather than the ideal 180° and 60°, respectively.Reference Bachman and Lando37 As shown in Fig. 1(b), α phase is homogenous. This stabilizes the material with both positive and negative charges. The third is referred to as delta phase or polar α phase made by the continuous electric field at the α phase form [Fig. 1(c)]. The last is γ phase with
 structure and has actual internal trans and gauche rotation angles of about 170° and 52°, respectively [Fig. 1(d)].Reference Weinhold, Litt and Lando38 The polymer chains are transferred from α to β phase when the films are stretched or rolled by deformation at below 100 °C, or under a continuous high electrical field. The β phase has a net dipole moment and best piezoelectric coefficient after appropriate poling process. The β phase PVDF films are widely commercially available.
Four types of polymeric phase in PVDF crystal (Figure courtesy, Taekwon Jee.)

Three different chain packing with different polymeric phase in PVDF crystal. (Figure courtesy Taekwon Jee).

B. Energy harvesting
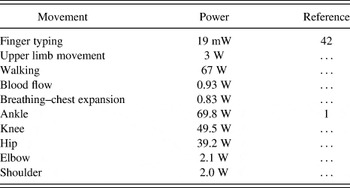
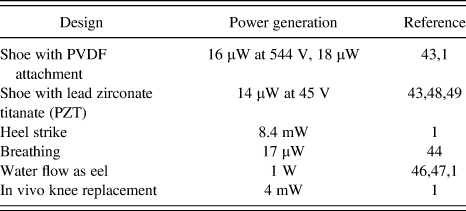
When energy harvesting is powered by a biological system, the available energy source is usually related to their activities. For human activities, continuous and discontinuous motions have been reported.Reference Gonzalez, Rubio and Moll39 The former includes blood flow and breathing while the latter includes walking and the movement of upper limbs. Table II summarizes such activities.
The power consumed during human activities.

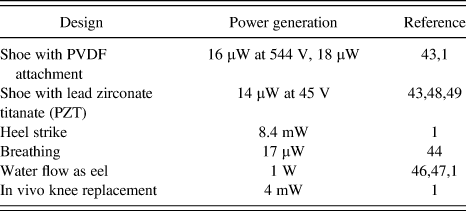
Piezoelectric materials have been applied to biological systems for sensing and energy generation. In this discussion, we focus on the energy harvesting. There are various reports found in bio-related energy harvesting. Hausler et al.Reference Hausler and Stein40 reported that when applied to a mongrel dog, the breathing movement drives the piezo to generate power. The peak voltage reached 18 V with a power of 17 μW. Ramsey and ClarkReference Ramsey and Clark41 applied the piezo to humans through blood pressure change to power MEMS. Converting energy from water flow into electrical energy has been reported as energy harvesting eels. In such applications, long strip piezopolymers are attached to a device waving through water flow to generate energy.Reference Curtin, Bellingham, Catopovic and Wedd42, Reference Taylor, Burns, Kammann, Powers and Welsh43 In a water flow speed of 1 m/s, the piezopolymer can generate 1 W of electrical energy. Some of these applications and the energy generated through piezo are summarized in Table III.
Examples of power generated through human activities.
Wearable devices have been made possible due to the development of piezoceramics. Such materials are generally composed of piezoelectric fibers embedded in a polymeric matrix.Reference Williams, Park, Inman and Wilkie44, Reference Cass, Khan and Mohammadi45 Such materials have high efficiency in comparison with pure piezomaterials due to their high length-to-area ratio.Reference Mohammadi, Khan, Cass, Shur, Wilson and Urban46
Previous work has focused on the peak energy generation through mechanical motion. Most reports indicated that the energy was built up along with the mechanical energy input, none on kinetics or on its release. In this research, we focus on the mechanisms of energy harvesting of PVDF. Understanding is needed to design miniature hybrid devices and MEMS.
II. EXPERIMENTS
Rectangular piezoelectric polymers were cut from large sheets (Measurement Specialties, Inc., Hampton, VA) into different sizes. A polling process was applied to the PVDF film to align the polymer chains in a certain direction to achieve the highest degree of piezoelectric effect possible.Reference Mani, Perez, Lee, Ounaies, Hung and Liang47 The standard length of samples was 10 mm along the alignment direction. The width was 5, 7, and 9 mm transverse to the alignment, and the thickness was 28, 52, and 110 μm. Both sides were metalized by coating a gold layer using a hummer sputtering system (Anatech Corp. Union City, CA) for 10 min at 3 mA. The conductive wires were attached to both sides of the sample as electrodes. When a sample was bent or applied an external voltage, the polymer chains reorganized and aligned and were seen as a phase change. Those aligned dipole resulted in an electronic flux on the metalized surfaces. It was noticed that the polymer chain alignment was favorable with tensionReference Kochervinskii48, Reference Sirohi and Chopra49 and otherwise in compression.Reference Wang, Fan, Su, X and Wen50
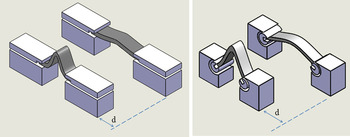
To evaluate the power output, the PVDF strips were mounted onto a mechanical linear stage with plastic grippers designed to reduce the normal pressure applied on the sample. One type was configured as buckling motion with two ends fixed and the other as bending with two ends free rotating, as shown in Fig. 3. The linear stage was composed of two parts, the stationary and the actuating stage. The actuating stage was programmed to move along a straight line in response to the stationary stage. The film was oriented lengthwise to the displacement so that the bending or buckling direction of the stage was aligned with the polling direction of the same. The stage was programmed to move at five different speeds as 0.1, 0.5, 1.0, 1.5, and 2.0 cm/s. The amplitude of the motion was controlled at 6 and 10 mm to provide a different level of mechanical deformation. A load sensor was used to measure the force required to bend the polymer. Cyclic bending or buckling of the samples permitted repeatability of the results. The load sensor was a single-axis load sensor oriented along the direction of motion.
Plastic gripers used for buckling (a) and bending (b).

To detect the outcome of a sample under bending motion, an atomic force microscope [AFM; Nano-R, Pacific Nanotechnology Inc. (PNI), Santa Clara, CA] was used for nanometer length scale characterization. The contact mode was adapted with a conductive probe to measure the output current of the polymer while under a bending motion.
To identify the phase transformation under a bending force, the Fourier transform infrared spectroscopy (FTIR) was used for this task. Analysis was conducted at room temperature and FTIR (Nicolet AVATAR 360, Nicolet, Morristown, PA) was used in absorbance mode. The chosen spectrum range for characterization was from 400 to 4000 cm−1 with a resolution of 0.482 cm−1. For accuracy, each spectrum was an average of 32 repeated measurements.
III. RESULTS AND DISCUSSION
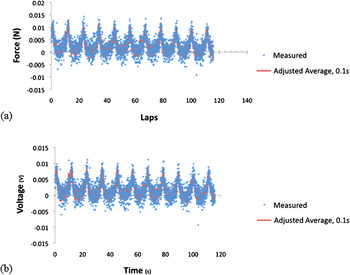
During experiments, the specimens were continuously bent and relaxed in an oscillating motion of the linear stage. The force applied to bend the samples was measured using a load sensor while simultaneously recording the stage position. Results are shown in Fig. 4. Because of the nature of the sensor setup, the bending force is in the moving direction. The maximum force measured was increased with the thickness of the PVDF. The highest force was around 0.04 N (110 μm PVDF, not shown). Figure 4(a) shows the force as a function of time (28 um) with the high force value at around 0.01 N. The force was in a periodic pattern in correlation with motion of the PVDF. Its corresponding output voltage is shown in Fig. 4(b). Here the peak voltage reached 0.01 V, and the amplitude changed with that of force.
Output measurement of PVDF during mechanical bending 28um PVDF of width 5 mm at a speed of 0.5cm/sec.

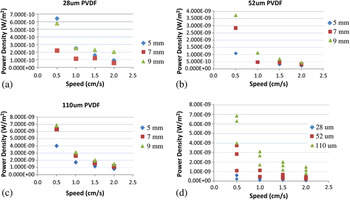
The power density was calculated through the product of output voltage and current divided by the surface area of the specimen. The power density against bending speed is shown in Fig. 5. This figure shows the power density (W/m2) against bending speed for a sample of 28 μm. There are four sets of data shown here. The diamond symbols represent the sample with a width of 5 mm. As noted, the length of all samples was fixed at 10 mm. The square was that of 7 mm and the triangle 9 mm. This figure shows that the 5-mm sample had the lowest power generated among all three samples and the power output was the highest at low speed. Figure 5(b) is the same sample of 52 μm thickness. Similar to the Fig. 5(a), the diamond is that of 5 mm width, square of 7 mm, and triangle of 9 mm. The power was about the same at high speed, whereas at low speed the highest power was generated by the thickest 9-mm sample. Figure 5(c) is that of 110-μm sample. A similar trend was found in this set. At a low speed, the wide samples (7 and 9 mm) produced higher power than that of 5 mm. At high speed, the power generated was about the same. To have an overall comparison of both thickness and speed, the power density of all samples is plotted in Fig. 5(d). As seen, both speed and sample thickness affected the power output. Ideally, a thick sample bent at a low speed would generate more power. As discussed with Fig. 4, the voltage was generated by the motion and the force applied on the PVDF. During power generation, there seemed to be no kinetic effects. At the low speed, the accumulated power was higher.
Power density of PVDF samples as a function of speed.

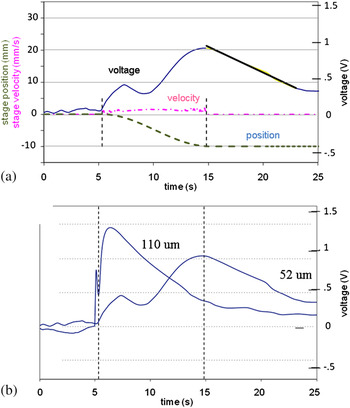
To confirm this, we conducted experiments based on time and acceleration. As shown in Fig. 6(a), the output voltage was recorded based on the position and speed of the linear stage. When a linear stage approached a constant velocity, the output voltage increased and then decreased slightly. The voltage recovered and increased giving a maximum shortly after reaching a complete stop. Without any load, the average output ranged between 0.71 through 1.13 V and between 0.75 and 1.2 V for the 6- and 10-mm deflection, respectively. Such a drop was repeatable and found in all test frequencies. The effects of film thickness are seen in Fig. 6(b). This figure shows that the thicker the film, the higher the output voltage, and the faster it drops. Figure 6 proved that the power generated was a nonlinear relationship with time and underwent two steps, and the second step produced higher power.
(a) Output measurement of a bending PVDF showing time dependence under loading and unloading. 52 um thick PVDF. (b) The thicker the film, the higher the output voltage, and the faster it drops.

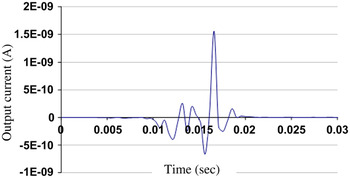
To understand this further, we used an AFM to detect the current generated through the probe tip. Figure 7 shows the output current measured. The sample was fixed under the tip of an AFM with one end free. One gentle touch at the free end resulted in an output in current. As seen in Figure 7, the current did not reach the (negative) peak immediately. Instead, the current reached a peak value three times and then maximized (or minimized as negative). The “negative” means the direction of electron flux. When the force was removed, the current reached a peak at the opposite direction and then released gradually. This type of behavior was repeatable and observed throughout all tests. As noted, the polymer was bent once only. The current release represented the decay of the power generated. The AFM results also confirmed that the power generated was a nonlinear function of motion or time. It was the accumulation of a few steps of power generation. This is interesting in comparison with the voltage generated, as shown in Fig. 5. As discussed above, the accumulation of the voltage was found in two stages. As noted, the voltage was measured as an average of the entire PVDF strip while the AFM was at one spot of the surface. According to Fig. 5, on the basis of the relationship between the stage and moving velocity, the voltage change was apparently not related to the kinetic parameters of the setup. This was also seen in the AFM results (Fig. 7). This means that the accumulation of power should be related to the intrinsic change of the material.
AFM analysis of a PVDF during bending.

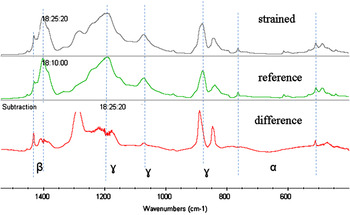
In one of our recent studies, we used an IR to analyze a strained PVDF at different times.Reference Williams and Yates17 As soon as a bending force was applied, the change was observed on three phases, α, β, and γ (Fig. 8). After 19 min, the change was found again on all three phases, while after 37 min, the change was only observed on the β phase and the other two were stabilized. This means that the transformation between each phase competes with each other and some are faster than others and each lasts for a different time. This explains why the power generation is nonlinear with time as shown in our results (Figs. 4 and 5). Although at this stage we are not able to pinpoint which phase transformation is responsible for each power peak, as shown in Figs. 6 and 7, there is enough evidence for us to believe that the phase transformation is responsible for such behavior.
IR analysis showing the phase change of three microstructures.

The evidence of phase transformation was also reported in one of our previous studies on morphological characterization of a strained PVDF using an AFM.Reference Yamaka, Wang, Herert and Glass14 We discovered that the surface of a PVDF was found “squeezed” when a force was applied. This was consistent with our IR results as well as the power density data shown previously. The previous discussion has shown that energy harvesting can be optimized through mechanical parameters, the physical dimension of the polymer, and the microstructure. A thicker polymer naturally sustains more mechanical energy to deformation. The phase transformation is an intrinsic mechanism for energy harvesting.
IV. CONCLUSIONS
In this research, we investigated kinetics of a power generation of a PVDF tailored for miniature hybrid device applications. Through mechanical deformation, we observed that the power generated followed a nonlinear relationship with time. This means that the power fluctuated a few times before reaching its peak value. This behavior was due to the phase transformations between different phases in the PVDF. This study shows that it is possible to generate a piezoelectric polymer (PVDF) that has optimized concentration of microstructures as α, β, and γ such that the power can be further increased.
ACKNOWLEDGMENTS
Assistance by Taekwon Jee, Hyungoo Lee, and Ke Wang was appreciated. The authors wish to acknowledge the support by the National Science Foundation (NSF) (0515930).