Introduction
Forage cactus (Opuntia spp.) is an important source of animal feed in arid and semiarid regions. It is recognized for its ability to withstand adverse climatic conditions, making it an essential feed source during periods of scarcity (Santos et al., Reference Santos, Araújo, Santos, de, Lambais, Lambais, Nagahama, Zanine, Santos, Soares, Sobral, Justino, Lemos and de Oliveira2022). However, an exclusive forage cactus diet can lead to digestive disorders in animals (Marques et al., Reference Marques, Gomes, Mourthé, Santos Braz and Neto2017). Building upon the findings of Marques et al. (Reference Marques, Gomes, Mourthé, Santos Braz and Neto2017), recent studies have suggested that the disorders observed may also be related to microbial contamination. The high moisture content and high levels of water-soluble carbohydrates (WSCs, 23–150 g/kg) found in forage cactus favor the growth of undesirable microorganisms, including E. coli and other enterobacteria (Paulino et al., Reference Paulino, de Oliveira, Santos, Pereira, de Farias Ramos, César Neto, de Lima Cruz, Leite, Satake, da Silva and de Oliveira2021; Oliveira et al., Reference Oliveira, Mantovani, Rodrigues, Ferreira and Santos2025). These microorganisms can cause diarrhea and other health disorders in animals (Du Toit et al., Reference Du Toit, De Wit and Hugo2018).
Nutritional disorders in animals caused by forage cactus in feed are usually associated with low dietary fibre and high non-fibre carbohydrate (NFC) content (Marques et al., Reference Marques, Gomes, Mourthé, Santos Braz and Neto2017). Therefore, an exclusive supply of ruminants is not recommended (Pinho et al., Reference Pinho, Santos, De Oliveira, De Carvalho, Alves, da Macêdo A.J., Pereira, Pereira, Perazzo and Zanine2019). However, recent studies have suggested other potential causes for these issues. Paulino et al. (Reference Paulino, de Oliveira, Santos, Pereira, de Farias Ramos, César Neto, de Lima Cruz, Leite, Satake, da Silva and de Oliveira2021) noted that such disorders may also be related to the post-harvest management of forage cactus. This includes the timing of feeding, sanitary conditions and exposure to air after processing, which are all factors that affect the quality of feed for animals. Sato et al. (Reference Sato, Takeuti, Andrade, Koerich, Tagliari, Bernardi, Cardoso and Barcellos2016) stated that pathogens develop in cladodes kept in unsanitary conditions after harvest and when the plants are fertilized with manure. The authors also observed the proliferation and survival of E. coli in plant cladodes over 16 days. Contamination may also occur when feed is mixed using tools, such as shovels or by hand, which can lead to external contamination (Oliveira et al., Reference Oliveira, Mantovani, Rodrigues, Ferreira and Santos2025).
In general, studies have focused on evaluating the use of forage cactus in combination with hay (Santos et al., Reference Santos, Araújo, Santos, de, Lambais, Lambais, Nagahama, Zanine, Santos, Soares, Sobral, Justino, Lemos and de Oliveira2022; Vieira et al., Reference Vieira, Oliveira, Santos, Santos, Pinto, Zanine, Coelho, Sobral, Leite, Soares, Santos, Santos, Viana, Júnior and Gomes2022). However, the literature still lacks investigations into the microbial dynamics of the fresh mixture of forage cactus with silage. Another relevant aspect is that, culturally, farmers do not have the habit of ensiling cactus, preferring to offer it fresh along with a fibre source. In this context, Oliveira et al. (Reference Oliveira, Mantovani, Rodrigues, Ferreira and Santos2025) highlight that the acidic pH of silages tends to inhibit undesirable microorganisms and reduce microbial diversity, which may represent a promising management strategy to improve the hygienic quality of forage cactus-based diets. Santos et al. (Reference Santos, Araújo, Santos, de, Lambais, Lambais, Nagahama, Zanine, Santos, Soares, Sobral, Justino, Lemos and de Oliveira2022) reported high pH values (6.31–6.49) and elevated E. coli counts [8.19–9.02 log10 colony-forming units (CFU)/g] after 24 h of aerobic exposure. Although buffel grass hay was hypothesized to inhibit gram-negative bacteria, the elevated pH and oxygen exposure likely created favourable conditions for E. coli proliferation.
For this reason, feeds can be combined with forage cactus to inhibit the growth of pathogenic microorganisms (Paulino et al., Reference Paulino, de Oliveira, Santos, Pereira, de Farias Ramos, César Neto, de Lima Cruz, Leite, Satake, da Silva and de Oliveira2021; Vieira et al., Reference Vieira, Oliveira, Santos, Santos, Pinto, Zanine, Coelho, Sobral, Leite, Soares, Santos, Santos, Viana, Júnior and Gomes2022). One example is forage sorghum silage [Sorghum bicolor (L.) Moench] (Pinho et al., Reference Pinho, Santos, Oliveira, Bezerra, Freitas, Perazzo and Silva2015). This preserved bulk source is commonly used because the ensiling method preserves plant nutrients, allowing for storage and use during periods of pasture scarcity. Furthermore, this plant undergoes homolactic fermentation, resulting in a stable pH level (Hu et al., Reference Hu, Pan, Zhao, Yin, Wang, Sun, Yu, Bai and Xue2024).
Therefore, we hypothesized that the pH of the ensiled mass inhibits the growth of pathogenic microorganisms in diets with high proportions of forage cactus when combined with sorghum silage, because enterobacteria are susceptible to environments with reduced pH. This can improve the hygienic quality of the feed remaining in the trough after 24 h. The objective of this study was to evaluate the growth of potentially pathogenic microorganisms in mixtures of fresh forage cactus and forage sorghum silage without or with goat faecal contamination as a function of the aerobic exposure period.
Materials and methods
Experimental site
The experiment was carried out at the Forage Laboratory of the Center of Agricultural Sciences belonging to the Federal University of Paraíba (UFPB), Campus II, located in the municipality of Areia, state of Paraíba, Brazil (6°57′46″ S, 35°41′31″ W).
Experimental design
The experimental design was a completely randomized 2 × 2 × 4 factorial arrangement. The factors included two levels of forage cactus (FC) proportion (20 and 80 %), without or with faecal contamination (C) and four aerobic exposure times (T: 0, 6, 12 and 24 h). With four replicates per factorial treatment, the trial totalled 64 experimental units. The variables for organic acids and microbial populations were evaluated at all four time points. However, the analysis of chemical composition and bacterial community was restricted to the 0 and 24 h exposure times (Supplementary file 1).
The mixtures consisted of 1 kg of material composed of either 80 % FC and 20 % sorghum silage or 20 % FC and 80 % sorghum silage, on a fresh matter (FM) basis, in addition to the absence or presence of C with goat faeces and different T (0, 6, 12 and 24 h).
Preparing for faecal contamination
To determine the ideal concentration for the growth of microorganisms (enterobacteria and E. coli), a faecal liquid was prepared and plated. Faecal samples were collected from randomly selected pens in the goat farming sector of UFPB. Ten grams of faeces were weighed and added to 90 mL of distilled water, filtered through sterile gauze and added to the treatments with contamination. The goal was to achieve a final dilution of 1.0 × 10⁴ CFU/g of feed, based on 1 g of inoculum per kg of feed (Chiaravalli et al., Reference Chiaravalli, Rapetti, Rota Graziosi, Galassi, Crovetto and Colombini2019). We emphasize that this inoculum level is within the range normally reported for enterobacteria and E. coli in faeces and ruminant feeds (103–105 CFU/g) under real field conditions (Sato et al., Reference Sato, Takeuti, Andrade, Koerich, Tagliari, Bernardi, Cardoso and Barcellos2016; Santos et al., Reference Santos, Araújo, Santos, de, Lambais, Lambais, Nagahama, Zanine, Santos, Soares, Sobral, Justino, Lemos and de Oliveira2022; Vieira et al., Reference Vieira, Oliveira, Santos, Santos, Pinto, Zanine, Coelho, Sobral, Leite, Soares, Santos, Santos, Viana, Júnior and Gomes2022). Thus, the aim was to simulate a feasible contamination, representative of the reality observed in management practices, without exceeding extreme values that could compromise the experimental interpretation.
Forage sorghum silage and fresh forage cactus
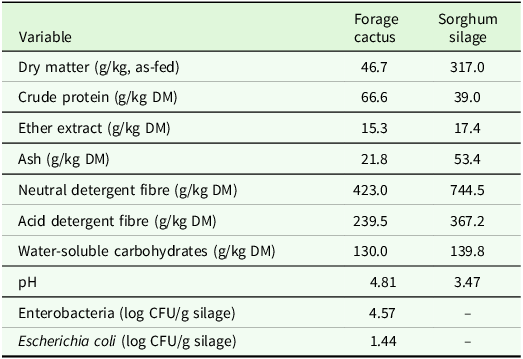
The FC and forage sorghum silage used in the experiment came from previously cultivated crops. The forage cactus used in the experiment was obtained from a previously established and fully productive area. Sampling was performed by collecting random points distributed throughout the entire experimental area in order to ensure representativeness of the material and the reliability of the data obtained. The FC used was Orelha de elefante mexicana (Opuntia stricta Haw), which was harvested two years after regrowth. The FC planting was carried out with base fertilization using manure (30 Mg/ha). The planting density was 100 000 plants per hectare, arranged in a single row with 1.20 m between rows and 30 centimetres between plants. The sorghum used for silage production was obtained from a 3-hectare area located on the same farm from which the forage cactus was sourced. The BRS Ponta Negra variety of sorghum was ensiled 100 days after planting with a six-month fermentation period. The FC was processed upon mixing in a stationary forage machine equipped with a blade system that cut the forage into 2 cm particles. Then, the FC and sorghum silage were mixed. The chemical characterization of the FC and sorghum silage was performed to determine their contents of dry matter (DM), crude protein (CP), ether extract (EE), ash, neutral detergent fibre (NDF) and acid detergent fibre (ADF). Furthermore, they were characterized for WSCs, pH, enterobacteria and E. coli, as shown in Table 1.
Characterization of the fresh forage cactus and the forage sorghum silage used in the experiment

DM = dry matter; CFU = colony-forming units; pH = hydrogen potential.
Preparation of mixtures and collections
The FC and forage sorghum silage were weighed and homogenized manually to compose the mixtures. Then, the mixtures were contaminated with the faecal liquid (10 g of goat faeces and 90 mL of distilled water), which was applied uniformly to each mixture placed in buckets (55 cm diameter × 19 cm height, 4 L) (630EE, GrouPack®, Cabedelo, Paraíba, Brazil), using a manual sprayer (Tramontina Manual Sprayer in Plastic 1 L, model 78605106, São Paulo, São Paulo, Brazil). For the control group, the same volume of distilled water (90 mL) was applied.
The mixtures were then stored in a temperature-controlled room at 30°C for 24 h of aerobic exposure, with samples collected at 0, 6, 12 and 24 h (Supplementary file 1). The purpose of this temperature was to simulate the conditions of the semiarid environment, where the average on the hottest days throughout the year is approximately 30°C. A data logger (AK285 New, AKSO®, São Leopoldo, Rio Grande do Sul, Brazil) was inserted into the centre of each bucket to record the temperature every 10 min. Three additional loggers measured the ambient temperature in the room. The following variables were determined during the exposure: pH, lactic acid, butyric acid, acetic acid and E. coli and enterobacterial counts. Samples were taken at 0 and 24 h for analysis of the chemical composition and bacterial diversity by 16S rRNA gene amplification and sequencing.
Laboratory analysis
The samples were processed and analysed for chemical composition at the Feed Analysis Laboratory of the National Semi-Arid Institute (INSA) in Campina Grande, Paraíba, Brazil. The samples were partially dried in a forced-air circulation oven at 55°C for 72 h. Then, they were ground in a knife mill (Wiley®, Arthur H. Thomas, PA, USA) using a 1 mm sieve.
The samples of FC, sorghum silage and mixtures were analysed for DM (method 934.01), ash (method 942.05), CP (N × 6.25, method 984.13) and EE (method 920.39) contents according to AOAC (1990). The NDF content of these samples was also determined using thermostable α-amylase without sodium sulphite and ADF (Van Soest et al., Reference Van Soest, Robertson and Lewis1991).
For the analyses of fermentative profile, organic acids and microbial population quantification, 25 g of sample from the mixtures were collected at 0, 6, 12 and 24 h of aerobic exposure. The samples were homogenized in 225 mL of saline solution [0.85 g NaCl (Dinâmica®, São Paulo, São Paulo, Brazil)/100 mL distilled water] using an industrial blender (LAR.2, Metvisa®, Brusque, Santa Catarina, Brazil) for 1 minute. The resulting aqueous extract was filtered through sterile cotton gauze and divided into four aliquots. The first aliquot was used for pH measurement using a digital potentiometer (K39-1420A, Kasvi®, São José dos Pinhais, Paraná, Brazil). Subsequently, a second aliquot of 50 mL of the aqueous extract was acidified (1:1 v / v H2SO4, Neon®, Suzano, São Paulo, Brazil) and stored at −20°C for the quantification of ammoniacal nitrogen (N-NH3) relative to total nitrogen, according to the method described by Bolsen et al. (Reference Bolsen, Lin, Brent, Feyerherm, Urban and Aimutis1992). WSCs content was also determined using the concentrated sulphuric acid method, following the procedure described by Dubois et al. (Reference Dubois, Gilles, Hamilton, Rebers and Smith1956).
The third aliquot of the aqueous extract was used for the quantification of organic acids: lactic acid, acetic acid, propionic acid and butyric acid. A 10 mL portion of the aqueous extract was transferred into screw-cap test tubes (AJ03, PlenaLab®, Jundiaí, São Paulo, Brazil), vortexed (Vortex Mixer VX-200, LabNet®, New Jersey, USA) followed by the addition of 2.0 mL of metaphosphoric acid (Neon®, Suzano, São Paulo, Brazil). The resulting solution was centrifuged (Mikro-120, Hettich Zentrifugen®, Tuttlingen, Germany) for 15 minutes at 13,000 × g. After centrifugation, the supernatant was collected and transferred into Eppendorf-type microcentrifuge tubes (CralPlast®, Cotia, São Paulo, Brazil), which were sealed, labelled and frozen until analysis by high-performance liquid chromatography (HPLC) using a Shimadzu SPD-10AVP system at the Animal Nutrition and Soil Laboratory of the Federal University of Piauí (UFPI) (Siegfried et al., Reference Siegfried, Rückemann and Stumpf1984).
Analyses were performed using an HPLC system (Agilent 1260 Infinity II) equipped with a diode array detector (DAD) set at 210 nm. Separation was carried out on a Bio-Rad Aminex HPX-87H column (300 × 7.8 mm), maintained at 45°C. The mobile phase consisted of 0.005 N sulphuric acid at a flow rate of 0.6 mL/min, the injection volume was 20 μL and the total runtime was 30 minutes. Samples were filtered through a 0.22 μm PTFE membrane and acidified with 50 % H2SO4. The observed retention times were approximately 10 min for lactic acid, 11.5 min for acetic acid, 13 min for propionic acid and 14.5 min for butyric acid.
Finally, the fourth aliquot of the aqueous extract was used to quantify the microbial populations: E. coli (an indicator of faecal contamination) and enterobacteria. For the quantification of E. coli, 1 mL of the aqueous extract was added to 9 mL of saline solution (0.9 %) in a sterile 15 mL Falcon test tube (AJ03, PlenaLab®, Jundiaí, São Paulo, Brazil), using the serial dilution technique (101 to 109), in duplicate. The spread plate technique was employed, in which 100 μL of the solution was placed on the surface of the culture medium in 90 × 15 mm Petri dishes (FirstLab®, São José dos Pinhais, Paraná, Brazil) and spread using a Drigalski loop. The plates were incubated in a bacteriological incubator at 35 ± 5°C for 24 h. Eosin methylene blue agar (EMB Levine, Kasvi, K25-1050, Brazil) is a differential culture medium that inhibits the growth of gram-positive bacteria and indicates whether bacteria are lactose fermenters. E. coli colonies are easily identifiable due to their characteristic metallic green colour.
The same sampling and serial dilution techniques were used for enterobacteria; however, Violet Red Bile Agar (Kasvi, K25-1093, Brazil) was used for counting. The spread plate technique was used, in which 100 μL of the solution was placed on the surface of the culture medium in 90 × 15 mm Petri dishes and spread using a Drigalski loop. The plates were incubated aerobically at 35°C for 24 h. Plates containing between 30 and 300 CFU were considered for counting, and the averages of the selected dilutions were calculated.
Analysis of bacterial diversity using 16S rRNA gene sequencing
For each sample, 25 g of the mixture was homogenized in 225 mL of standard buffered saline phosphate solution. Then, it was macerated in an industrial blender (LAR.2, METVISA®, Brusque, Santa Catarina, Brazil), filtered through sterile gauze and centrifuged at 6,000 × g at 4°C for 4 minutes. The supernatant was discarded, and the mixture was washed again in standard buffered saline phosphate solution. Then, the pellet was resuspended in 900 µL of standard buffered saline phosphate solution and stored in an ultra-freezer at −80°C.
DNA was extracted using a commercial kit (PowerSoil DNA Isolation Kit, MoBio, Carlsbad, CA), following the manufacturer’s protocol. A 0.25 g pellet was obtained by diluting 25 g of silage in 225 mL of saline solution (0.85 % NaCl). The V3 and V4 hypervariable regions of the 16S rRNA gene were amplified by PCR with the following conditions: denaturation at 95°C for 3 minutes, with 25 cycles of denaturation at 95°C for 30 s, annealing at 55°C for 30 s and extension at 72°C for 30 s. The primers used were 341F: 5’-TCG TCG GCA GCG TCA GAT GTG TAT AAG AGA CAG CCT ACG GGN GGC WGC AG-3’ and 785R: 5’-GTC TCG TGG GCT CGG AGA TGT GTA TAA GAG ACA GGA CTA CHV GGG TAT CTA ATC C-3’, using the Illumina MiSeq V2 Kit (2 × 250 cycles).
The diversity of bacterial communities was analysed using the QIIME2 v. 2023.2 platform and R v. 4.1.3 software (Bolyen et al., Reference Bolyen, Rideout, Dillon, Bokulich, Abnet, Al-Ghalith, Alexander, Alm, Arumugam, Asnicar, Bai, Bisanz and Caporaso2019). Denoising of reads and generation of amplicon sequence variants (ASVs) were performed using DADA2 (Callahan et al., Reference Callahan, McMurdie, Rosen, Han, Johnson and Holmes2016). The Genome Taxonomy Database (GTDB) v. 207.0 database was used. The following alpha diversity indices were used: Shannon, Simpson and Pielou. For beta diversity, Weighted and Unweighted Unifrac (Lozupone; Knight, Reference Lozupone and Knight2015; Thukral, Reference Thukral2017) were used.
The NetworkX software (version 2.8.0) was used to analyse multiple abundance correlations and construct co-occurrence patterns among bacterial species (Wang et al., Reference Wang, Ding, Tian, Cheng, Xu, Zhang, Wang, Nazar and Liu2024). A co-occurrence was considered robust if the P-value was less than 0.05, while the Spearman correlation coefficient (ρ) was greater than or equal to 0.5.
Statistical analysis
For the chemical composition and bacterial community, we applied an analysis of variance over time, according to the following statistical model:
 $$\begin{align}y_{ijk}=&\mu +FC_{i}+C_{j}+T_{k}+(FCC)_{ij}+(FCT)_{ik}\\&+(CT)_{jk}+(FCCT)_{ijk}+\varepsilon _{ijk}\end{align}$$
Where y ijk is the log of the variable of interest; μ is the overall mean; FC i is the fixed effect of the proportion of forage cactus (20 or 80 %); C j is the fixed effect of contamination with goat faeces (absent or present); T k is the fixed effect of the aerobic exposure period (0 or 24 hours); (FCC) ij is the fixed effect of the interaction between the effects of the levels of forage cactus and contamination with goat faeces; (FCT) ik is the fixed effect of the interaction between the effects of the levels of forage cactus and the aerobic exposure period; (CT) jk is the fixed effect of the interaction between the effects of the levels of forage cactus, contamination with goat faeces and aerobic exposure period; and (FCCT) ijk is the interaction between the fixed effects of the levels of forage cactus, contamination with goat faeces and aerobic exposure period and ϵ ijk is the random residual.
All analyses were performed using the MIXED procedure of the Statistical Analysis System (SAS, 2024) software. The covariance structure for modelling random effects was the variance components (VC), which was identified after comparison with other available structures, using the Akaike information criterion (AIC). The degrees of freedom were adjusted using the Satterthwaite method.
The microbiological data were expressed in CFU and transformed to a logarithmic scale (log 10 CFU). Thus, the data on microbial populations, pH and organic acids were analysed using a 2 × 2 × 4 factorial completely randomized experimental design, with proportions of FC and sorghum silage (20 and 80 %), without or with C and four T (0, 6, 12 and 24 h) and four replications in the design, with sixteen factorial treatments and four replications, according to the following statistical model:
 $$\begin{align}y_{ijk}=&\mu +FC_{i}+C_{j}+T_{k}+(FCC)_{ij}+(FCT)_{ik}\\& +(CT)_{jk} +(FCCT)_{ijk}+\varepsilon _{ijk}\end{align}$$
Where y ijk is the log of the variable of interest; μ is the overall mean; FC i is the fixed effect of the level of forage cactus (20 or 80); C j is the fixed effect of the goat faecal contamination (absent or present); T k is the fixed effect of the aerobic exposure period (0, 6, 12 and 24 h); (FCC) ij is the fixed effect of the interaction between the effects of levels of forage cactus and faecal contamination; (FCT) ik is the fixed effect of the interaction between the effects of levels of forage cactus and the exposure period; (CT) jk is the fixed effect of the interaction between the effects of levels of forage cactus, faecal contamination and the aerobic exposure period; (FCCT) ijk is the interaction between the fixed effects of the levels of forage cactus, faecal contamination and exposure period and ϵ ijk is the random residual.
All data were tested using analysis of variance (ANOVA). When the effect of the T was significant, the means were compared using an F-test (P ≤ 0.05). If the effect of the level of FC and C or the interaction between the T, the level of FC and the C was significant, it was broken down, and the means were compared using the Tukey test at a significance level of 5 %.
The statistical evaluation was performed using the nonparametric Dunn and Kruskal–Wallis tests and PERMANOVA to evaluate alpha and beta diversities, respectively. To test the significance of the adjusted model, the results were subjected to ANOVA at a 5 % probability level.
Results
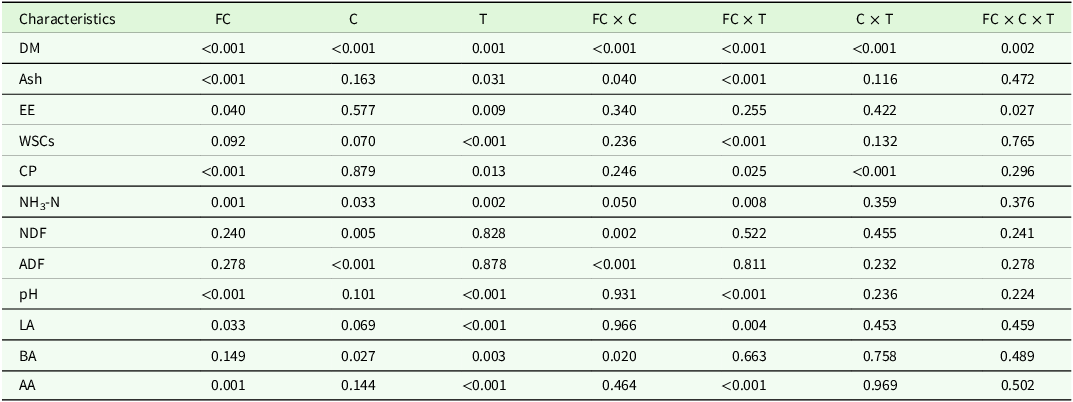
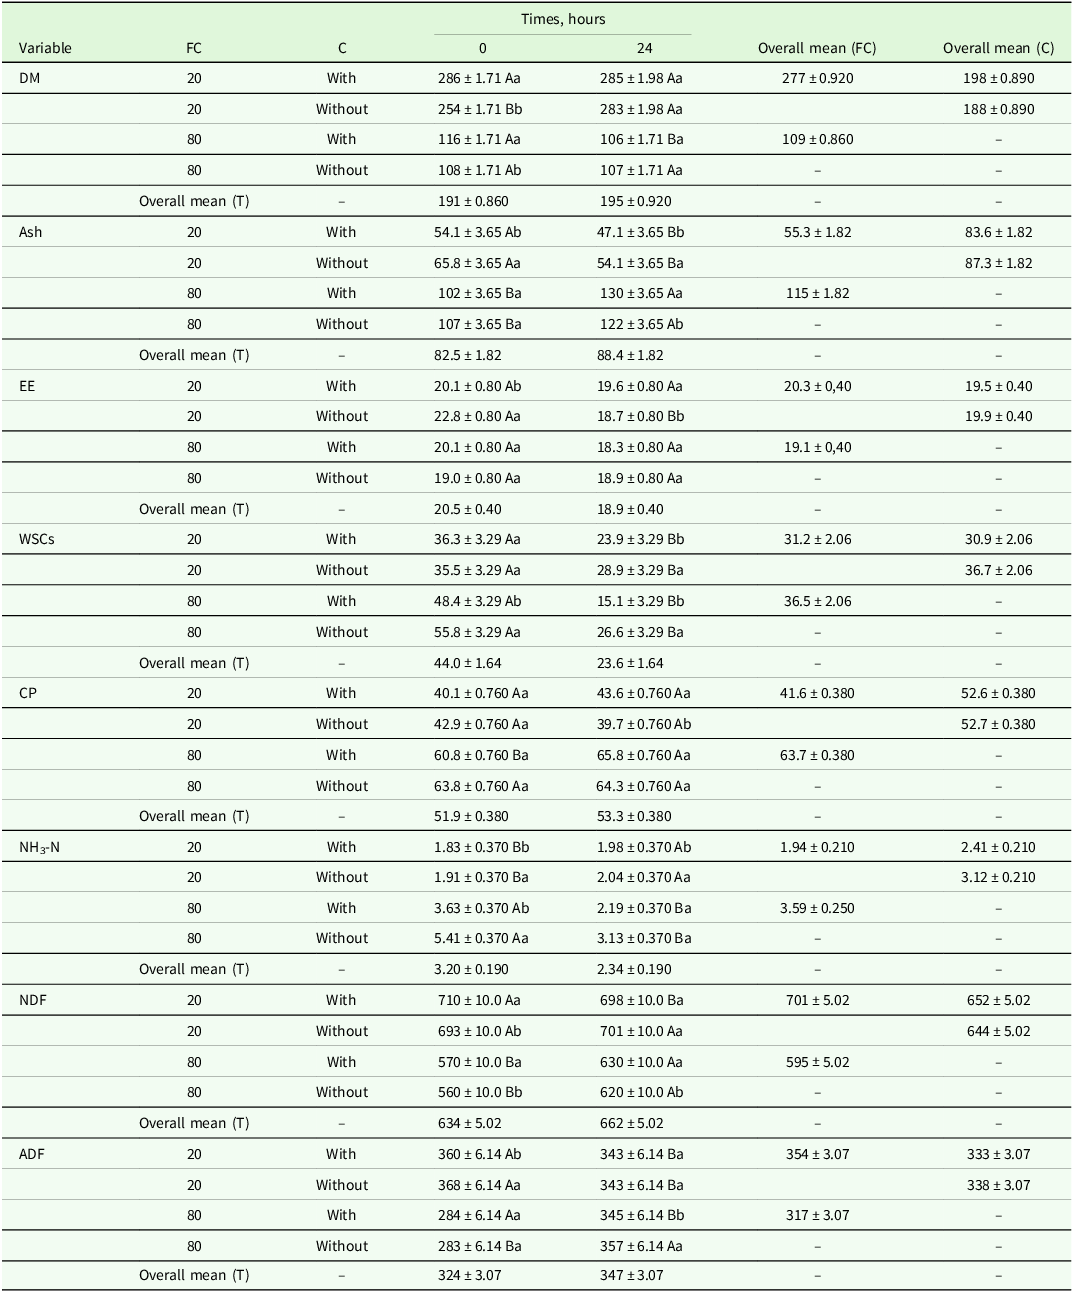
A three-way interaction was observed between levels of FC × C × T (P = 0.002) for DM. As expected, the mixtures with 20 % FC presented higher DM contents due to the higher DM content of the sorghum silage. However, in the 80 % FC mixtures, with the presence of contamination, a reduction in DM was observed over the 24 h of exposure. A three-way interaction between levels of FC × C × T (P = 0.027) was also observed for EE. Values decreased over the 24 h in both the 80 and 20 % FC mixtures (Tables 2 and 3).
P-value of the F-tests for the effects of forage cactus proportion (FC), goat faeces contamination (C), aerobic exposure time (T), interaction between forage cactus proportion and goat faeces contamination (FC × C), interaction between forage cactus proportion and aerobic exposure time (FC × T), interaction between goat faeces contamination and aerobic exposure time (C × T), and the three-way interaction between forage cactus proportion, goat faeces contamination, and aerobic exposure time (FC × C × T)

DM = dry matter; EE = ether extract; WSCs = water-soluble carbohydrates; CP = crude protein; NH3-N = ammoniacal nitrogen; NDF = neutral detergent fibre; ADF = acid detergent fibre; LA = lactic acid; BA = butyric acid; AA = acetic acid.
Mean values and standard errors of the bromatological composition variables, considering the effects of forage cactus (FC), goat faeces contamination (C), aerobic exposure times (T), and the interaction between the factors

DM = dry matter (g/kg); EE = ether extract (g/kg); WSCs = water-soluble carbohydrates (g/kg); CP = crude protein (g/kg); NH3-N = ammoniacal nitrogen (%) total nitrogen; NDF = neutral detergent fibre (g/kg); ADF = acid detergent fibre (g/kg). Means followed by different uppercase letters in the same row differ from each other as a function of aerobic exposure periods within each combination of factors, whereas means followed by different lowercase letters in the same column differ from each other among factor combinations within each aerobic exposure period; both comparisons were performed using Fisher’s F test (p ≤ 0.05).
An interaction was observed between the levels of FC × C (P = 0.040), as well as between the levels of FC × T (P < 0.001) for ash. The mixtures with 80 % FC had a higher ash content, which increased after 24 h of exposure. An interaction was observed between the levels of FC × T (P < 0.001) for WSCs. There was a reduction according to the levels of FC and T of 24 h. An interaction was observed between the levels of FC × T (P = 0.025), as well as between C × T (P < 0.001) for CP. Protein increased after 24 h of exposure, particularly in treatments with C. An interaction was observed between the levels of FC × C (P = 0.050), as well as between the levels of FC × T (P = 0.008) for NH3-N. For NDF, an interaction was observed between the levels of FC × C (P = 0.002), with a low variation in values over time in treatments with 20 % FC. Interaction effects were also observed for ADF between levels of FC × C (P < 0.001) (Tables 2 and 3).
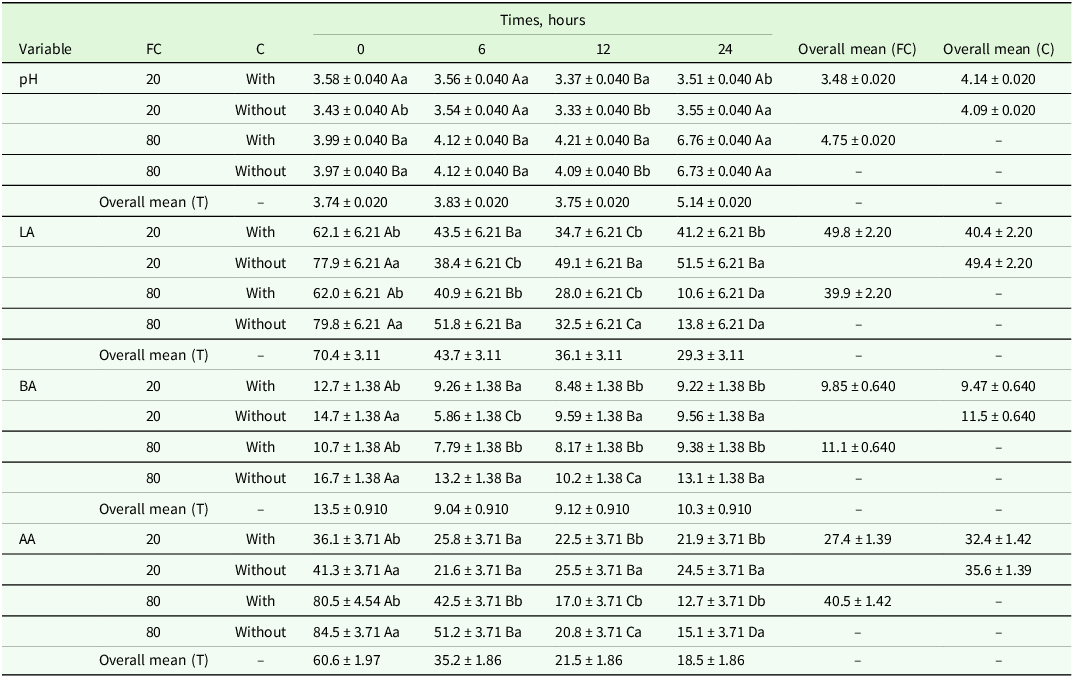
An interaction was observed between the levels of FC × T (P < 0.001) with regard to pH. The pH was higher only at the 80 % FC level, regardless of contamination. Increases in pH values were observed in 24 h for 80 % FC. For lactic acid, an interaction was observed between the levels of FC × T (P = 0.004). A lower lactic acid content was observed in treatments with 80 % FC. An interaction was observed between the levels of FC × C (P = 0.020) for butyric acid. An increase in butyric acid content was observed after 24 h of aerobic exposure. Another important point is that these butyric acid concentrations were also higher in 80 % FC than in 20 % FC. An interaction was observed between the levels of FC × T (P < 0.001) for acetic acid. Higher acetic acid values were observed in the 20 % FC treatments. Acetic acid decreased with increasing exposure periods (Tables 2 and 4).
Mean values and standard errors of the pH and organic acids (g/kg) variables, considering the effects of forage cactus (FC), goat faeces contamination (C), aerobic exposure times (T), and the interaction between the factors

pH = hydrogen potential; LA = lactic acid; BA = butyric acid; AA = acetic acid. Means followed by different uppercase letters in the same row differ from each other as a function of aerobic exposure periods within each combination of factors, according to Tukey’s test (p < 0.05). Meanwhile, means followed by different lowercase letters in the same column differ from each other among factor combinations within each aerobic exposure period, according to Fisher’s F test (p ≤ 0.05).
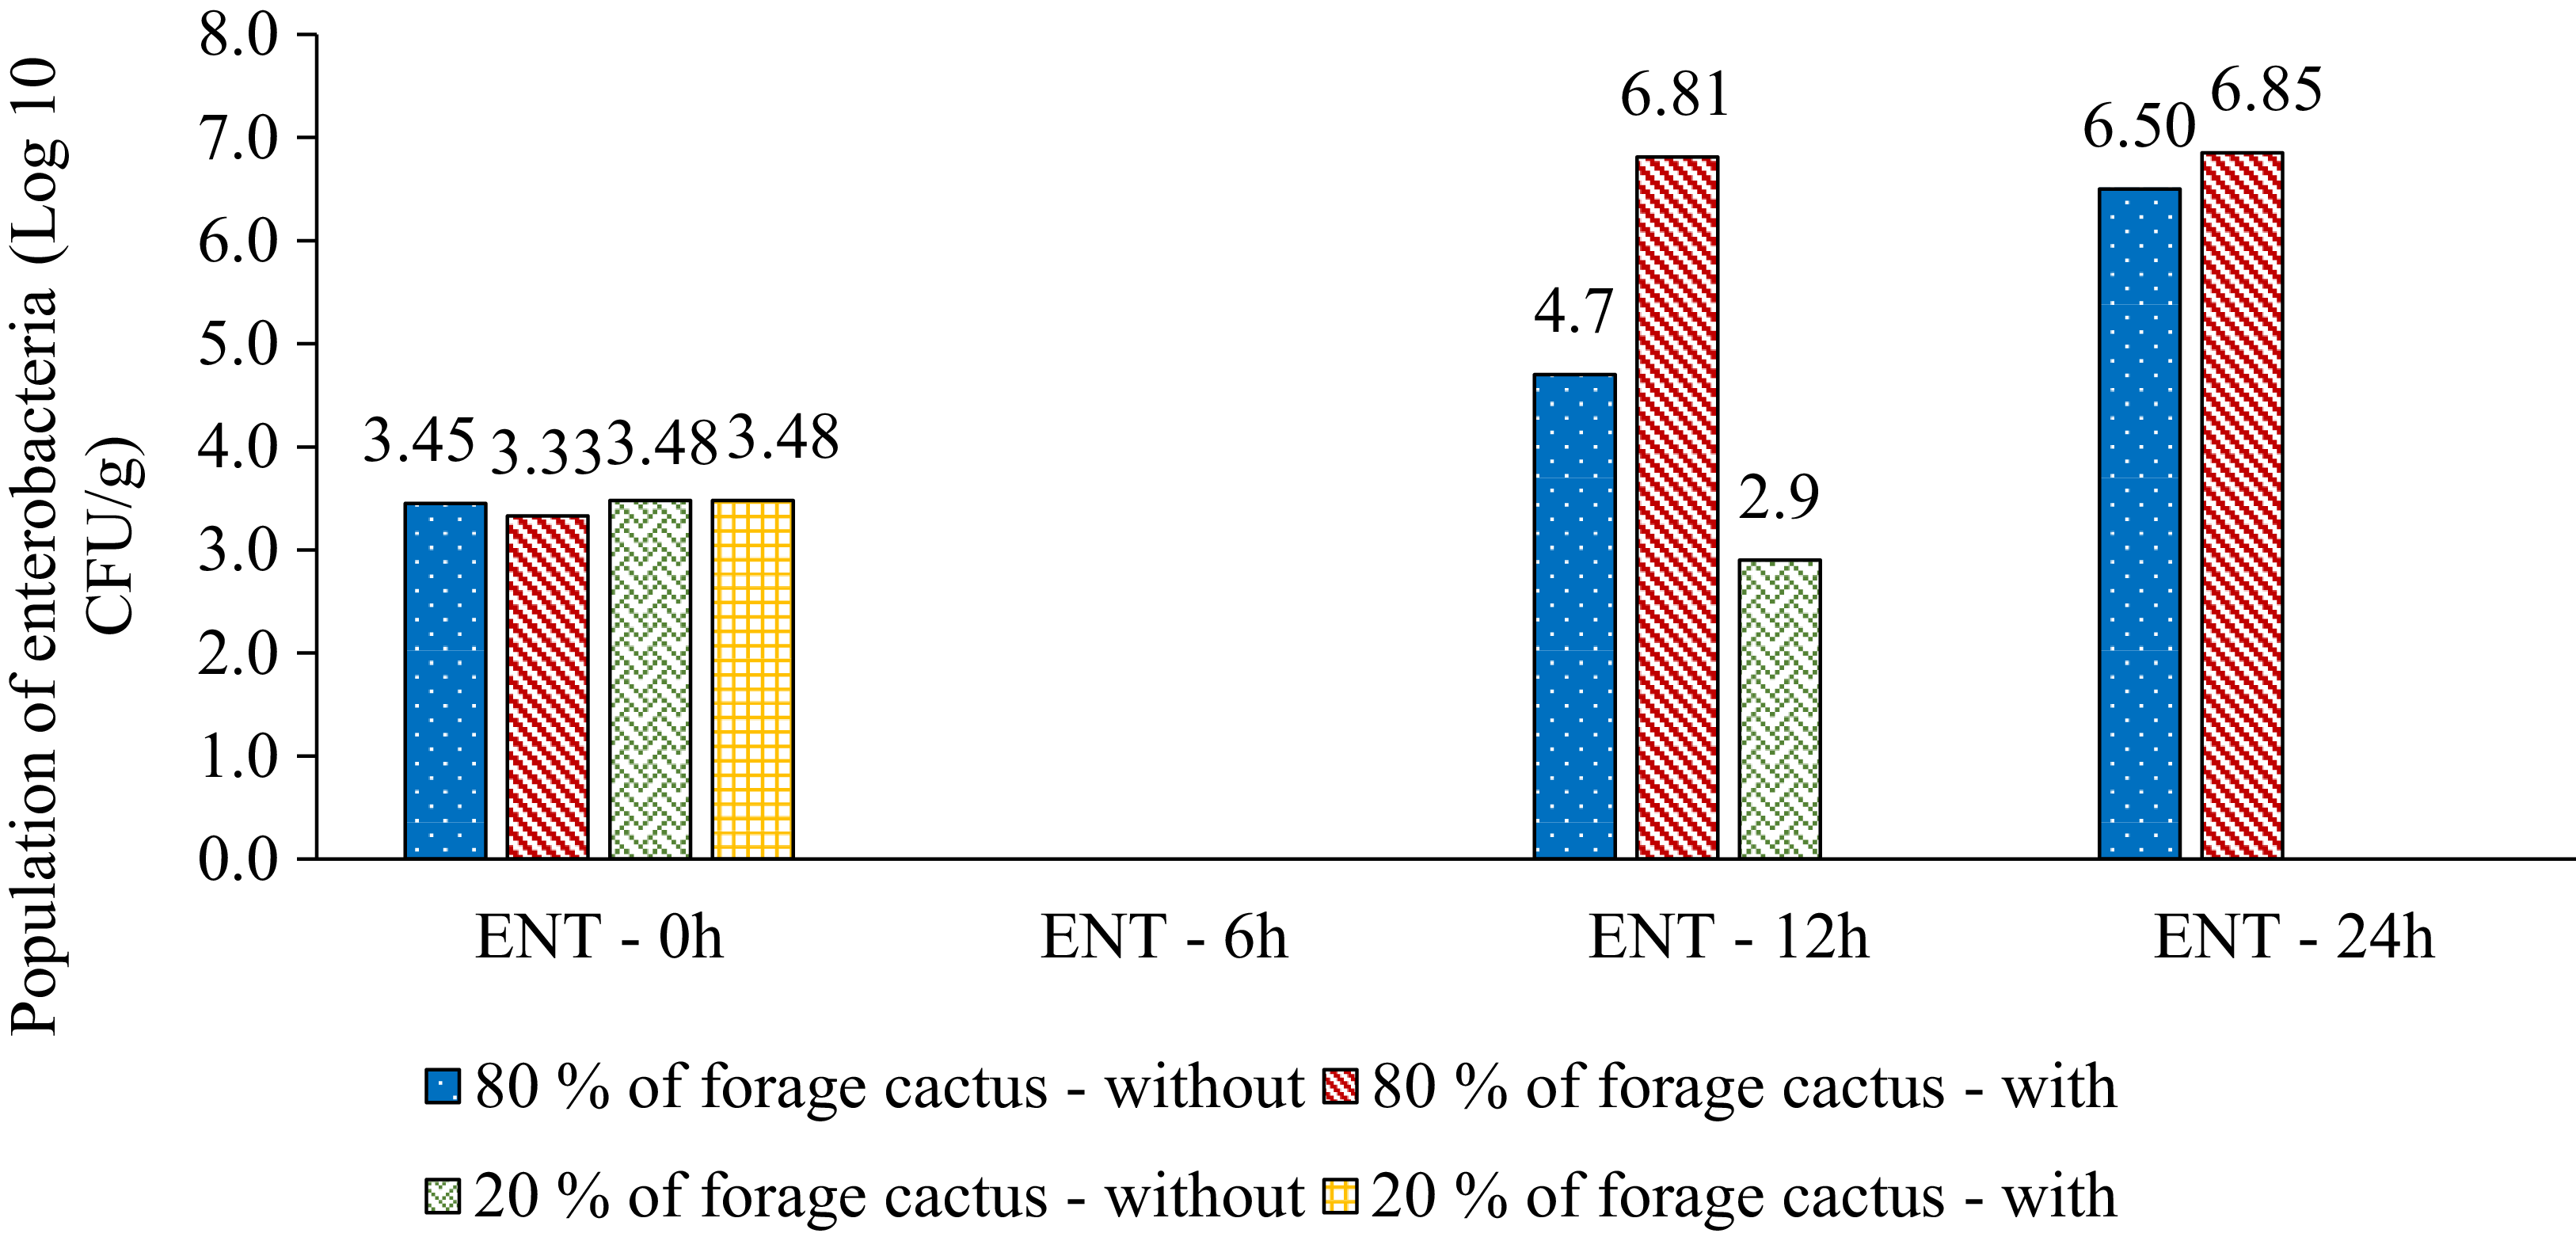
Enterobacteriaceae counts showed fairly uniform counts at 0 h for all treatments. However, at 6 h, there was no detectable presence. At 12 and 24 h, these groups resumed growth at 80 % FC. At 12 and 24 h, values were greater in contaminated treatments (Figure 1).
Enterobacteria (ENT) population (log10 CFU/g) in mixtures of forage cactus and forage sorghum silage with or without goat faecal contamination over 24 h of aerobic exposure. CFU = colony-forming unit.

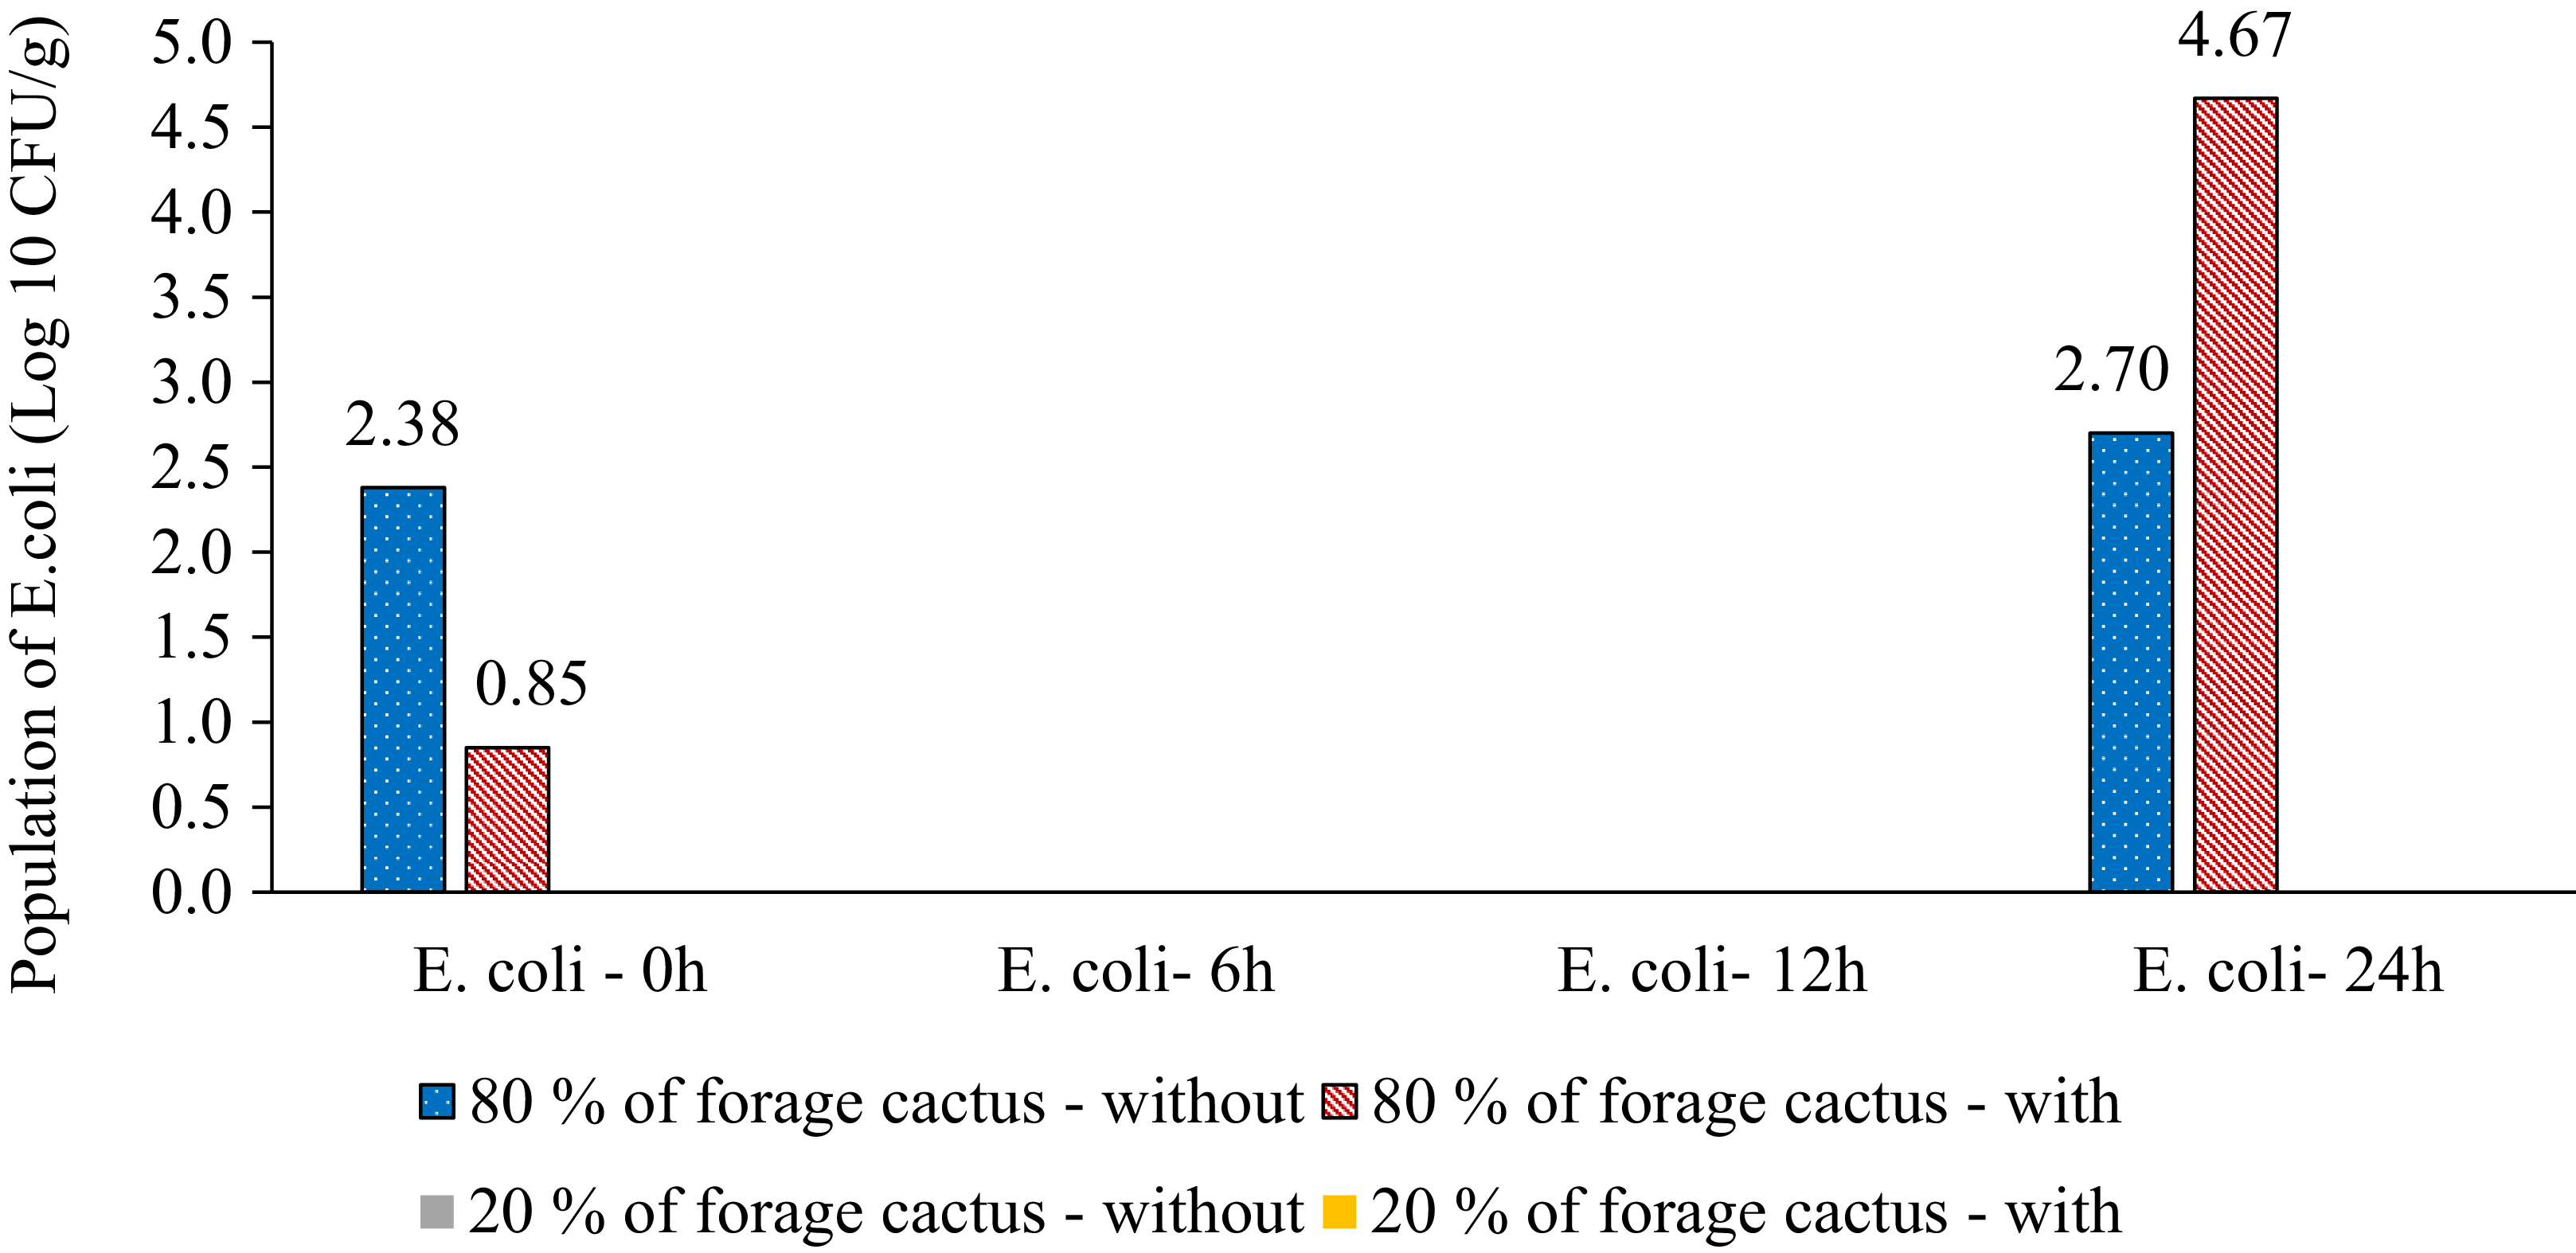
Regarding E. coli counts, no E. coli presence was detected at the 20 % FC level. Conversely, in treatments with 80 % FC, E. coli was detected at 0 and 24 h, with a greater value at 24 h in the presence of faecal contamination (Figure 2).
Escherichia coli population (log10 CFU/g) in mixtures of forage cactus and forage sorghum silage with or without goat faecal contamination over 24 h of aerobic exposure. CFU = colony-forming unit.

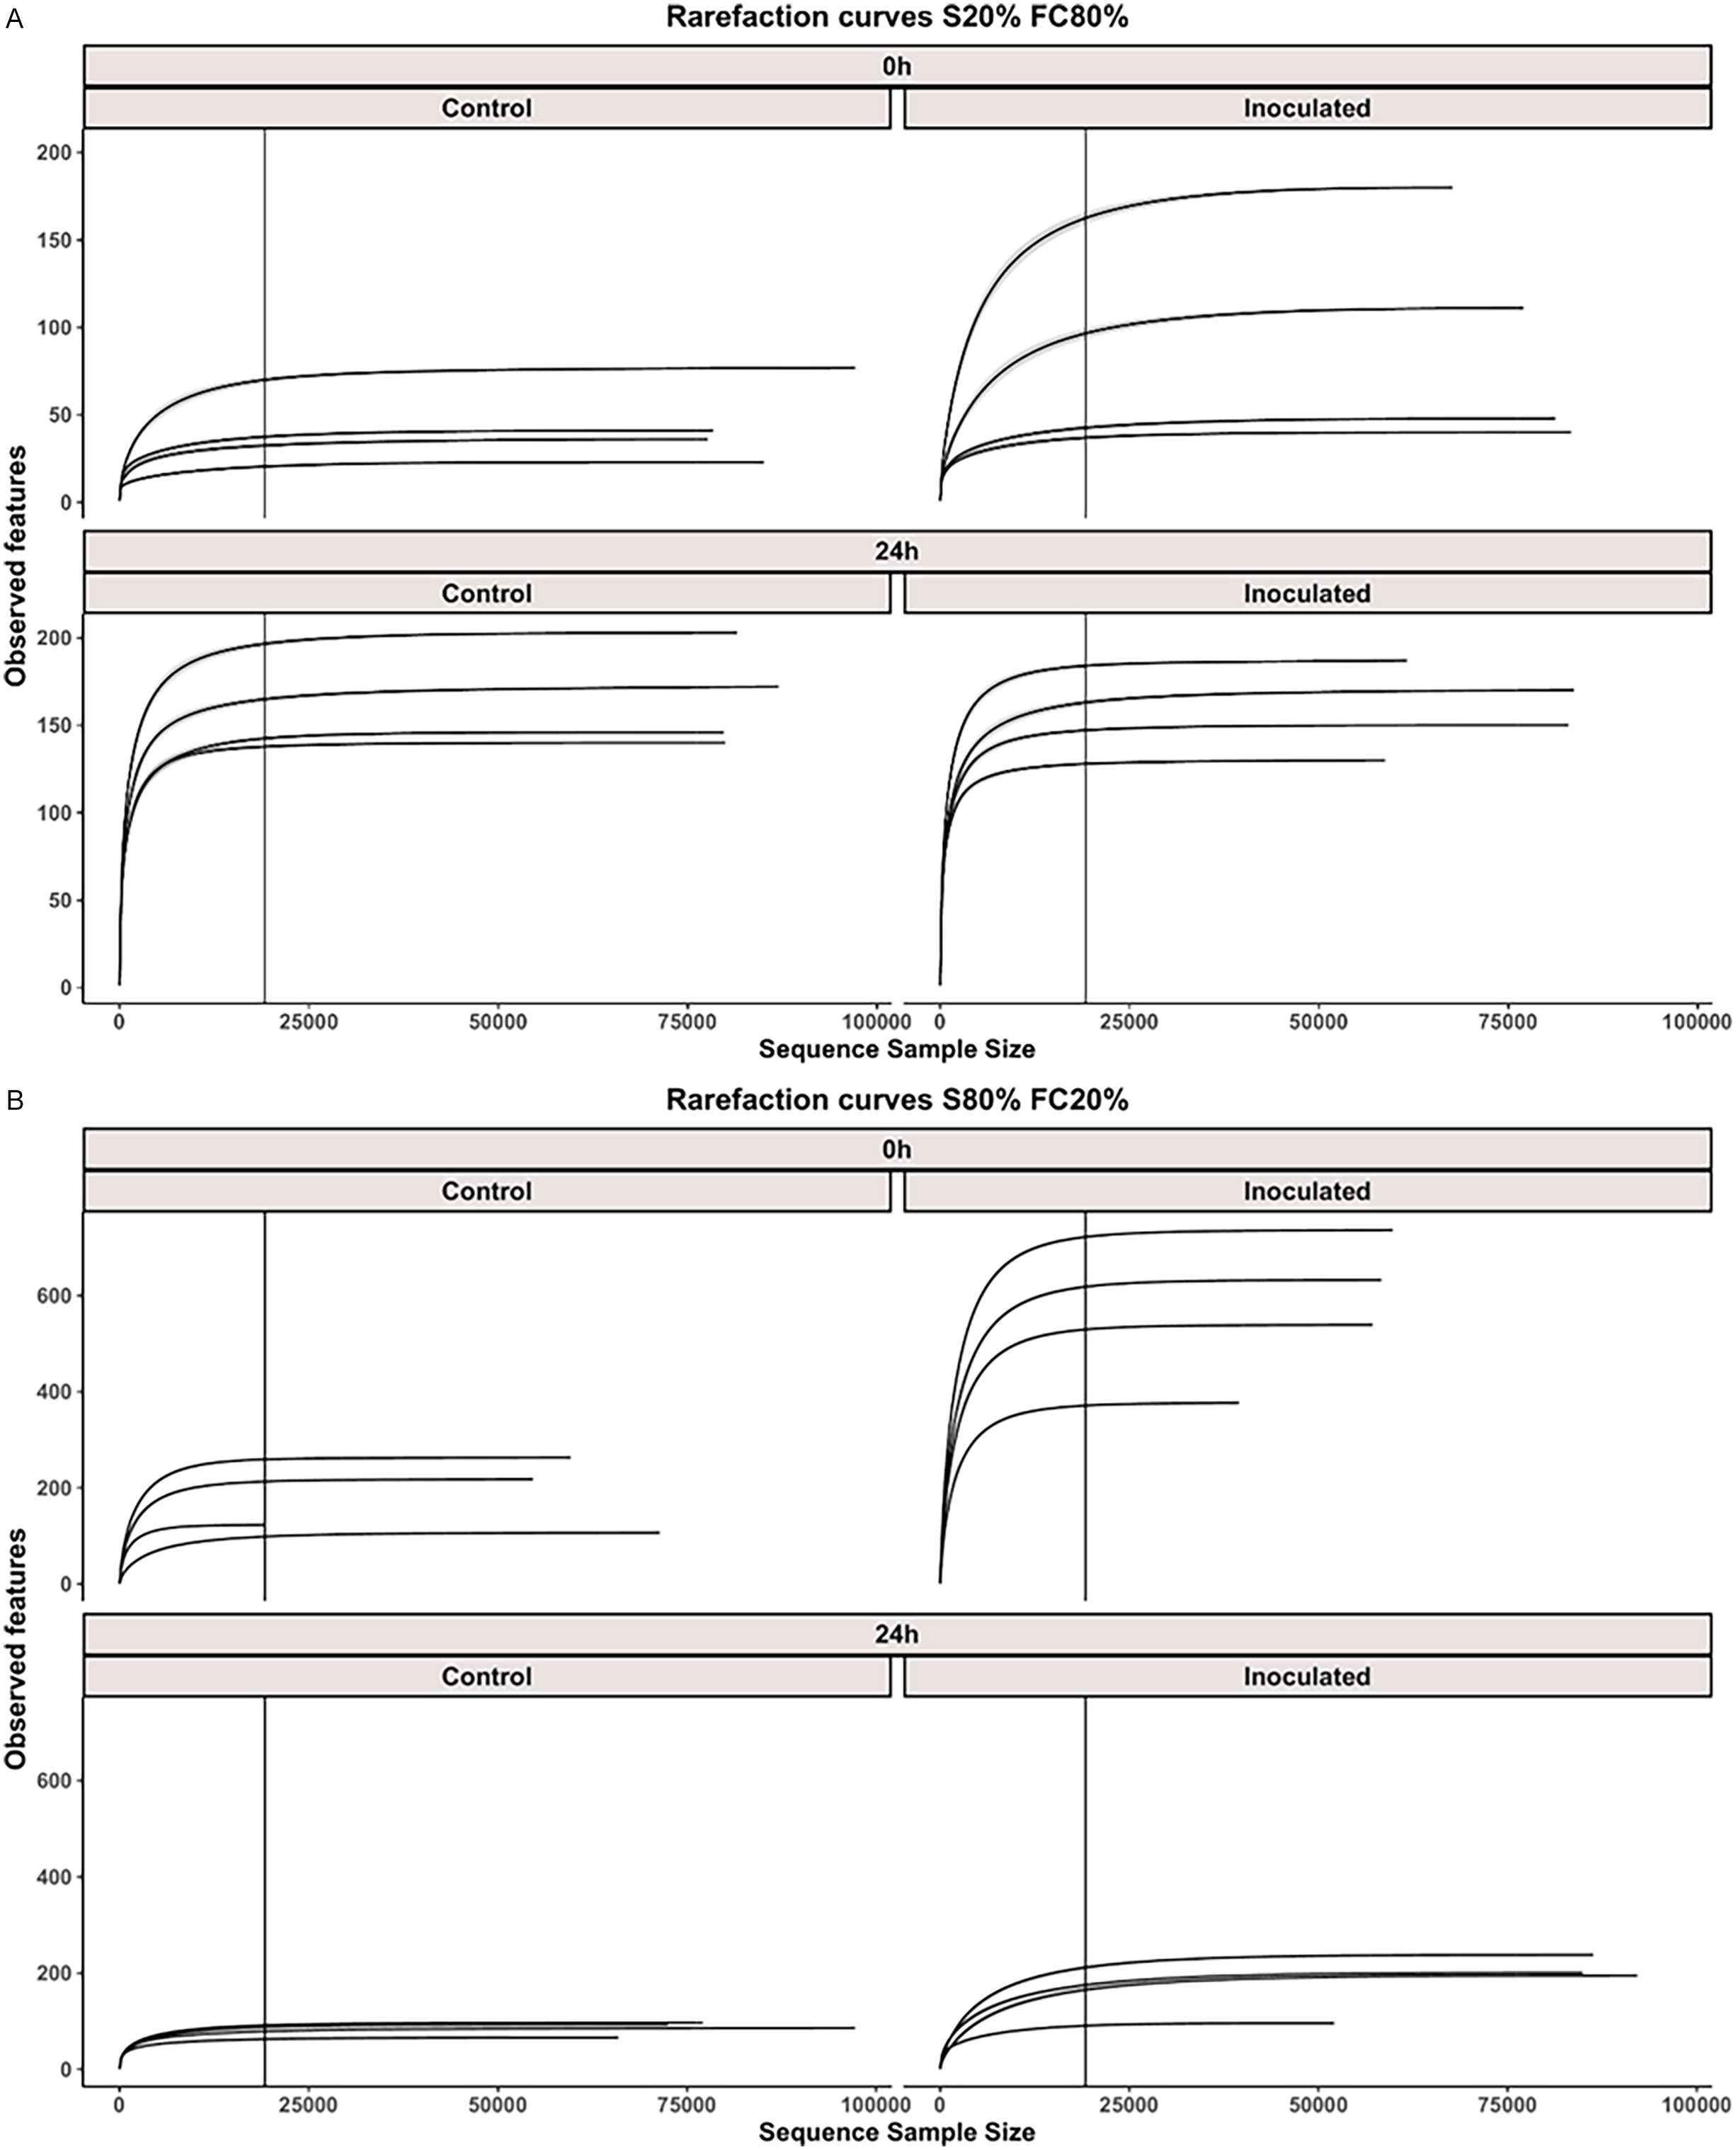
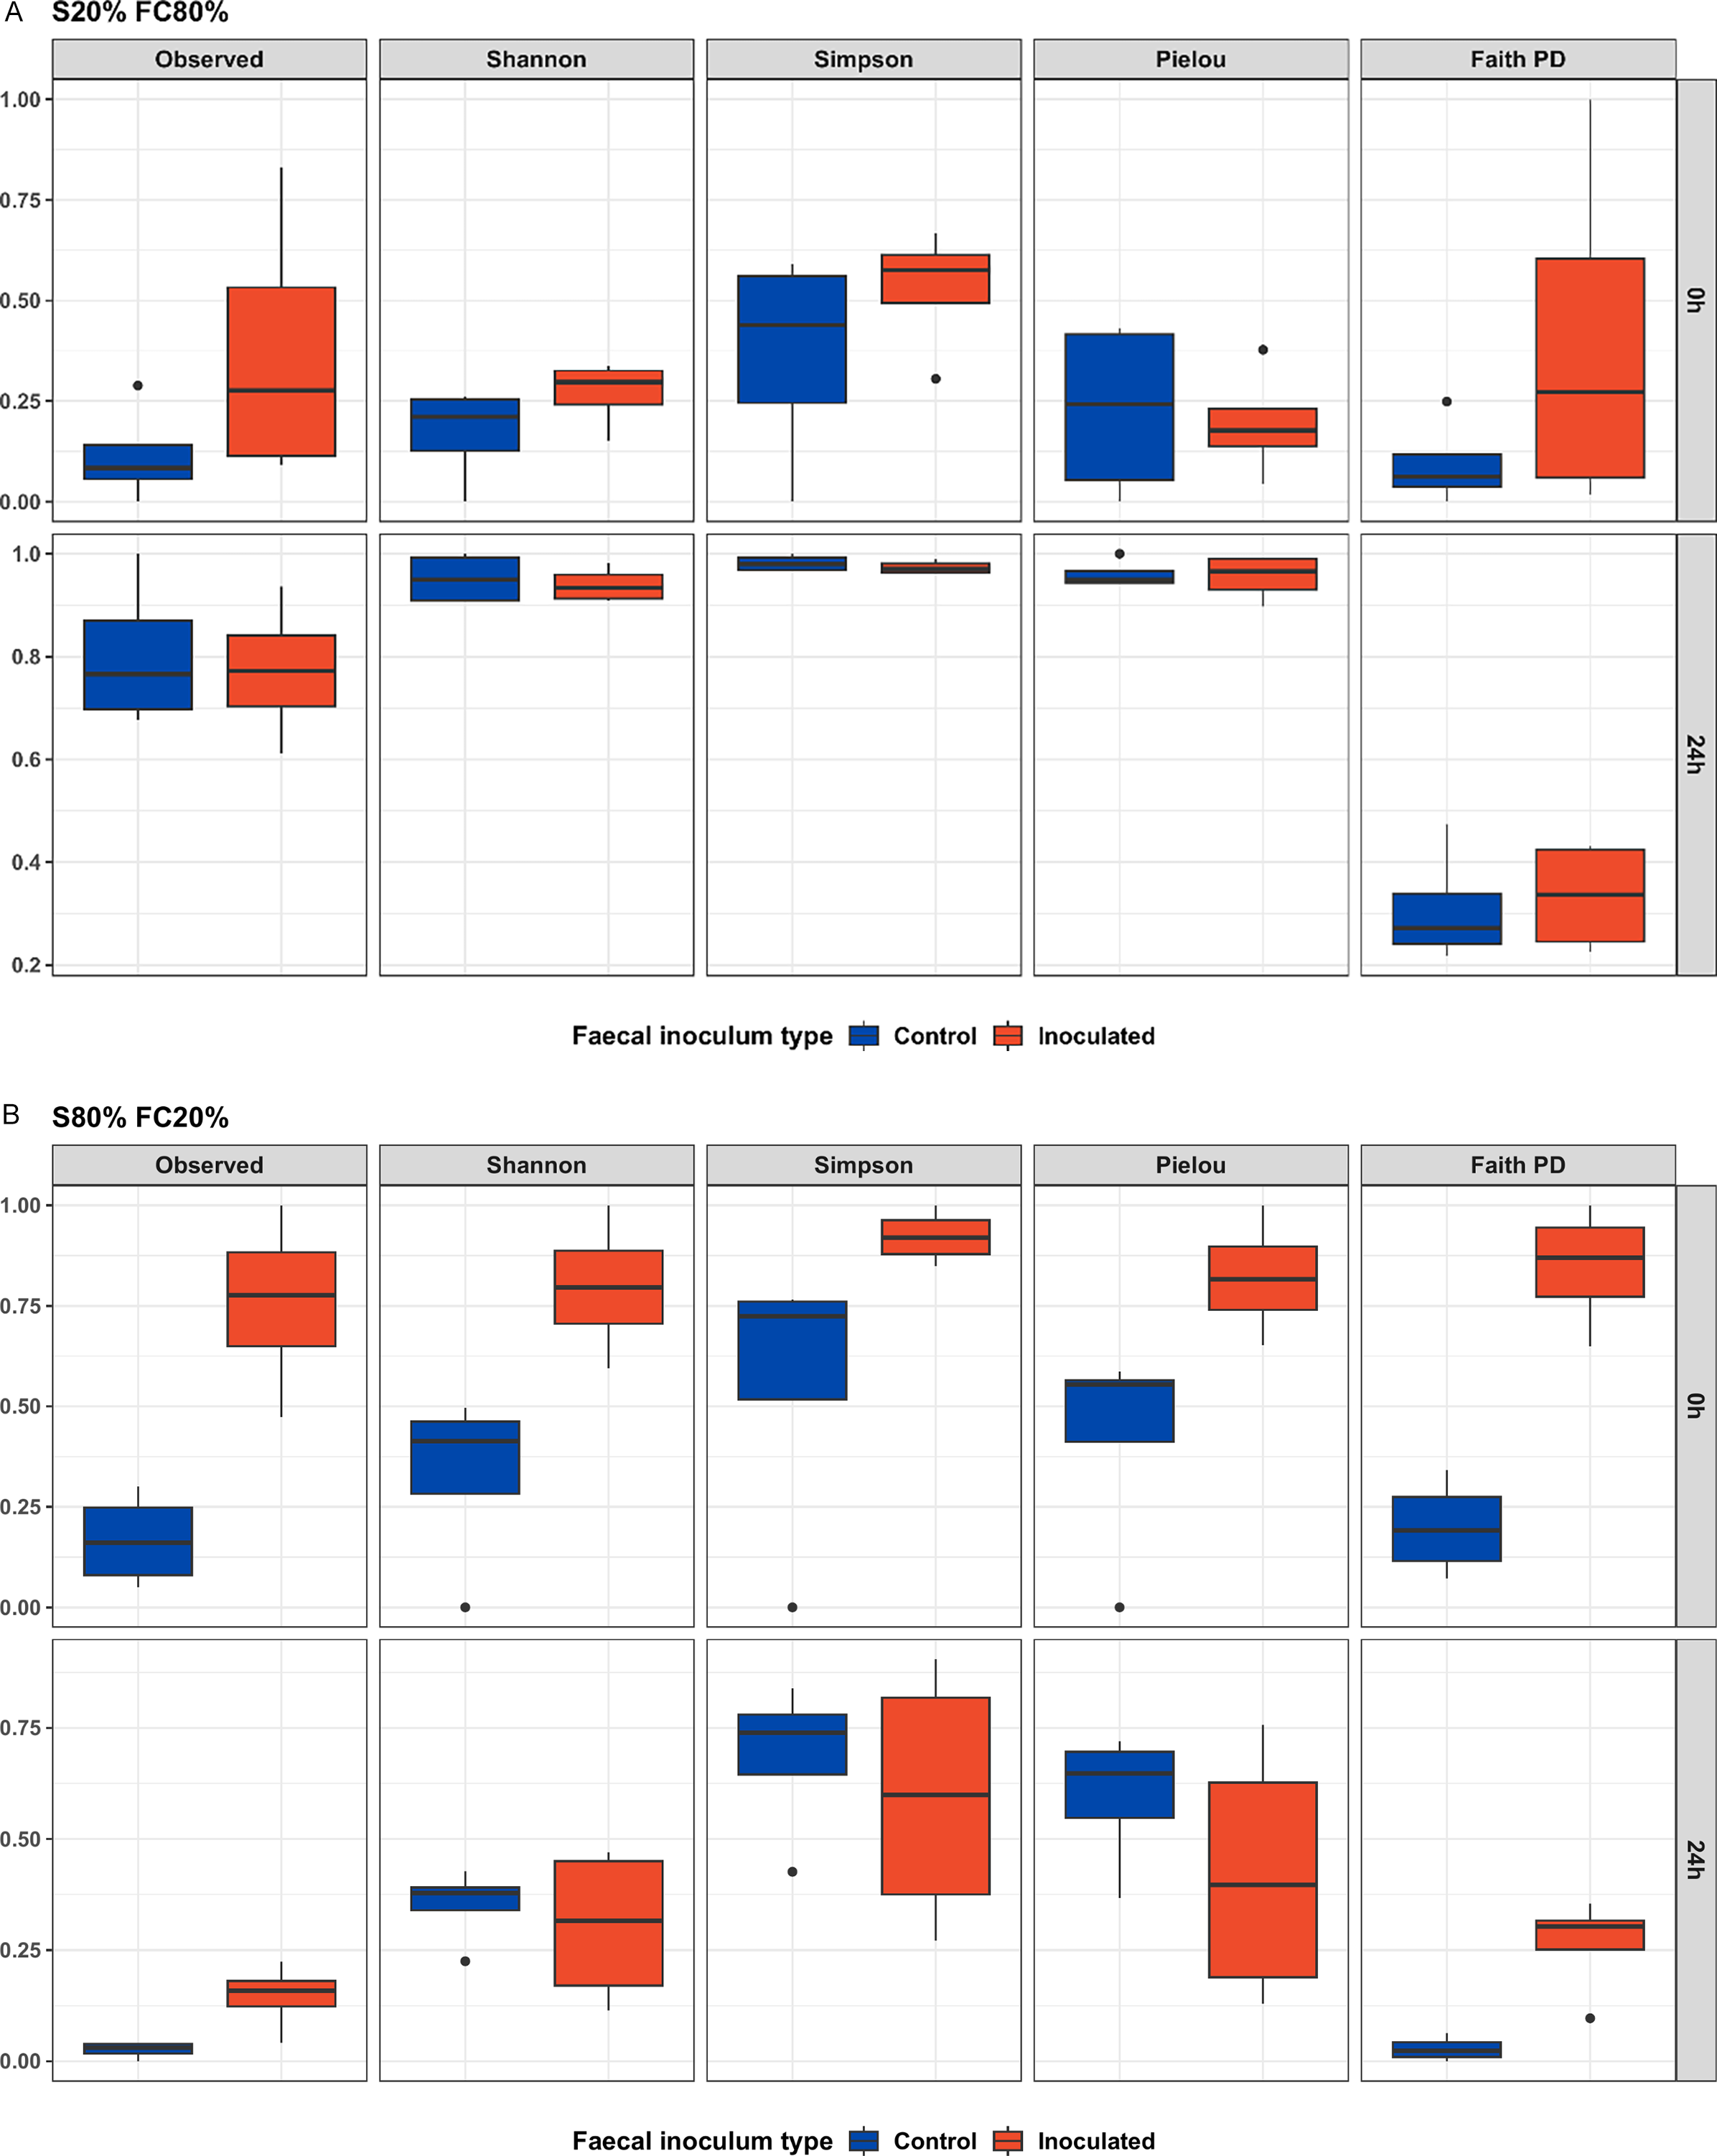
Rarefaction curves reached plateaus for all samples, indicating adequate sequencing depth. Good’s coverage values were above 0.95, confirming that the sequencing effort was sufficient to represent the bacterial diversity (Figure 3A,B). The data obtained from the bacterial community revealed 461 and 1267 ASVs after normalization of 19 200 reads per sample in treatments with 80 % FC. In the 80 % FC treatment, no clear effect of contamination was observed (Figure 4A), whereas in the 20 % FC (Figure 4B) treatments, the contaminated mixture showed greater diversity than the control group at time 0 h in the alpha diversity evaluation. Richness and evenness values were greater in 80 % FC and lower in 20 % FC at 24 h, with contamination showing little effect on these parameters.
Rarefaction curves of bacterial communities in mixtures of forage cactus (FC) and forage sorghum silage (S): 20% FC + 80% S (Figure 3A) and 80% FC + 20% S (Figure 3B), with or without contamination (control vs. inoculated) at 0 and 24 h of aerobic exposure. Curves reached asymptotes, indicating that sequencing depth was sufficient to capture microbial diversity. The vertical line represents the rarefaction threshold (19,200 reads).

Alpha diversity indices in mixtures of forage cactus (FC) and forage sorghum silage (S): 80 % FC (Figure 4A) and 20 % FC (Figure 4B), with or without goat faecal contamination at 0 and 24 h of aerobic exposure.

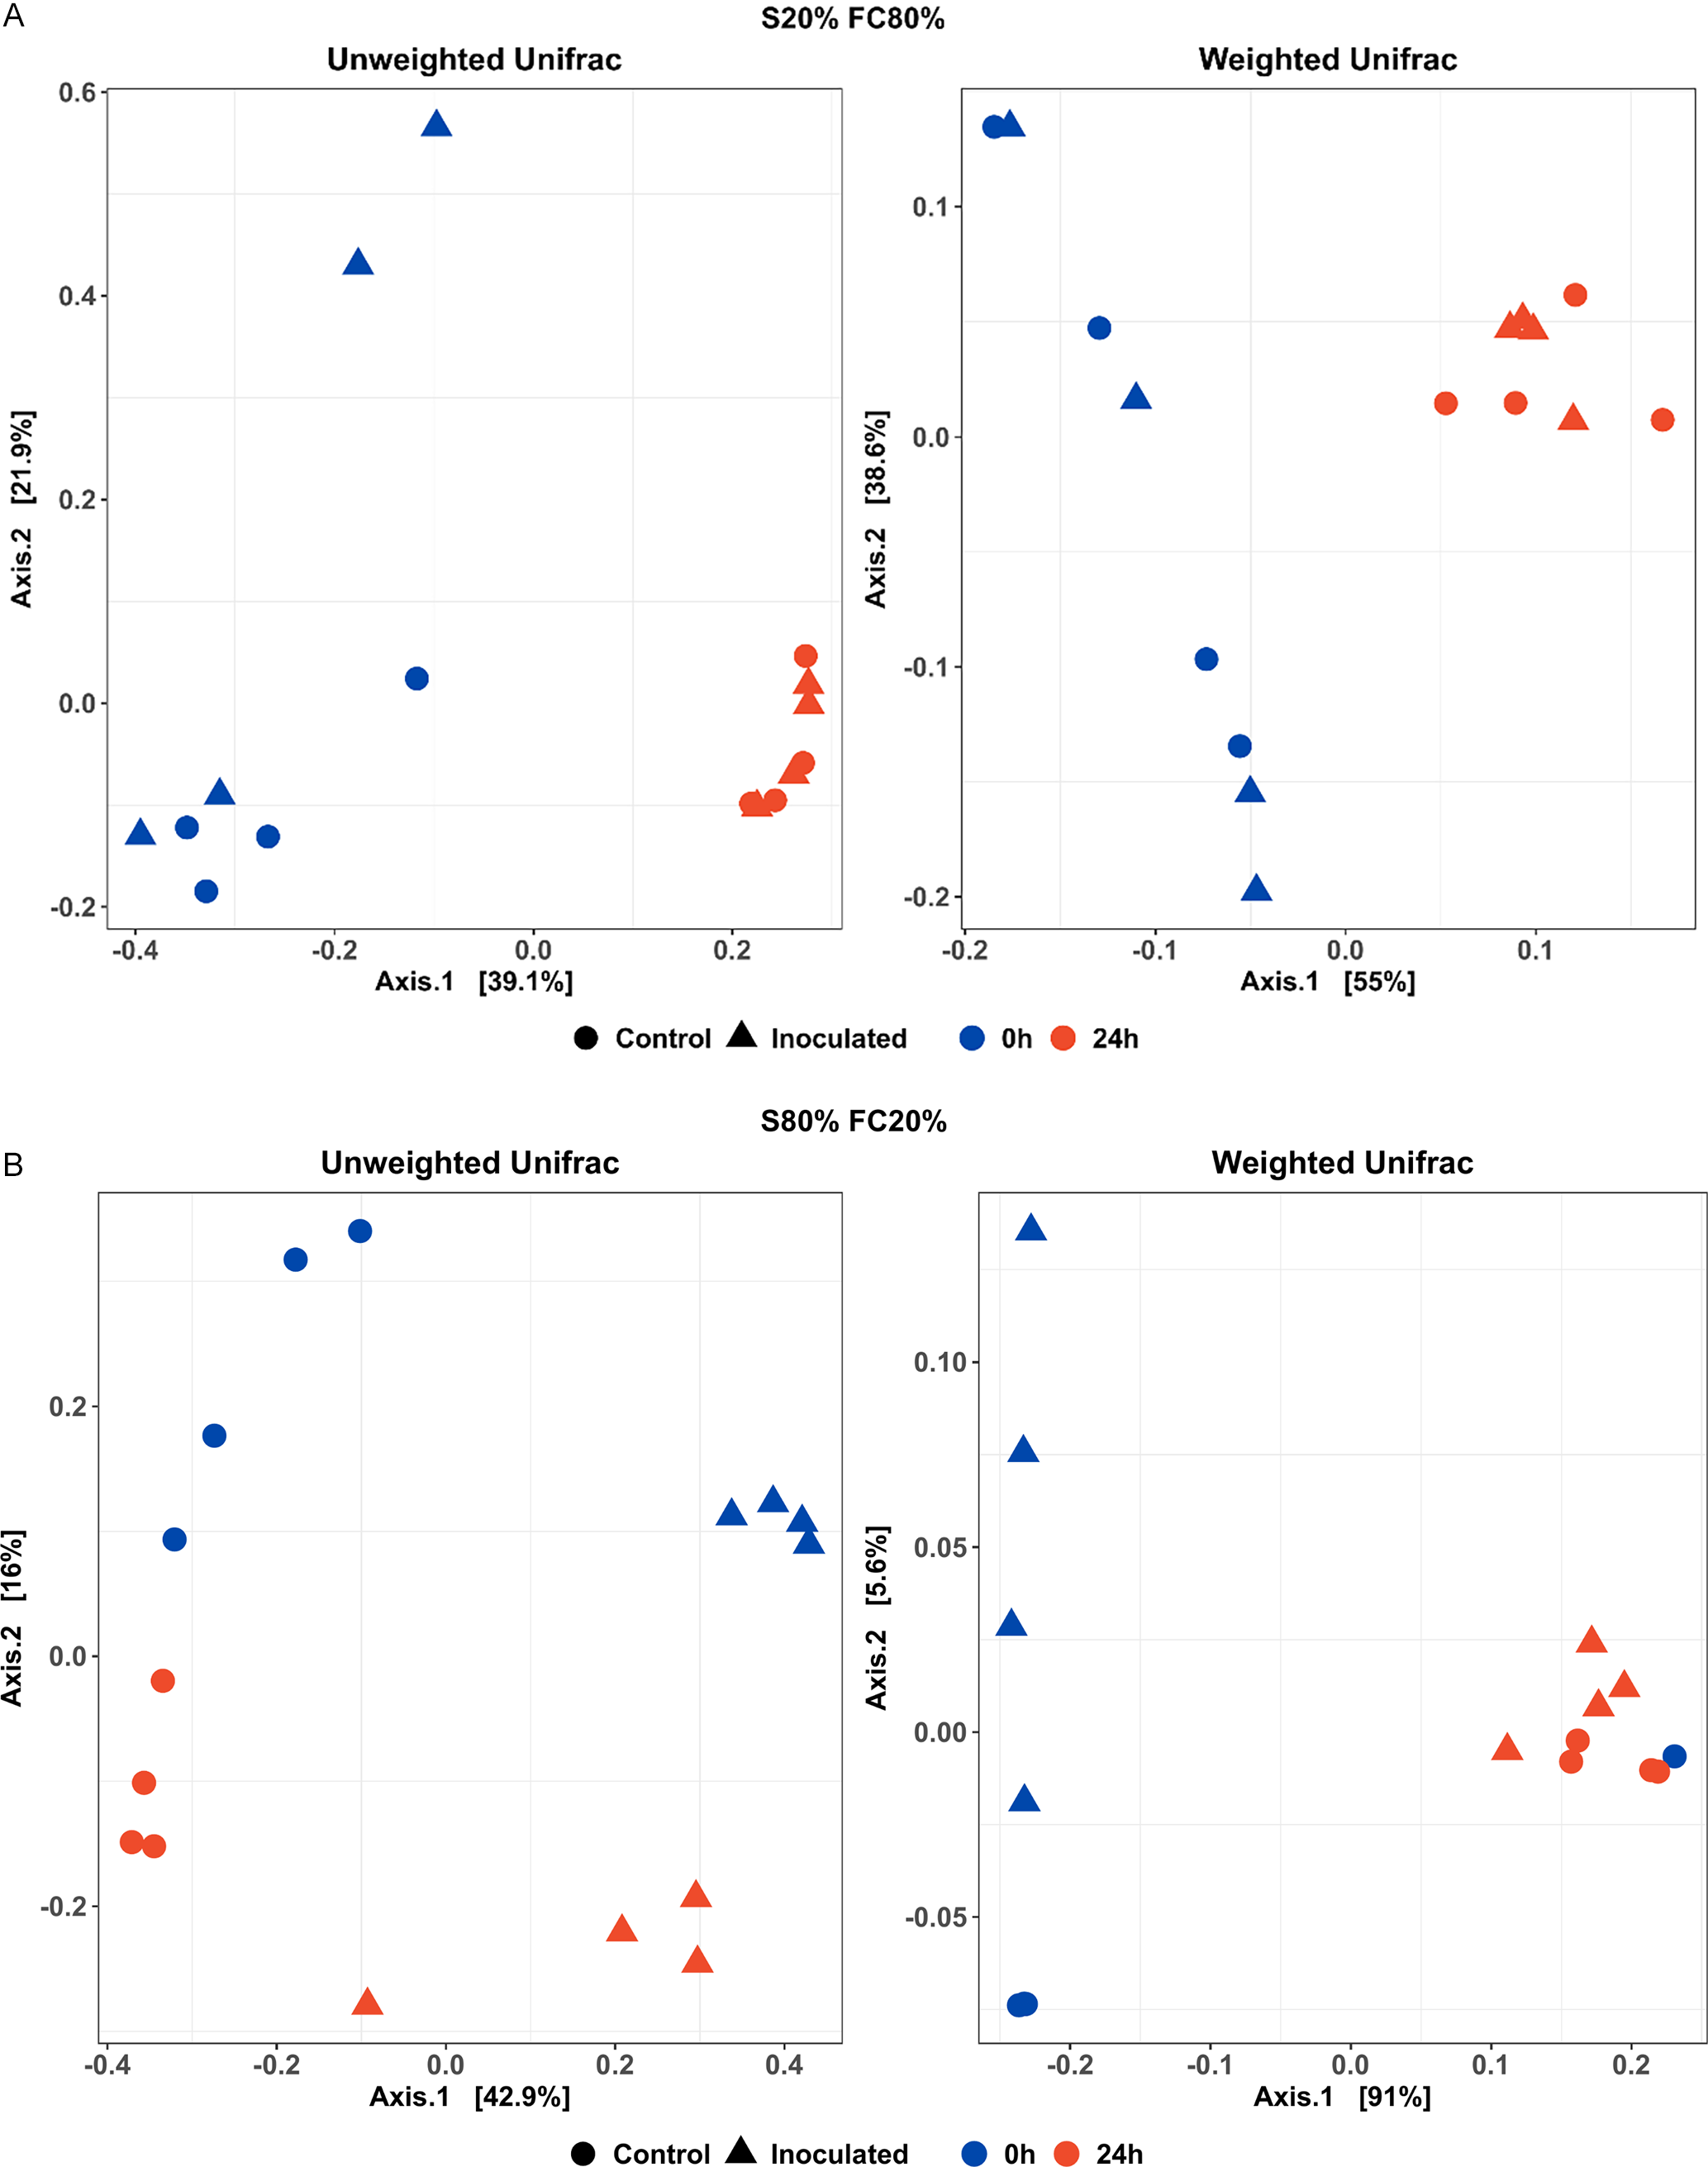
The exposure period separated the samples in the beta diversity assessment, with no apparent differences related to contamination in 80 % FC (Figure 5A). However, contamination and the time period influenced the composition of the bacterial communities, as clustering was observed in all treatments (Figure 5B).
Beta diversity PCoA plots using weighted and unweighted UniFrac metrics: 80 % forage cactus (FC) (Figure 5A) and 20 % FC (Figure 5B), showing clustering patterns based on contamination and aerobic exposure time.

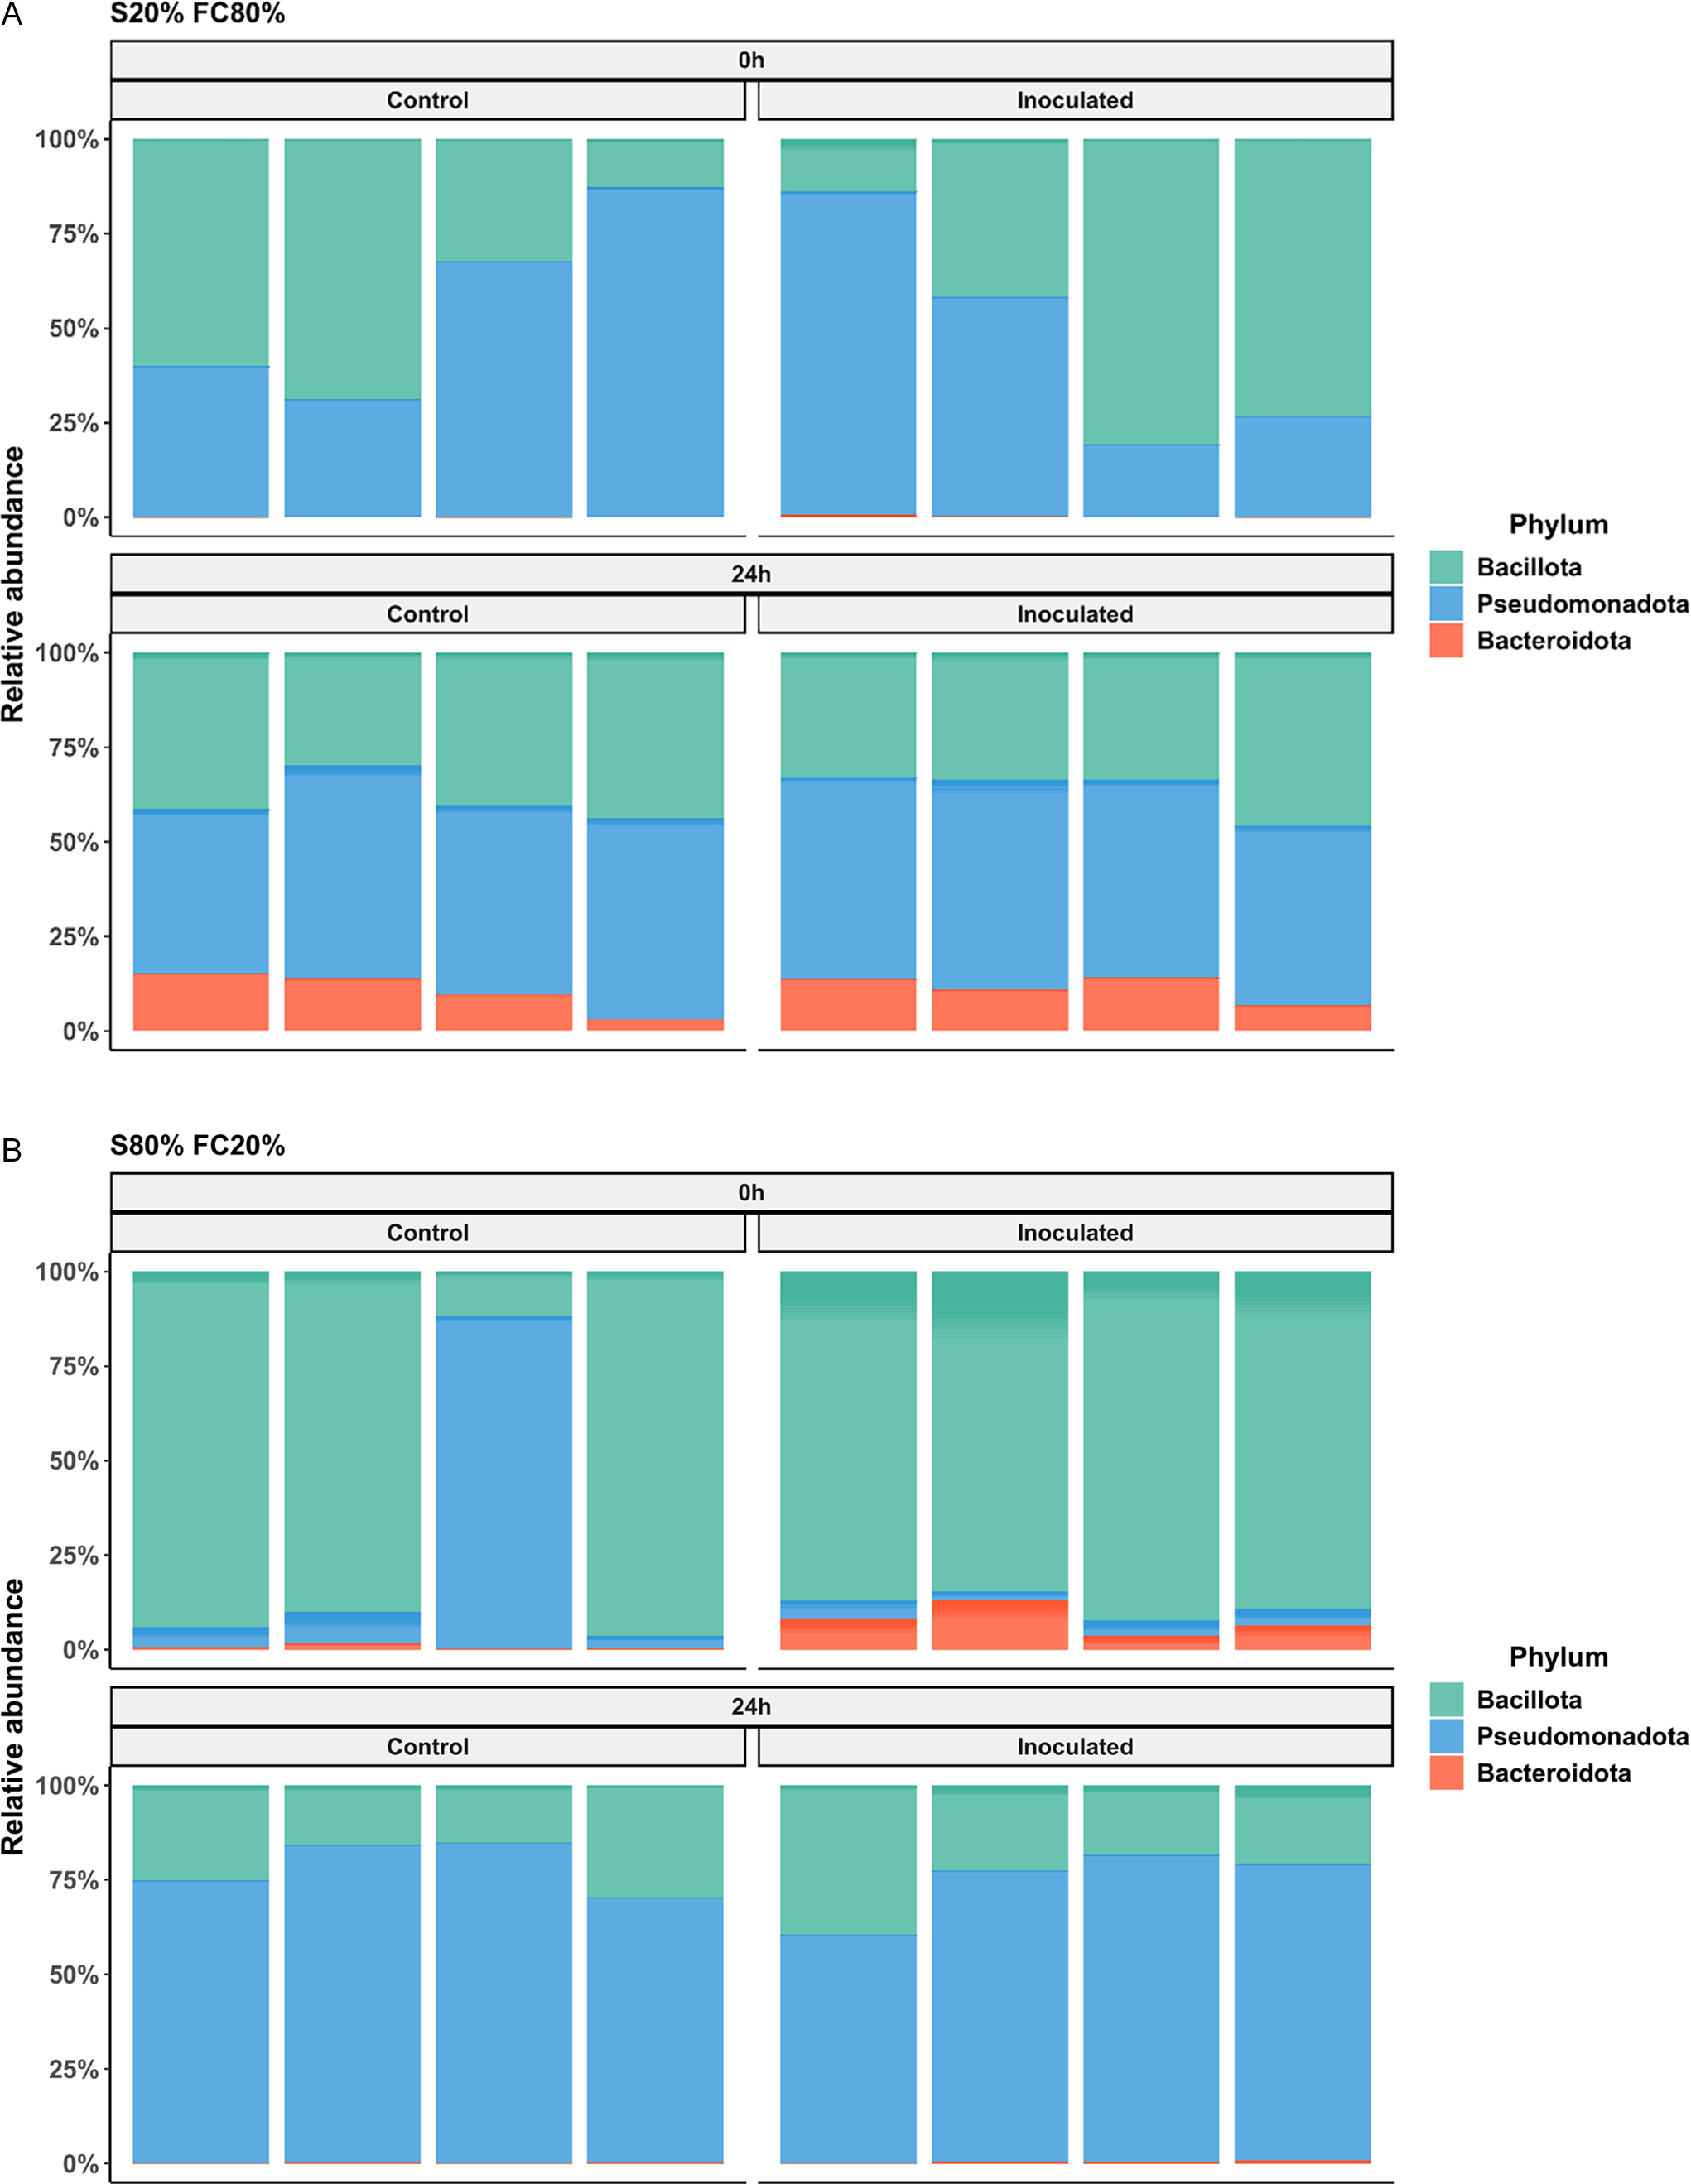
The main bacterial phyla identified in the analysis of relative abundance in 80 % FC were Bacillota, Pseudomonadota and Bacteroidota (Figure 6A). Pseudomonadota and Bacillota were more prevalent at 0 and 24 h, respectively, while Bacteroidota was present at all times. In 20 % FC, the same phyla were present, however, marked by a greater presence of Bacillota at 0 h and Pseudomonadota at 24 h (Figure 6B).
Relative abundance of major bacterial phyla in mixtures with 80 % (Figure 6A) and 20 % (Figure 6B) forage cactus (FC), with or without goat faecal contamination at 0 and 24 h of aerobic exposure.

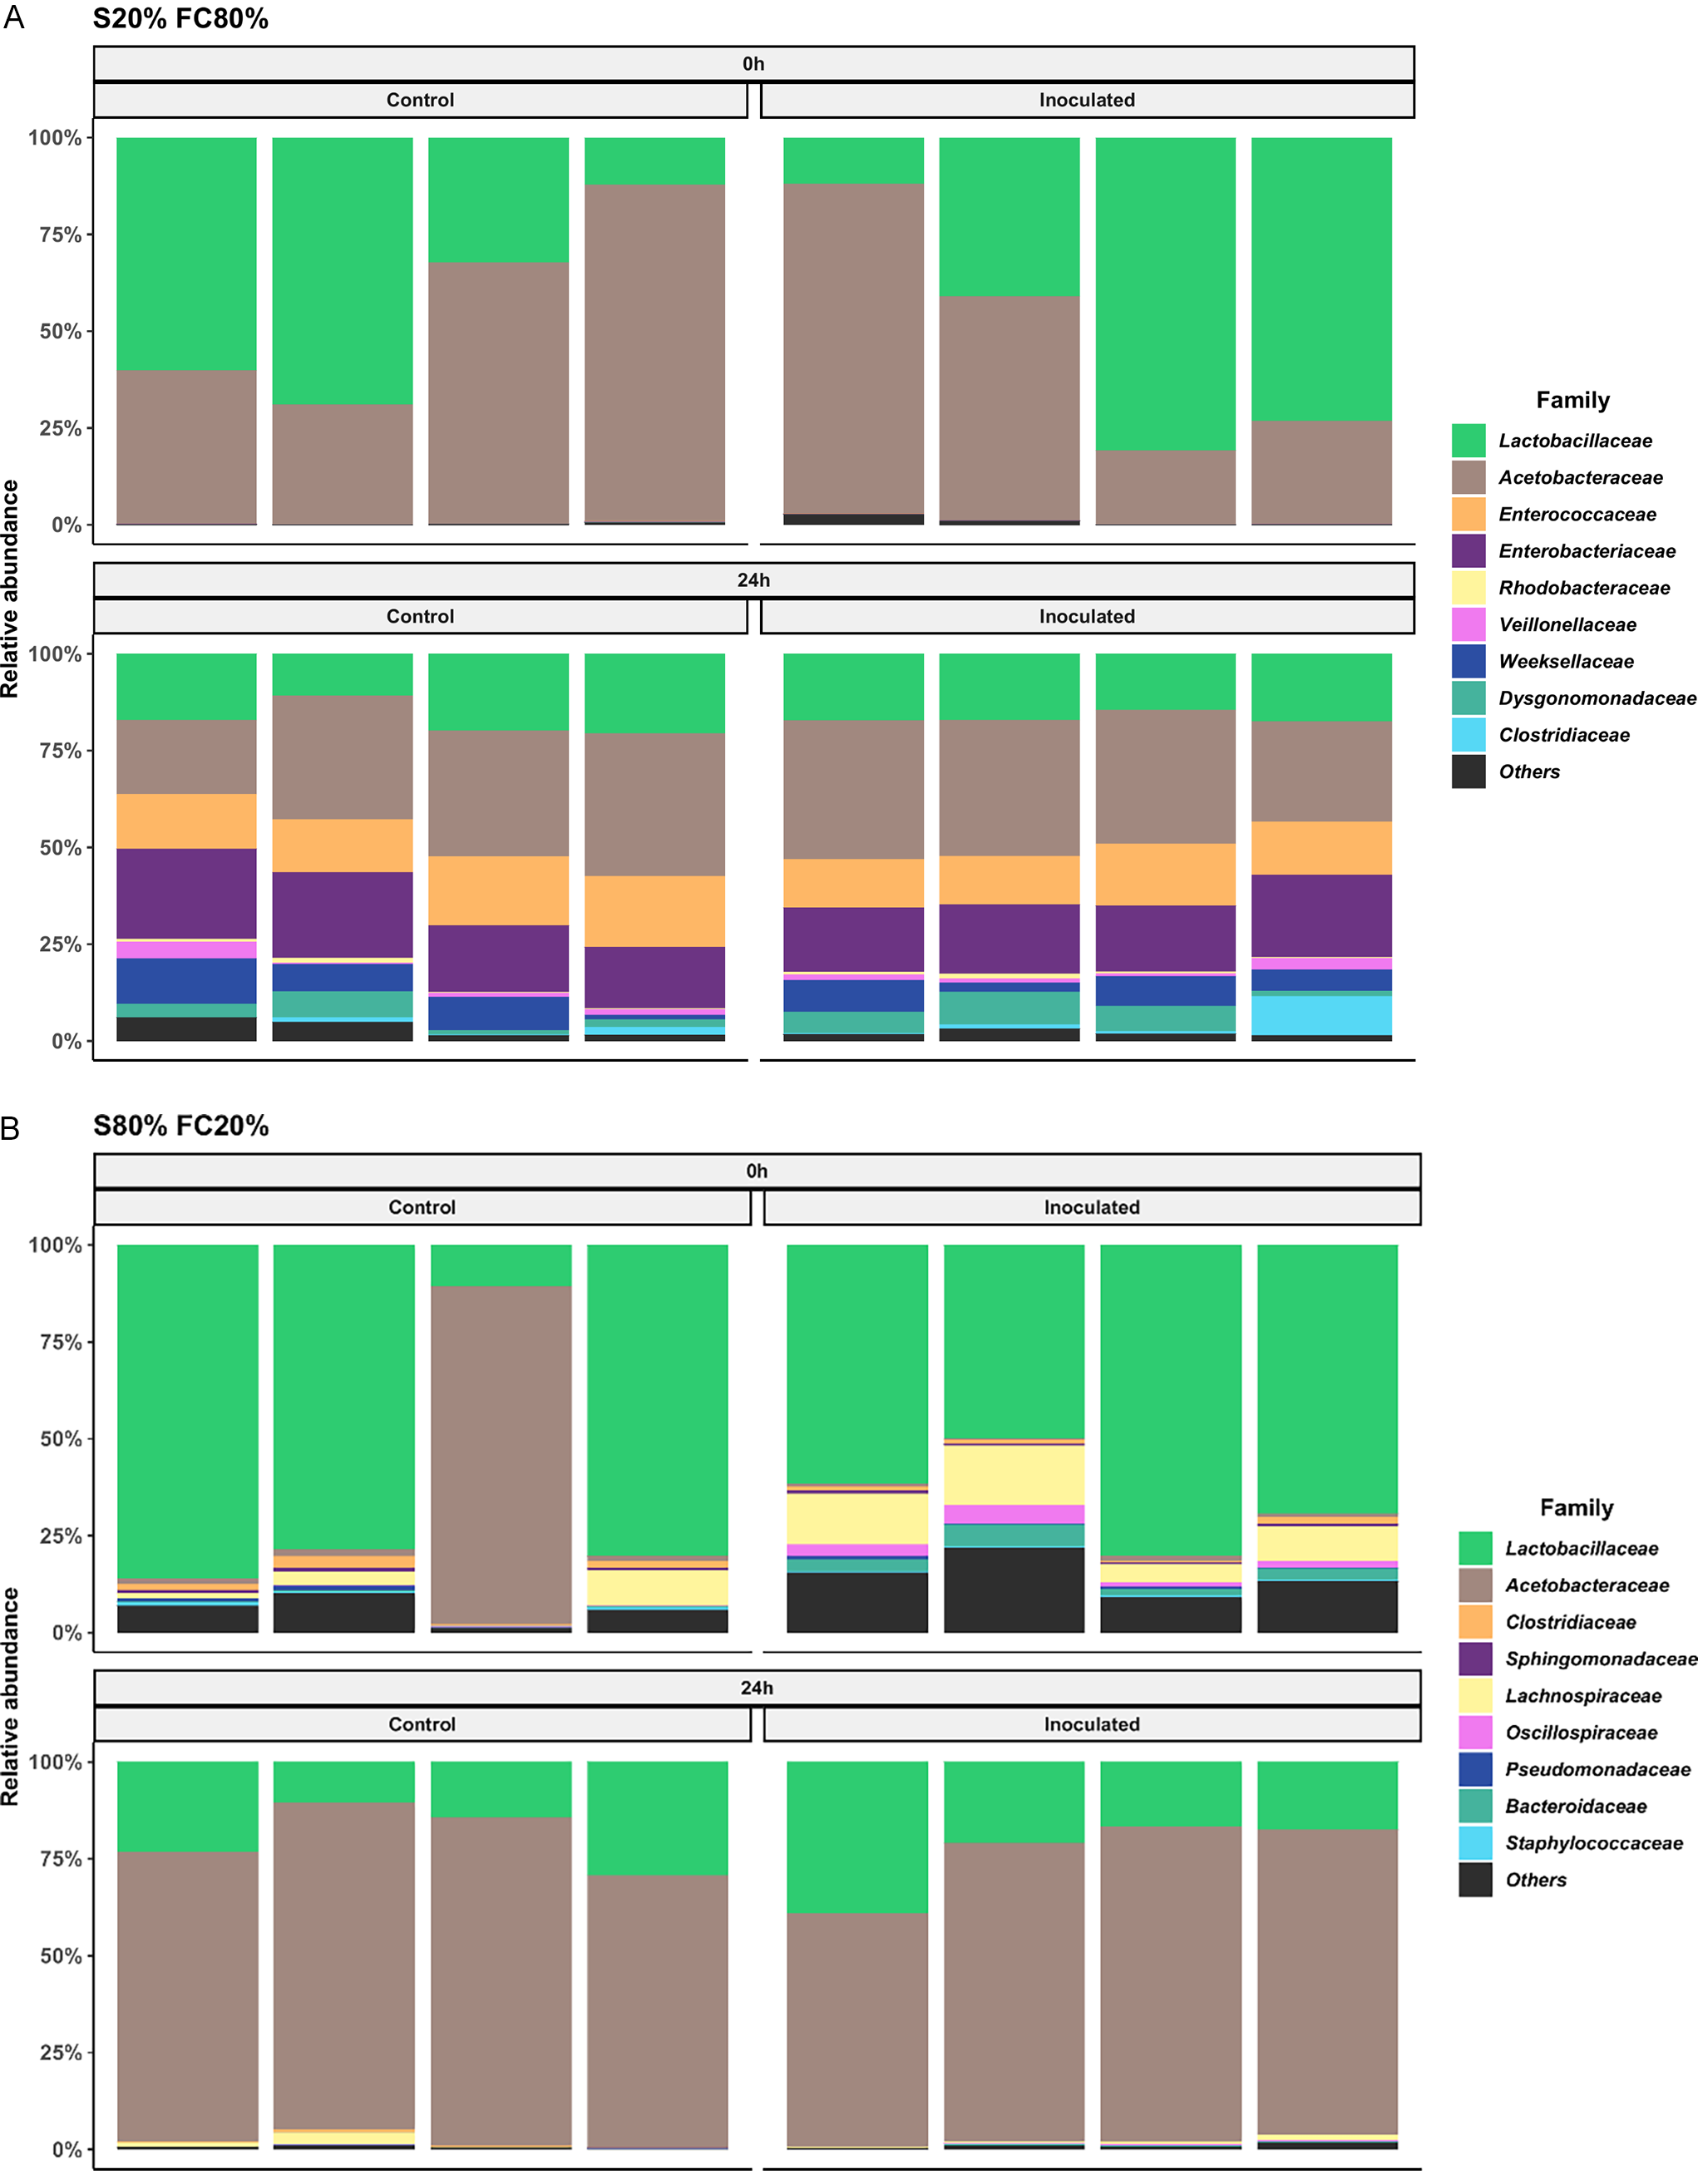
The main bacterial families identified in the analysis of relative abundance in 80 % FC were: Lactobacillaceae, Acetobacteraceae, Enterococcaceae, Enterobacteriaceae, Rhodobacteraceae, Veillonellaceae, Weeksellaceae, Dysgonomonaceae and Costriadiaceae (Figure 7A). The presence of Lactobacillaceae and Acetobacteraceae was observed at 0 h, and a high abundance of gram-negative bacteria was observed at 24 h of exposure. In 20 % FC, the most abundant families were Lactobacillaceae, Acetobacteraceae, Costriadiaceae, Sphingomonaceae, Lachnospiraceae, Oscillospiraceae, Bacteroidaceae and Pseudomonadaceae (Figure 7B). In the largest proportion of sorghum silage, Lactobacillaceae and Lachnospiraceae were present at 0 h in the contaminated treatment. At 24 h, Acetobacteraceae dominated the mixture with a small presence of Lactobacillaceae.
Relative abundance of main bacterial families in mixtures with 80 (Figure 7A) and 20 % (Figure 7B) forage cactus (FC) under contamination and exposure conditions.

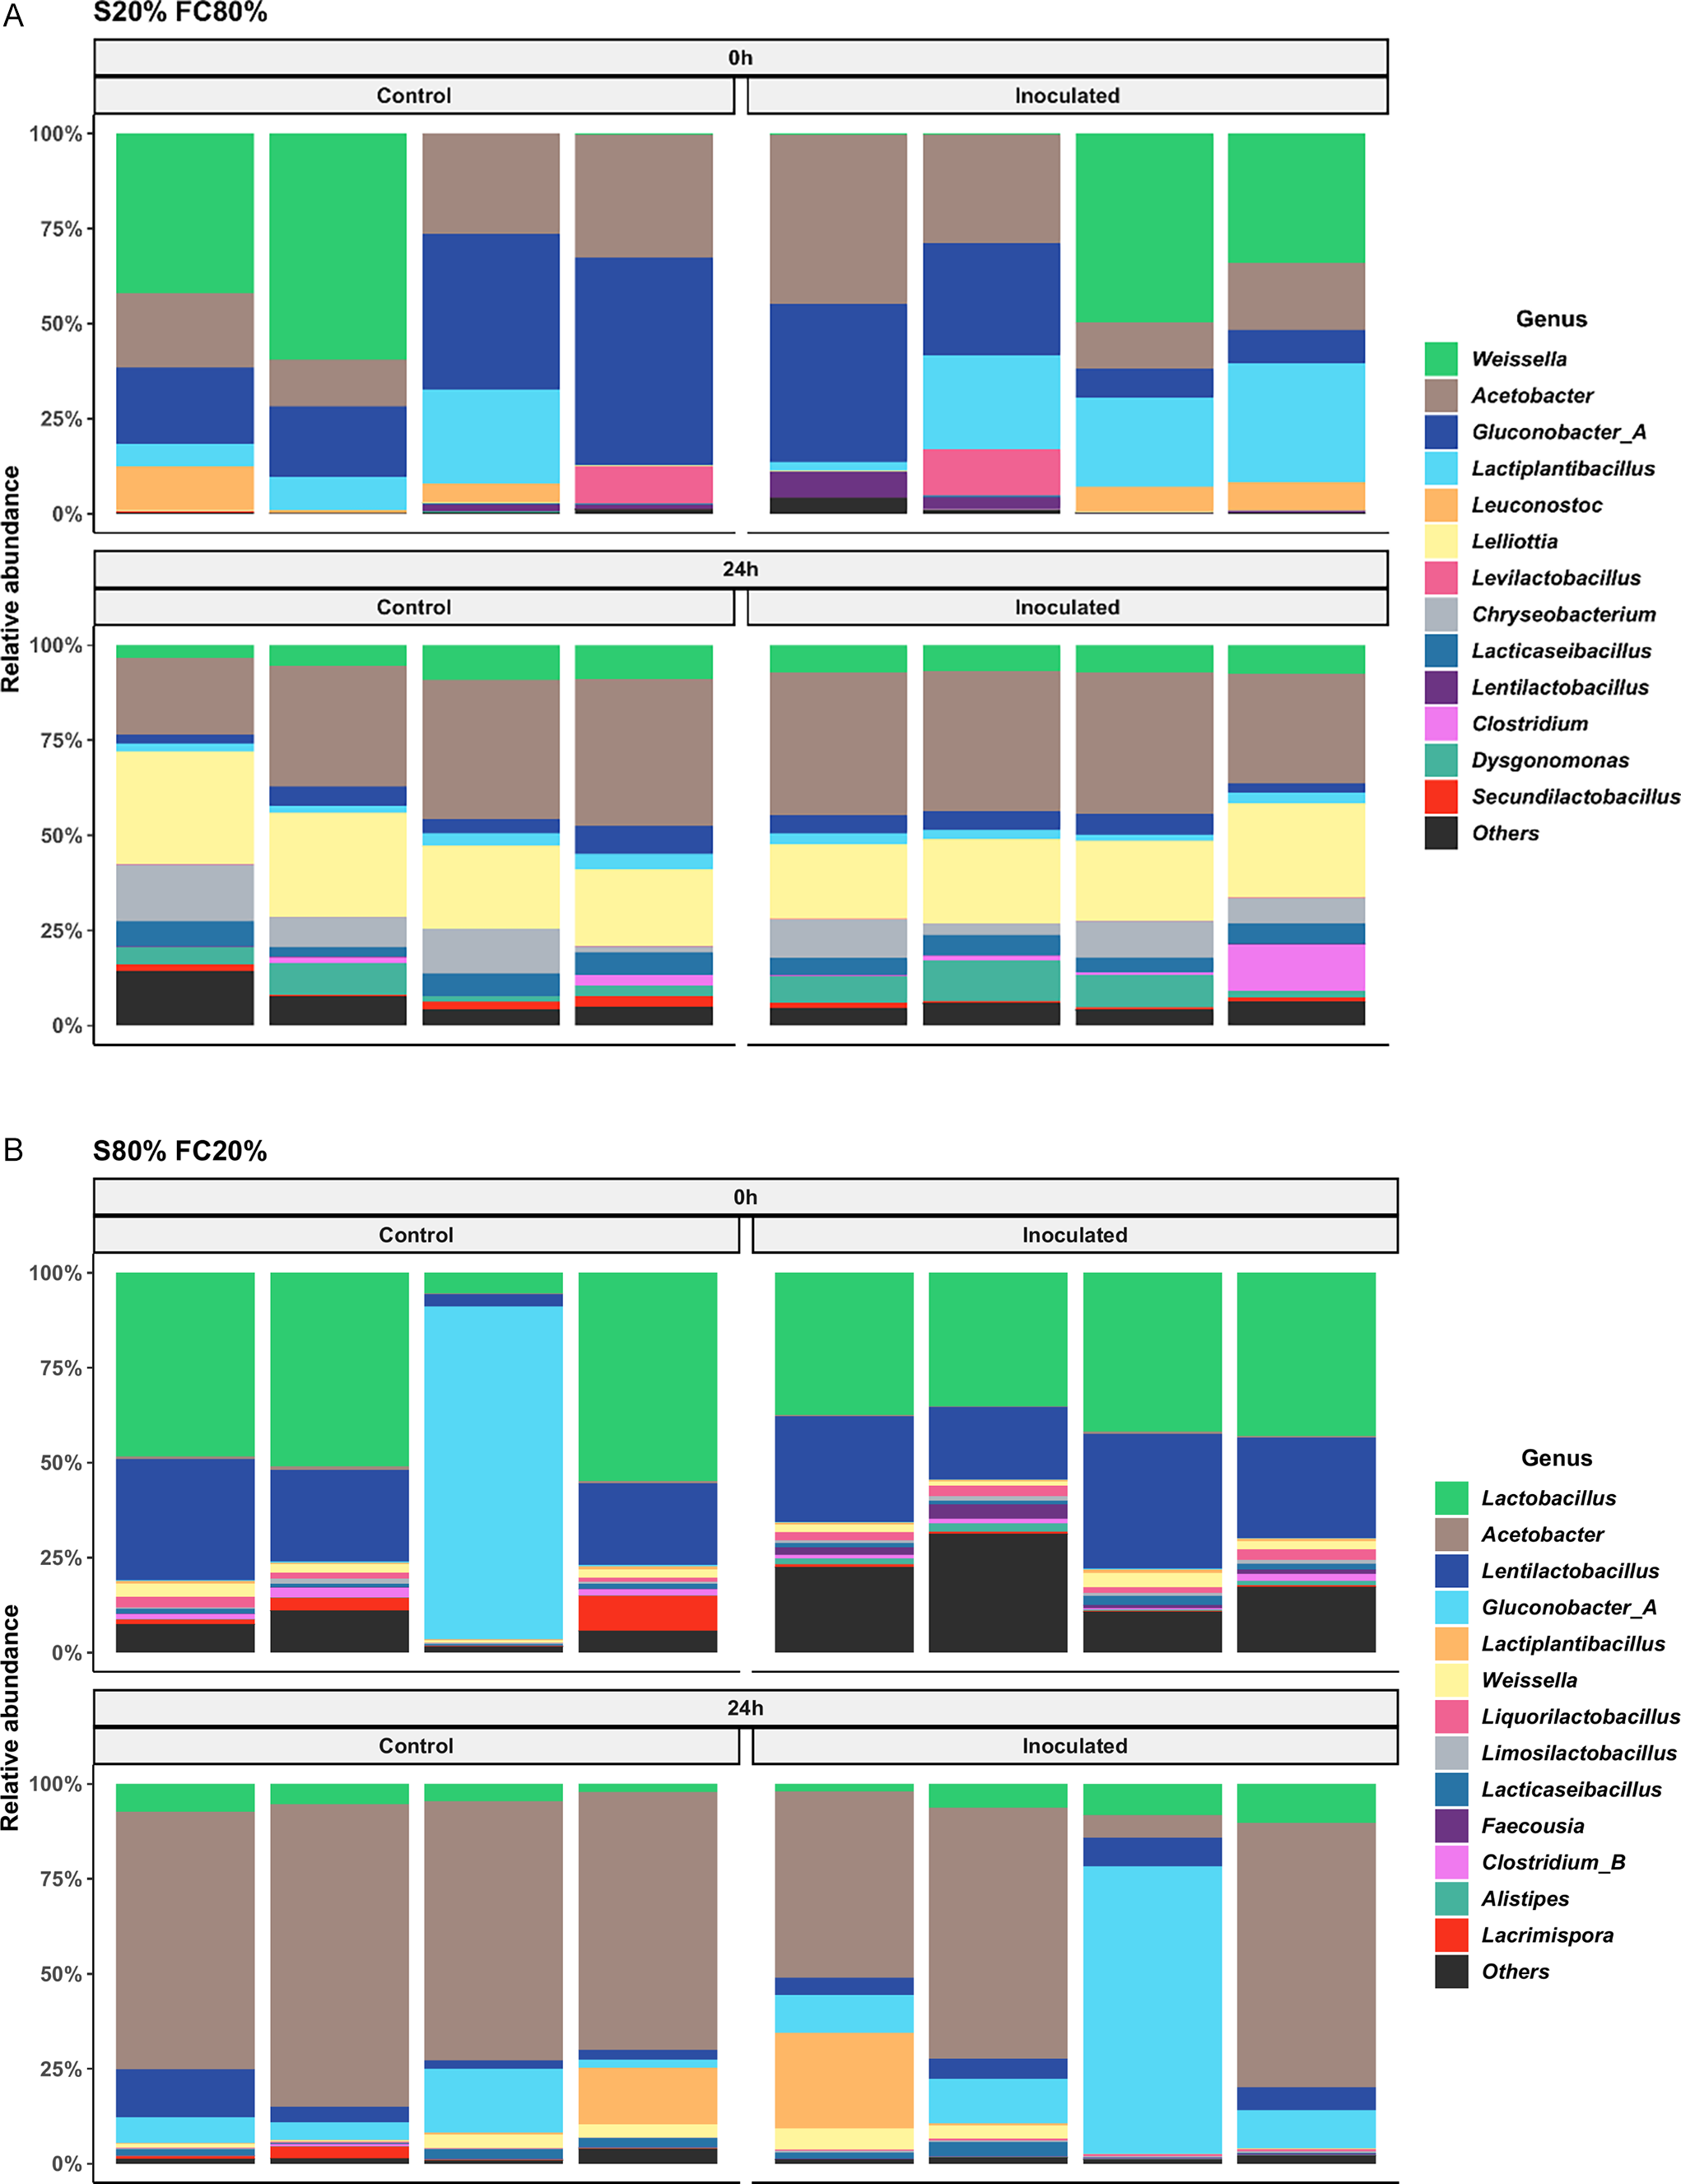
The main bacterial genera identified in the relative abundance analysis in 80 % FC were Weissella, Acetobacter, Gluconobacter_A, Lactiplantibacillus, Leuconostoc, Lelliottia, Levilactobacillus, Chryseobacterium, Lacticaseibacillus, Lentilactobacillus, Clostridium, Dysgonomonas and Secundilactobacillus (Figure 8A). The main genera identified in 20 % FC were Lactobacillus, Acetobacter, Lentilactobacillus, Gluconobacter_A, Lactiplantibacillus, Weissella, Liquorilactobacillus, Limosilactobacillus, Lacticaseibacillus, Faecousia, Clostridium_B, Alistipes and Lacrimispora were the main genera identified in 20 % FC (Figure 8B). The 0-h period was marked by the predominance of Weissella, Acetobacter, Gluconobacter_A and Lactiplantibacillus in 80 % FC (Figure 8A), as well as Lactobacillus and Lentilactobacillus in 20 % FC (Figure 8B). The 24-h period was marked by the dominance of non-lactic communities, such as Acetobacter and Lelliottia in 80 % FC (Figure 8A), as well as Acetobacter and Gluconobacter_A in 20 % FC (Figure 8B).
Relative abundance of the 13 most abundant bacterial genera in 80 (Figure 8A) and 20 % (Figure 8B) forage cactus (FC) mixtures at 0 and 24 h of exposure, with or without goat faecal contamination.

Discussion
The mixture with 80 % FC showed a lower DM content, as reflected by the lower moisture content of sorghum silage compared with FC. In the mixture with 80 % FC, with contamination, a reduction in DM content was observed over the T due to the more humid environment and greater presence of fermentable substrate. These factors favour the growth of microorganisms, especially enterobacteria, which use nutrients as an energy source, and reduce the mass DM (Nascimento et al., Reference Nascimento, Carvalho, Freitas Júnior and Souza2016). In addition, sorghum silage has a greater DM content than FC: 280–350 g/kg and 70–179 g/kg DM, respectively (Batista et al., Reference Batista2013; Pereira et al., Reference Pereira, Santos, Oliveira, Santos, Lopes, Santos, Corrêa, Justino, Leite, Gomes, Cruz and Torres Júnior2021).
Similar results were reported by Santos et al. (Reference Santos, Araújo, Santos, de, Lambais, Lambais, Nagahama, Zanine, Santos, Soares, Sobral, Justino, Lemos and de Oliveira2022), who evaluated mixtures of FC and buffel grass hay (20, 60, 80, 90 and 100 %) exposed to air for 0, 3, 6, 12 and 24 h. At the 80 % FC level, the DM content decreased from 280.7 g/kg initially to 226.9 g/kg after 24 h. This pattern aligns with the observations of Driehuis et al. (Reference Driehuis, Wilkinson, Jiang, Ogunade and Adesogan2018), who emphasized that the intrinsic composition of ensiled materials, particularly wet ones, is the primary factor in DM reduction during T.
The FC has high ash values, reaching concentrations up to 25.8 g/kg DM (Santos et al., Reference Santos, Araújo, Santos, de, Lambais, Lambais, Nagahama, Zanine, Santos, Soares, Sobral, Justino, Lemos and de Oliveira2022). As expected, a greater ash content was observed in the 80 % FC level. Ash increased as a function of the T owing to the consumption of soluble components, such as CP and WSCs. This increased the mineral content as the T progressed. Regarding EE, the observed variation is due to reduced WSCs content and increased WSCs consumption (Nascimento et al., Reference Nascimento, Carvalho, Freitas Júnior and Souza2016).
The WSCs decreased with the level of FC and the length of the T of the mixture. These carbohydrates decrease with increased exposure to air because they are rapidly consumed by microbiota (Macêdo et al., Reference Macêdo, Santos, de Edvan, de Perazzo, Sá WCCdos and Pereira2018; Pinho et al., Reference Pinho, Santos, De Oliveira, De Carvalho, Alves, da Macêdo A.J., Pereira, Pereira, Perazzo and Zanine2019).
Exposure of this material to the environment promotes the growth of microorganisms that use these substrates, and hence, the reduction, both at high and low levels of FC. The FC is rich in WSCs, pectic polysaccharides, which are esterified sugars with a high concentration of galactose, arabinose, xylose and fructose (Paulino et al., Reference Paulino, de Oliveira, Santos, Pereira, de Farias Ramos, César Neto, de Lima Cruz, Leite, Satake, da Silva and de Oliveira2021; Oliveira et al., Reference Oliveira, Mantovani, Rodrigues, Ferreira and Santos2025; Santos et al., Reference Santos, Araújo, Santos, de, Lambais, Lambais, Nagahama, Zanine, Santos, Soares, Sobral, Justino, Lemos and de Oliveira2022; Vieira et al., Reference Vieira, Oliveira, Santos, Santos, Pinto, Zanine, Coelho, Sobral, Leite, Soares, Santos, Santos, Viana, Júnior and Gomes2022). These sugars are rapidly consumed when exposed to air (Brito et al., Reference Brito, Santos, de Araújo, de Oliveira, de Zanine, Perazzo, Campos, de Oliveira Lima and Cavalcanti2020). The increase in CP in the mixture of FC and sorghum silage with increasing T was primarily due to microbial activity. During exposure to oxygen, WSCs levels decrease because WSCs are rapidly consumed by microbiota. This consumption of sugars leads to a relative increase in CP since the microorganisms use available energy substrates compounds (McDonald et al., Reference McDonald, Henderson and Heron1991). In some cases, they can also contribute to the synthesis of nitrogen compounds (McDonald et al., Reference McDonald, Henderson and Heron1991).
Ammonia levels increased, being greater in the 80 % FC, as evidenced by the greater microbial activity in the greater level of FC. However, a reduction was observed over time, which may be linked to the fact that ammonia is expressed in relation to total nitrogen. Neutral detergent fibre and ADF had small variations between forage cactus inclusion levels. According to Nascimento et al. (Reference Nascimento, Carvalho, Freitas Júnior and Souza2016), these variations were directly associated with greater WSCs consumption.
As expected, a greater proportion of sorghum silage maintained a lower pH over time, with an average value of 3.48. Sorghum silages tend to have a lower pH. Pinho et al. (Reference Pinho, Santos, Oliveira, Bezerra, Freitas, Perazzo and Silva2015) reported this in a study evaluating the fermentation profile, losses and chemical composition of silages from five sorghum cultivars. They verified a variation in pH from 3.0 to 3.4 in the silages of different cultivars.
Some studies have shown that gram-negative bacteria, including E. coli, are inhibited at low pH levels. In short, studies have revealed that enterobacteria cannot tolerate pH levels below 4.5 and are more sensitive to acidity caused by lactic acid (Pedroso et al., Reference Pedroso, Adesogan, Queiroz and Williams2010; Ogunade et al., Reference Ogunade, Jiang, Kim, Cervantes, Arriola, Vyas, Weinberg, Jeong and Adesogan2017; Queiroz et al., Reference Queiroz, Ogunade, Weinberg and Adesogan2018).
Ogunade et al. (Reference Ogunade, Jiang, Kim, Cervantes, Arriola, Vyas, Weinberg, Jeong and Adesogan2017) examined corn silage contaminated with E. coli 157:H7 and inoculated it with different microbial inoculants. They found that a pH range of 4.2–4.0 inhibited the growth of these pathogens and ensured aerobic stability for 168 h after the silo was opened. The authors also observed that pH values above 5.0 favoured the presence of E. coli. These results may be associated with the disruption of the electrochemical gradients of these microorganisms (Pedroso et al., Reference Pedroso, Adesogan, Queiroz and Williams2010). The presence of enterobacteria, particularly E. coli, was favoured by the high pH of the FC mixture throughout the T.
The production of lactic acid is essential for the pH reduction process during fermentation. However, very low pH values below 3.5 create a favourable environment for microorganisms such as yeasts, which consume the available substrates and the lactic acid produced by lactic acid bacteria (LAB) (Muck, Reference Muck2010; Coblentz et al., Reference Coblentz, Coffey and Chow2016). In the present study, the lowest lactic acid concentration was observed in the 80 % FC treatment. This result may be attributed to the lower content of lactic acid in FC compared to sorghum silage, as greater lactic acid values were found in the 20 % FC treatment. In other words, the reduced lactic acid levels are likely due to competition between silage LAB and the plant’s epiphytic microbiota. Furthermore, the results of this study indicate a high relative abundance of acetic acid bacteria, particularly in the highest level of sorghum silage. These bacteria likely utilized ethanol produced by yeasts, which is supported by the lower pH values observed in the treatments with the lowest FC levels.
Butyric acid was present at greater concentrations in the highest level of FC. However, the concentrations decreased within 12 h and returned to low levels after 24 h of T. This reduction may be because Clostridia are strict anaerobic organisms (Goldsztejn et al., Reference Goldsztejn, Grenda, Kozieł, Sapała, Mazur, Sieradzki, Król and Kwiatek2020). However, the resumption of growth within 24 h may be associated with the presence of FC mucilage, which provides a more anaerobic environment, especially in the 80 % FC treatment (Vieira et al., Reference Vieira, Oliveira, Santos, Santos, Pinto, Zanine, Coelho, Sobral, Leite, Soares, Santos, Santos, Viana, Júnior and Gomes2022). Furthermore, microbial competition is low in the absence of contamination (Coblentz et al., Reference Coblentz, Coffey and Chow2016).
The concentration of acetic acid in the mixture containing 80 % FC and 20 % forage sorghum showed an initial decline followed by a subsequent increase. This dynamic can be attributed to the activity of acetic acid bacteria, which are ubiquitous aerobic microorganisms that thrive in environments such as fermented products (Brito et al., Reference Brito, Santos, de Araújo, de Oliveira, de Zanine, Perazzo, Campos, de Oliveira Lima and Cavalcanti2020). The production of acetic acid by these bacteria occurs through a metabolic pathway that uses ethanol as a substrate (Sengun and Karabiyikli, Reference Sengun and Karabiyikli2011). Initially, ethanol, a product of yeast fermentation, is oxidized to acetaldehyde and subsequently to acetic acid (Sengun and Karabiyikli, Reference Sengun and Karabiyikli2011). The observed dynamic in the silage (decline and later increase of acetic acid) suggests a shift in microbial dominance (Santos et al., Reference Santos, Araújo, Santos, de, Lambais, Lambais, Nagahama, Zanine, Santos, Soares, Sobral, Justino, Lemos and de Oliveira2022). The initial decrease in acetic acid may have resulted from its consumption through alternative metabolic pathways or from volatilization (Vieira et al., Reference Vieira, Oliveira, Santos, Santos, Pinto, Zanine, Coelho, Sobral, Leite, Soares, Santos, Santos, Viana, Júnior and Gomes2022). However, with oxygen ingress during aerobic exposure, acetic acid bacteria are reactivated, oxidizing the residual ethanol to acetic acid and thereby increasing its concentration, a process that is also fundamental in vinegar production (Sengun and Karabiyikli, Reference Sengun and Karabiyikli2011). The high moisture content and elevated yeast counts in the mixture with a greater proportion of forage cactus may have favoured ethanol production, which in turn served as a substrate for the proliferation of acetic acid bacteria and consequently for the increased production of acetic acid (Sengun and Karabiyikli, Reference Sengun and Karabiyikli2011). Sorghum silage contains high concentrations of acetic acid, as evidenced by the analysis of the bacterial community, which showed a high relative abundance of acetic acid-producing bacteria (Lucena et al., Reference Lucena, Santos, Perazzo, de Oliveira, Macêdo, Pereira and Nogueira2023).
The richness and evenness of the mixtures with a greater proportion of FC at 0 h of exposure were lower for all indices (Observed, Shannon, Simpson, Pielou and Falth). However, at 24 h, all indices were high with no contamination-related effects. This result was expected because of the significant growth of undesirable microorganisms in the 80 % FC mixture (Rodrigues et al., Reference Rodrigues, Pinedo, Meyer, da Silva and da Guimarães2020). The analysis revealed that the proportion of FC directly influenced the growth of potentially pathogenic microorganisms. After 24 h, the samples with 80 % FC were more susceptible to aerobic exposure. Genera belonging to the family Enterobacteriaceae were detected, which are frequently associated with enterotoxins, diarrhoea and zoonotic risks, potentially compromising both feed quality and animal health (Santos et al., Reference Santos, Araújo, Santos, de, Lambais, Lambais, Nagahama, Zanine, Santos, Soares, Sobral, Justino, Lemos and de Oliveira2022; Vieira et al., Reference Vieira, Oliveira, Santos, Santos, Pinto, Zanine, Coelho, Sobral, Leite, Soares, Santos, Santos, Viana, Júnior and Gomes2022).
At the phylum level, a significant presence of the phylum Pseudomonadota, which comprises Gram-negative bacteria, was observed in 80 % FC. Our results differ from those of Santos et al. (Reference Santos, Araújo, Santos, de, Lambais, Lambais, Nagahama, Zanine, Santos, Soares, Sobral, Justino, Lemos and de Oliveira2022), who found a greater presence of the phylum Firmicutes in greater levels of FC at 24 h. In our study and the aforementioned study, the highest levels of FC exhibited the presence of Bacteroidota and Pseudomonadota within 24 h. This indicates that after 24 h, the material is susceptible to aerobic deterioration, possibly owing to the high NFC and moisture content. The greater prevalence of Pseudomonadota in various animal feed materials may indicate an increased presence of certain enterobacteria, including E. coli, K. pneumoniae and Pseudomonas aeruginosa (Wu et al., Reference Wu, Wang, Du, Li, Dong, Hu, Meng, Zheng and Wang2022).
At the phylum level, mixtures with 20 % FC showed a high presence of Bacillota originating from the silage itself at 0 h, as Hu et al. (Reference Hu, Pan, Zhao, Yin, Wang, Sun, Yu, Bai and Xue2024) explained. In addition to being important for silage, Bacillota is capable of producing extracellular enzymes, including proteases, lipases and cellulases, at the rumen level (Nascimento et al., Reference Nascimento, Carvalho, Freitas Júnior and Souza2016). These enzymes assist with the hydrolysis of proteins, lipids, amino acids and hemicellulose. These results support the use of silage as a probiotic for animals (La et al., Reference La, Li, Zhang, Abaidullah, Niu, Gao, Liu, Ma, Cui, Li and Shi2024).
At the family level, lactic and acetic bacteria were observed in 80 % FC at 0 h. After 24 h of aerobic exposure, the environment became more diverse with groups such as Enterobacteriaceae and Clostridiaceae present. Enterobacteriaceae can compete with LAB, which is undesirable, even in aerobic environments (Muck, Reference Muck2010). The presence of Clostridiaceae indicates the presence of Clostridia in the mixture, which can be explained by the increased level of butyric acid present after 24 h in 80 % FC (Goldsztejn et al., Reference Goldsztejn, Grenda, Kozieł, Sapała, Mazur, Sieradzki, Król and Kwiatek2020). Enterobacteriaceae thrive under anaerobic and weakly acidic conditions and are observed after 24 h of aerobic exposure in 80 % FC (Ni et al., Reference Ni, Wang, Zhu, Yang, Zhou, Pan, Tao and Zhong2017; Ávila and Carvalho, Reference Ávila and Carvalho2020; Xu et al., Reference Xu, Sun, Na, Wang, Yin, Liu and Xue2021). In the 20 % FC, a marked presence of acetic bacteria was observed after 24 h, which was the result of ethanol oxidation (Sengun and Karabiyikli, Reference Sengun and Karabiyikli2011; Santos et al., Reference Santos, Araújo, Santos, de, Lambais, Lambais, Nagahama, Zanine, Santos, Soares, Sobral, Justino, Lemos and de Oliveira2022). The presence of LAB was verified.
Weissella was the predominant genus observed in 80 % FC at 0 h of T. This genus is associated with FC, as reported by Santos et al. (Reference Santos, Araújo, Santos, de, Lambais, Lambais, Nagahama, Zanine, Santos, Soares, Sobral, Justino, Lemos and de Oliveira2022). In 20 % FC, Lactobacillus was present at 0 hours and decreased at 24 h, whereas the abundance of acetic bacteria, such as Acetobacter and Gluconobacter, increased. These bacteria are derived from the oxidation of ethanol in the presence of oxygen, without compromising the quality of the material (Sengun and Karabiyikli, Reference Sengun and Karabiyikli2011). In addition, Lactiplantibacillus originated from sorghum silage (Sengun and Karabiyikli, Reference Sengun and Karabiyikli2011).
The genus Clostridium was present in 80 % FC treatments after 24 h of exposure. This finding correlates with the greater levels of butyric acid in the largest amount of FC after 24 h of aerobic exposure. Butyric acid is detrimental to silage quality because of nutritional losses during fermentation and after silo opening (Coblentz et al., Reference Coblentz, Coffey and Chow2016). The presence of Clostridium in 80 % FC after 24 h of exposure should not be neglected because, in analyses of relative abundance, it is highly representative of contamination (Coblentz et al., Reference Coblentz, Coffey and Chow2016). For example, Clostridium encompasses Clostridium botulinum, a heterogeneous group of bacteria that produces botulinum neurotoxin, an agent that causes botulism (Driehuis et al., Reference Driehuis, Wilkinson, Jiang, Ogunade and Adesogan2018). Interestingly, sorghum silage suppressed the presence of Clostridium in the 20 % FC treatment after 24 h of aerobic exposure, which reinforces the use of silage in mixtures with FC. Furthermore, the greater abundance of Clostridium in the treatment with 80 % FC also reinforces the risk of spoilage, since this group includes species that produce toxins and undesirable metabolites, such as butyrate and ammonia (Wu et al., Reference Wu, Wang, Du, Li, Dong, Hu, Meng, Zheng and Wang2022).
Lelliottia was also observed in 80 % FC, which may play a role similar to that of Enterobacter in silage. This genus is closely related to greater pH and is strictly related to the pH of the mixture with more FC as the exposure period advances, reaching values above 6 and providing a favourable environment for the growth of undesirable groups (Coblentz et al., Reference Coblentz, Coffey and Chow2016; Driehuis et al., Reference Driehuis, Wilkinson, Jiang, Ogunade and Adesogan2018; Xu et al., Reference Xu, Sun, Na, Wang, Yin, Liu and Xue2021; Tian et al., Reference Tian, Huang, Tian, Wu, Tang and Zhang2023).
The main genera already described were closely related to the highest ammonia values found in the highest level of FC. Proteolytic groups such as enterobacteria (Coblentz et al., Reference Coblentz, Coffey and Chow2016; La et al., Reference La, Li, Zhang, Abaidullah, Niu, Gao, Liu, Ma, Cui, Li and Shi2024) should be noted.
This study emphasizes the importance of using sorghum silage mixed with FC. Sorghum silage is safer from the point of view of reducing and controlling undesirable or pathogenic microorganisms in the mixture. However, when using FC in mixtures, it is important to implement strategies that minimize the risks associated with faecal contamination and prolonged exposure to air. Balanced proportions of sorghum silage contribute to the stability and nutritional quality of mixtures fed to ruminants. Additionally, sorghum silage modulated the microbiota of the mixture based on the predominance of beneficial groups. This does not negate the importance of strict hygiene practices in handling these feeds. Furthermore, this study emphasizes the importance of removing feed from the feeding troughs within 24 h.
It is noteworthy that, although the completely randomized experimental design in a factorial arrangement adopted in this study allowed the evaluation of the main effects (forage cactus, faecal contamination and aerobic exposure times) and their interactions, there are inherent limitations to this approach. In a purely factorial model, experimental units are independent for each sampling time, which may mask intrinsic variations associated with the individual fermentative process of each experimental silo. Future investigations could benefit from the application of a repeated measures design over time, using sequential sampling within the same experimental unit. Such an approach would provide a more accurate analysis of degradation kinetics and aerobic stability, reducing experimental error associated with between-silo variation and more reliably capturing the temporal evolution of fermentative parameters within the same environment over time.
Conclusion
A mixture of 20 % forage cactus and 80 % sorghum silage, combined with strict hygiene practices and reduced aerobic exposure time, is recommended to preserve the microbiological and nutritional qualities of the mixture.
Supplementary material
The supplementary material for this article can be found at https://doi.org/10.1017/S0021859626100689.
Acknowledgements
We are grateful to the Coordenação de Aperfeiçoamento de Pessoal de Nível Superior (CAPES), Conselho Nacional de Desenvolvimento Científico e Tecnológico (CNPq) and the Fundação de Apoio à Pesquisa do Estado da Paraíba (FAPESQ; grant #032/2023).
Author contributions
Evandro de Sousa da Silva: Data curation, Conceptualization, Methodology, Writing, Conceptualization, Methodology; Alberto Jefferson da Silva Macêdo: Methodology, Formal analysis, Investigation; Juliana Silva de Oliveira: Conceptualization, Methodology, Supervision, Project administration, Funding acquisition, Writing – review & editing; Guilherme Medeiros Leite: Methodology, Formal analysis, Investigation; Paloma Gabriela Batista Gomes: Methodology, Formal analysis, Investigation; Gilvânia Avelino da Costa: Methodology, Formal analysis, Investigation; Ricardo Loiola Edvan: Conceptualization, Methodology, Formal analysis, Investigation; Geovergue Rodrigues de Medeiros: Conceptualization, Methodology, Formal analysis, Investigation; Luís Fernando Batista Pinto: Conceptualization, Methodology, Formal analysis, Investigation; Chrislanne Barreira de Macêdo Carvalho: Methodology, Formal analysis, Investigation; Mateus Lacerda Pereira Lemos: Conceptualization, Methodology, Formal analysis, Investigation; Edson Mauro Santos: Conceptualization, Methodology, Supervision, Project administration, Funding acquisition, Writing – review & editing.
Funding statement
The research was supported by Fundação de Apoio à Pesquisa do Estado da Paraíba (FAPESQ; grant #032/2023) and the Conselho Nacional de Desenvolvimento Científico e Tecnológico (Process CNPq/grant #304732/2021-4).
Competing interests
The authors declare that they have no known competing financial interests or personal relationships that could have appeared to influence the work reported in this paper.
Ethical standards
Not applicable.