Introduction
The Neoproterozoic Era was marked by fluctuations in oceanic and atmospheric chemistry (Meyer and Kump, Reference Meyer and Kump2008; Canfield, Reference Canfield2014), dynamic shifts in climate (Pierrehumbert et al., Reference Pierrehumbert, Abbot, Voigt and Koll2011) and carbon cycling (e.g., Rothman et al., Reference Rothman, Hayes and Summons2003; Swanson-Hysell et al., Reference Swanson-Hysell, Rose, Calmet, Halverson, Hurtgen and Maloof2010), formation and rifting of the supercontinent Rodinia (Li et al., Reference Li2008), and major biological innovations such as the advent of biomineralization and multicellularity (reviewed in Javaux, Reference Javaux2011; Knoll, Reference Knoll2011). Molecular clock analyses suggest divergences of major eukaryotic clades occurred in the middle Mesoproterozoic to early Neoproterozoic (Berney and Pawlowski, Reference Berney and Pawlowski2006; Zimmer et al., Reference Zimmer, Lang, Richardt, Frank, Reski and Rensing2007; Lücking et al., Reference Lücking, Huhndorf, Pfister, Plata and Lumbsch2009; Parfrey et al., Reference Parfrey, Lahr, Knoll and Katz2011), and compilations of fossil data (Huntley et al., Reference Huntley, Xiao and Kowalewski2006; Knoll et al., Reference Knoll, Javaux, Hewitt and Cohen2006; Cohen and Macdonald, Reference Cohen and Macdonald2015) indicate that eukaryotic diversity and disparity increased steadily during this time, preceding the dramatic drop and biotic turnover that appears to have foreshadowed the Cryogenian snowball Earth glaciations (Riedman et al., Reference Riedman, Porter, Halverson, Hurtgen and Junium2014).
These eukaryotic diversity trends are based largely upon the fossil record of the acritarchs, a polyphyletic group of spheroidal organic-walled microfossils that compose the bulk of the Precambrian fossil record. As a group, acritarchs are prone to taxonomic problems such as inflation (multiple names given to ontogenetic or taphonomic variants of a single biological taxon) or deflation (a lack of differentiation between similar, often simple, forms). Such taxonomic difficulties lead to uncertainty in the interpretations of eukaryotic diversity trends based upon this record. Early and middle Neoproterozoic acritarchs seem particularly prone to these taxonomic issues, often appearing to lack diagnostic morphological features.
Traditionally, organic-walled microfossils have been studied mainly by use of transmitted light microscopy. A number of studies of Proterozoic acritarchs (e.g., Vidal, Reference Vidal1976, Reference Vidal1979; Butterfield et al., Reference Butterfield, Knoll and Swett1994; Arouri et al., Reference Arouri, Greenwood and Walter1999; Javaux et al., Reference Javaux, Knoll and Walter2003; Moczydłowska and Willman, Reference Moczydłowska and Willman2009; Peng et al., Reference Peng, Bao and Yuan2009; Pang et al., Reference Pang, Tang, Schiffbauer, Yao, Yuan, Wan, Chen, Ou and Xiao2013; Tang et al., Reference Tang, Pang, Xiao, Yuan, Ou and Wan.2013; Agić et al., Reference Agić, Moczydłowska and Yin2015) have utilized other techniques such as scanning and transmission electron microscopy (SEM and TEM) to gather morphological and ultrastructural information, and during the course of this study the taxonomic importance of characterizing micron-scale fossil morphology by SEM quickly became apparent. A number of taxa were found to have micro- and nano-scale morphological details that would have gone undetected by transmitted light. Those specimens (e.g., Culcitulisphaera revelata n. gen. n. sp. and Lanulatisphaera laufeldii [= Trachysphaeridium laufeldii] [Vidal, Reference Vidal1976] Porter and Riedman, Reference Porter and Riedman2016, p. 827) might have been counted within form taxa such as Leiosphaeridia or mistakenly split into several separate taxa based on taphonomic alteration. Thus, it appears that early to middle Neoproterozoic acritarchs do, in fact, possess taxonomically important morphological details, but they are manifest on a smaller scale than seen in many younger forms. This offers hope that acritarch taxonomic difficulties can be ameliorated, although perhaps not eliminated, leading to more robust assessments of Precambrian eukaryotic diversity trends.
An additional benefit to the increased use of SEM in acritarch studies is the opportunity to characterize taphonomic sequences of these taxa. This not only allowed poorly preserved specimens to be assigned to their proper taxonomic groups but also provided additional information about the structure of the vesicle walls (e.g., remarks in C. revelata).
Here we present a systematic description of the organic-walled microfossils of the upper Alinya Formation, an early to middle Neoproterozoic siliciclastic unit from eastern Officer Basin, Australia. This fossil assemblage includes common and long-ranging taxa such as Valeria lophostriata Jankauskas, (Reference Jankauskas1979) Reference Jankauskas1982, taxa such as C. revelata that are known from just a few other units, and new taxa for which additional occurrences are equivocal. The Alinya assemblage provides a glimpse of a diverse ecosystem inhabiting a low-latitude (Pisarevsky et al., Reference Pisarevsky, Li, Grey and Stevens2001, Reference Pisarevsky, Wingate, Stevens and Haines2007), shallow intertidal marine environment during the early to middle Neoproterozoic Era.
Geological setting and age
The Officer Basin (Fig. 1) spans more than 3.5×10⁵ km2 in the states of Western and South Australia and contains ~7 km of Proterozoic sedimentary rocks partially overlain by ~1 km of Phanerozoic deposits including the modern Gibson and Great Victoria Deserts (Grey, Reference Grey2005). The Officer Basin composes the southwestern portions of a large depositional system known as the Centralian Superbasin (Walter et al., Reference Walter, Veevers, Calver and Grey1995), sedimentation within which initiated in the early Neoproterozoic Era during intracratonic subsidence, perhaps related to rifting associated with break-up of Rodinia (Lindsay and Leven, Reference Lindsay and Leven1996). The late Neoproterozoic to early Cambrian Petermann Orogeny and Paleozoic Alice Springs Orogeny led to fragmentation of the Centralian Superbasin into the present-day Officer, Amadeus, Ngalia, and Georgina basins (Walter et al., Reference Walter, Veevers, Calver and Grey1995).
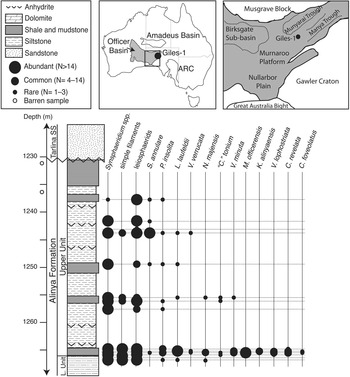
Maps and stratigraphic column of Alinya Formation from Giles 1 drill core and fossil occurrences by sample depth. National map at center top; black box is map of eastern Officer Basin, expanded at right. Amadeus Basin is seen to the north and Adelaide Rift Complex (ARC) to the east (Modified from Zang, Reference Zang1995; Gravestock, Reference Gravestock1997).
The Alinya Formation is a predominantly fine-grained siliciclastic unit that prior to the drilling of the Giles 1 wildcat petroleum well in 1985 was known only from sporadic and deeply weathered outcrops along the northeastern margins of Officer Basin (Zang and McKirdy, Reference Zang and McKirdy1994). Seismic interpretations suggest the Alinya Formation is 230 m thick in the northern reaches of the basin, thins to ~57 m in the area of Giles 1, and may extend into the Nullarbor Plain to the south (Morton, Reference Morton1997). Together with the underlying Pindyin Sandstone and locally overlying Coominaree Dolomite and Cadlareena Volcanics, the Alinya Formation is considered an equivalent of the Callanna Group of the Adelaide Rift Complex and Stuart Shelf (Morton, Reference Morton1997).
The Pindyin Sandstone fines upward from a pebble conglomerate with trough cross bedding and large-scale, low-angle cross bedding indicative of a fluvial setting to finer sands with herringbone cross bedding suggestive of transgression into a peritidal environment (Zang, Reference Zang1995; Lindsay and Leven, Reference Lindsay and Leven1996; Morton, Reference Morton1997). Zang (Reference Zang1995) divided the Alinya Formation into two units, the lower of which is characterized by red-brown to pale green siltstones with sandstone interbeds and common anhydrite, and the upper unit (from which the samples discussed here were collected) comprises stacked cycles of organic-rich siltstones grading into black shales and siltstones with interbedded evaporite deposits and terminating in aeolian sandstones. The upper unit of the Alinya Formation is interpreted to have been deposited in a shallow subtidal to repeatedly inundated coastal sabkha setting (Zang, Reference Zang1995; Morton, Reference Morton1997). Zang (Reference Zang1995) also described an assemblage of acritarchs from the Alinya Formation; comparisons with that study are discussed in the following.
Samples of the Alinya Formation were collected from the Giles 1 drill core, currently housed in the Glenside Core Facility, Adelaide. Giles 1 was drilled by Comalco Ltd. as a wildcat exploratory petroleum well in eastern Officer Basin (Fig. 1), South Australia (28°25'54"S, 132°23'12"E) and reached a total depth of 1,326.8 meters, terminating in the Tonian (Grey et al., Reference Grey, Hill and Calver2011) aeolian Pindyin Sandstone. In the Giles 1 drill core, the Alinya Formation conformably overlies the Pindyin Sandstone and is, in turn, unconformably overlain by the Ediacaran Tarlina Sandstone; no Cryogenian glacial units are preserved.
Age constraints
There are no direct age constraints on the Alinya Formation. Deposition preceded the onset of the Cryogenian glaciations (ca. 716.5 Ma; Macdonald et al., Reference Macdonald, Schmitz, Crowley, Roots, Jones, Maloof, Strauss, Cohen, Johnston and Schrag2010a), and although absent from the Giles 1 drill core, the Sturtian Chambers Bluff Tillite is found higher in the sequence elsewhere in eastern Officer Basin. Debris of the late Neoproterozoic Acraman bolide impact (Hill et al., Reference Hill, Grey, Gostin and Webster2004) and distinctive Ediacaran acritarch taxa (Willman and Moczydłowska, Reference Willman and Moczydłowska2008) are found in the Ungoolya Group stratigraphically above the Alinya Formation within the Giles 1 drill core, providing additional, if broad, minimum age constraints.
According to lithological correlations, the upper unit of the Alinya Formation is considered a lateral facies equivalent of the Coominaree Dolomite, a unit restricted to the Manya Trough in the eastern part of Officer Basin (Fig. 1) and to the western portions of the Adelaide Rift Complex (Morton, Reference Morton1997; Hill, Reference Hill2005). Rocks from the Coominaree Dolomite (Manya 5 drill core) have been correlated with those of the lower Bitter Springs Formation of the Amadeus Basin (upper Gillen Member + lower Loves Creek Member by Hill and Walter [Reference Hill and Walter2000] and with the lower two-thirds of the Loves Creek Member by Grey and colleagues [Reference Grey, Hill and Calver2011]) according to carbon and strontium isotopes and stromatolite biostratigraphy (Acaciella australica assemblage). The Bitter Springs negative carbon isotope anomaly occurs at the boundary of the Gillen and Loves Creek members of the Bitter Springs Formation (Halverson et al., Reference Halverson, Hoffman, Schrag, Maloof and Rice2005; Swanson-Hysell et al., Reference Swanson-Hysell, Rose, Calmet, Halverson, Hurtgen and Maloof2010) and has been constrained to be no older than 811.5 Ma (Macdonald et al., Reference Macdonald, Schmitz, Crowley, Roots, Jones, Maloof, Strauss, Cohen, Johnston and Schrag2010a). Although no geochemical studies have yet sought the Bitter Springs anomaly in the Alinya Formation, correlation with the Coominaree Dolomite suggests a broad age of 811 to 716.5 Ma for the Alinya Formation.
Discussion
Comparison with previous study of the Alinya Formation
A previous study of the Alinya Formation by Zang (Reference Zang1995) revealed some of the diversity documented here. Certain forms are held in common between these works and others are not; newly discovered forms include Caelatimurus foveolatus n. gen. n. sp., Culcitulisphaera revelata n. gen. n. sp., Karenagare alinyaensis n. gen. n. sp., Morgensternia officerensis n. gen. n. sp., and Volleyballia dehlerae Porter and Riedman, 2016. Biostratigraphically significant forms reported by Zang (Reference Zang1995) but not recovered in this study include Trachyhystrichosphaera aimika Hermann, 1976 (in Timofeev et al., Reference Timofeev, Hermann and Mikhailova1976) emended by Butterfield et al., Reference Butterfield, Knoll and Swett1994, T. stricta Hermann, 1989 (in Jankauskas et al., Reference Jankauskas, Mikhailova and Hermann1989), T. vidalii Knoll, Reference Knoll1984 , Cymatiosphaeroides kullingii Knoll, Reference Knoll1984, and Vandalosphaeridium sp. cf. V. reticulatum (Vidal, Reference Vidal1976) as well as the vase-shaped microfossils (VSM) Melanocyrillium sp.
One of the forms recovered in both studies is ‘Comasphaeridium’ tonium, a species named by Zang (Reference Zang1995) from Alinya Formation (the generic assignment is considered dubious by the present authors and placed in quotation marks). Some authors (Willman and Moczydłowska, Reference Willman and Moczydłowska2008; Grey et al., Reference Grey, Hill and Calver2011) have expressed concern about the occurrence of this fossil in the early to middle Neoproterozoic Alinya Formation, arguing that its acanthomorphic ornamentation is more consistent with acritarchs of the Ediacaran Period. However, the specimens illustrated do not conform to any recognized Ediacaran acritarch taxa (Grey et al., Reference Grey, Hill and Calver2011), and the concern over these fossils may speak more to an unwarranted assumption that certain morphological characters—rather than monophyletic taxa—define chronostratigraphic intervals (cf. Xiao et al., Reference Xiao, Knoll, Kaufman, Yin and Zhang1997).
Zang (Reference Zang1995, p. 147) reported large acritarchs attributed to Trachyhystrichosphaera aimika with vesicle diameters from 50 to 400 µm and hollow processes up to 70 µm in length, as well as the occurrence of T. stricta (synonymized with T. aimika by Butterfield et al., Reference Butterfield, Knoll and Swett1994), which exhibits vesicle diameters up to 800 µm. No specimens attributable to the genus Trachyhystrichosphaera, or with such great dimensions, were observed during the present study. Specimens Zang (Reference Zang1995) attributed to T. vidalii (in part; fig. 23C) and T. stricta (fig. 25H–J; both synonymized with T. aimika by Butterfield et al., Reference Butterfield, Knoll and Swett1994) appear to be forms comparable to Pterospermopsimorpha sp.; the ‘processes’ appear to be folds of the outer envelope. Other specimens attributed to T. vidalii (fig. 23A, B, D, E) and some left in open nomenclature as Trachyhystrichosphaera sp. cf. T. aimika (fig. 26E–G) may bear processes but share no similarity with Trachyhystrichosphaera spp. The remainder of those left as T. sp. cf. T. aimika (fig. 26A, B) appear to be fragments of smooth-walled acritarchs overlain by filaments of Siphonophycus spp. Similarly, in contrast to Zang’s study, no specimens attributable to the genus Vandalosphaeridium were observed. Those figured by Zang (Vandalosphaeridium sp. cf. V. reticulatum; fig. 23F–H) do not conform to the specific diagnosis provided by Vidal (Reference Vidal1981) and Vidal and Ford (Reference Vidal and Ford1985), who described a vesicle bearing widely spaced, funnel-shaped processes supporting an outer membrane. Rather, they appear to be degraded leiosphaerids or portions of aggregates of small spheroidal cells.
Another fossil group recorded in Zang’s (Reference Zang1995) study that is of great potential biostratigraphic and paleoecological significance is the vase-shaped microfossil (VSM) Melanocyrillium sp. (fig. 25E, F). As a group, VSMs, allied with modern amoebozoan and, possibly, rhizarian testate amoebae (Porter and Knoll, Reference Porter and Knoll2000; Porter et al., Reference Porter, Meisterfeld and Knoll2003), are found abundantly and globally in Tonian-age (1 Ga to 720 Ma) rocks. Work by Nagy and colleagues (Reference Nagy, Porter, Dehler and Shen2009; as well as others cited therein) indicates the acritarch assemblage associated with VSMs is a taxonomically depauperate one dominated by long-ranging taxa such as small leiosphaerids. This is true not only for the Chuar Group, but for other globally distributed assemblages as well where VSMs are seen in association with simple filaments and smooth-walled acritarchs but not with ornamented or acanthomorphic acritarchs. This pattern applies to all reported occurrences of VSMS with the apparent exception of the Draken Formation of Spitsbergen (Knoll et al., Reference Knoll, Swett and Mark1991; figs. 5.4, 5.5, 7.6) where VSM casts are seen in thin section with fossils identified as Trachyhystrichosphaera vidalii (= T. aimika). It is possible that a lack of co-occurrences could be due to differences in preferred habitats, but at least in the case of the Chuar Group fossils, VSMs are seen from peritidal to distal subtidal depositional environments, habitats typical of diverse acritarch assemblages. Nagy et al. (Reference Nagy, Porter, Dehler and Shen2009) suggest the shift seen from a diverse acritarch assemblage to one dominated by smooth-walled leiosphaerids and VSMs is indicative of a major, possibly global biotic signal. Thus the discovery of VSMs in the diverse acritarch assemblage of the Alinya Formation would be noteworthy for paleoecological as well as biostratigraphic reasons. Zang (Reference Zang1995) reported recovery of three Melanocyrillium sp. specimens in association with spiny acritarchs from a chert of the lower Alinya Formation collected in outcrop at North Pindyin Hills, northeastern Officer Basin. Although it is possible that the specimens reported by Zang do represent VSMs, it seems more likely (judging from the two figured specimens) that these are torn elongate acritarchs such as Navifusa sp. No specimens of any VSM species were recovered during the present study; note, however, this study was restricted to the upper Alinya Formation of the Giles 1 drill core, and comparison of the stratigraphic position of Zang’s outcrop chert sample with depths in the Giles 1 drill core is not straightforward.
Biostratigraphy
Those taxa from the Alinya Formation that have biostratigraphic potential (i.e., they are morphologically distinctive and confidently identified in other units) include Valeria lophostriata, Culcitulisphaera revelata, Caelatimurus foveolatus, and Lanulatisphaera laufeldii. However, all but one of these taxa have long stratigraphic ranges: V. lophostriata is seen in the ca. 1.8 Ga Changcheng Group, China (Yan and Liu, Reference Yan and Liu1993), and the 770–742 Ma Chuar Group, USA (Vidal and Ford, Reference Vidal and Ford1985; Nagy et al., Reference Nagy, Porter, Dehler and Shen2009), and C. revelata occurs in the ca. 1 Ga Lakhanda Group, Siberia (Schopf, Reference Schopf1992), and the 770–742 Ma Chuar Group (Nagy et al., Reference Nagy, Porter, Dehler and Shen2009; Porter and Riedman, Reference Porter and Riedman2016). C. foveolatus is a new species described here, but was reported as a sphere with a reticulated surface from the Mesoproterozoic Roper Group of Australia (Peat et al., Reference Peat, Muir, Plumb, McKirdy and Norvick1978) and under the name Turuchanica maculata from the poorly constrained but probably Mesoproterozoic Muhos Formation of Finland (Tynni and Uutela, Reference Tynni and Uutela1984). L. laufeldii may have the shortest range as it has not been recorded in units older than the middle Neoproterozoic in age; it is seen in the Visingsö Group (Vidal, Reference Vidal1976), the Chuar and Uinta Mountain groups (Vidal and Ford, Reference Vidal and Ford1985; Nagy et al., Reference Nagy, Porter, Dehler and Shen2009; Porter and Riedman, Reference Porter and Riedman2016), and the Kildinskaya Group (Samuelsson, Reference Samuelsson1997).
Also noteworthy is the absence of certain taxa considered to be index fossils, in particular, Cerebrosphaera globosa (= C. buickii; see Sergeev and Schopf, Reference Sergeev and Schopf2010 and Porter and Riedman, Reference Porter and Riedman2016 for nomenclatural details; Hill and Walter, Reference Hill and Walter2000; Hill et al., Reference Hill, Cotter and Grey2000; Grey et al., Reference Grey, Hill and Calver2011), Trachyhystrichosphaera aimika (Butterfield et al., Reference Butterfield, Knoll and Swett1994; Samuelsson and Butterfield, Reference Samuelsson and Butterfield2001; Tang et al., Reference Tang, Pang, Xiao, Yuan, Ou and Wan.2013), and Cymatiosphaeroides kullingii (Kaufman et al., Reference Kaufman, Knoll and Awramik1992; Butterfield et al., Reference Butterfield, Knoll and Swett1994). Of these, however, T. aimika is the least useful as an index taxon as it has a very long stratigraphic range, occurring in the 811–717 Ma upper Fifteenmile Group (formerly Tindir Group; Allison and Awramik, Reference Allison and Awramik1989; Macdonald et al., Reference Macdonald, Schmitz, Crowley, Roots, Jones, Maloof, Strauss, Cohen, Johnston and Schrag2010a, Reference Macdonald, Cohen, Dudás and Schragb) as well as the >1,005 ± 4 Ma Lakhanda Group (Hermann in Timofeev et al., Reference Timofeev, Hermann and Mikhailova1976; Rainbird et al., Reference Rainbird, Stern, Khudoley, Kropachev, Heaman and Sukhorukov1998). C. kullingii also occurs in the upper Fifteenmile Group and may be present (noted as only Cymatiosphaeroides sp.) in the 900–800 Ma Miroyedikha Formation (Veis et al., Reference Veis, Petrov and Vorob’eva1998). The distinctively wrinkled ornamented acritarch C. globosa appears to have the shortest ranges of these possible index taxa; its first appearance in Australia is constrained to be ca. 800 Ma (Grey et al., Reference Grey, Hill and Calver2011), and the youngest occurrence is in the lower Chuar Group (770–742 Ma; Nagy et al., Reference Nagy, Porter, Dehler and Shen2009; Porter and Riedman, Reference Porter and Riedman2016).
The biostratigraphic use of the absence of index taxa is complicated by the potential for preservational bias. Although the absence of VSMs from the Alinya assemblage could potentially be caused by laboratory processing, the lack of C. globosa, T. aimika, and C. kullingii from the Alinya assemblage likely reflect primary absence from the biota due to either environmental or stratigraphic reasons. These fossils are relatively large (usually >100 µm, often as large as 700 µm) and conspicuous, and even fragments of them are recognizable. This argument is particularly apt with regard to C. globosa, which is both robust and distinctive; even very small fragments of C. globosa can be identified.
Diversity patterns from this study
Fossil abundance and taxonomic diversity covary throughout the sample suite (Fig. 2), suggesting diversity changes may simply be artifacts of changes in fossil abundance. However, standardized diversity—measured as the taxonomic diversity of a subsample composed of the first twenty specimens encountered during light microscopy—is also positively correlated with sample diversity. This suggests that fluctuations in diversity are genuine.
Abundance, taxonomic diversity, and standardized diversity of upper Alinya Formation of Giles 1. Y-axis is sample depth; lower X-axis is number of taxa (sample diversity and standardized diversity); upper X-axis is number of specimens recorded (abundance). Standardized diversity reflects taxonomic diversity of subsamples consisting of the first 20 specimens recorded in light microscopy of strewn slides.

The greatest taxonomic diversity was found in the lowest part of the upper Alinya Formation (1,265.36–1,265.71 m; Figs. 1, 2). Samples from the uppermost parts of this formation host a greater proportion of smooth-walled spheroids (leiosphaerids), colonies of cells, and simple filaments; few ornamented acritarchs occur in these rocks. We suspect that the absence of ornamented acritarchs in younger samples is primary rather than taphonomically driven given that they appear to be relatively robust (i.e., thicker walled) compared to many of the leiosphaerids that are present in these samples. Whether this shift reflects local factors such as a change in water depth or global factors such as extinction is not known. The whole unit is interpreted to record deposition in a shallow marine to sabkha environment, and forms considered to have been benthic mat formers (i.e., Synsphaeridium spp. and the various filamentous species) are seen throughout the unit, thus any change in water depth is likely to have been relatively little.
Materials and methods
All samples for this study were processed by standard hydrofluoric maceration by Waanders Palynology Consulting, following protocols outlined by Grey (Reference Grey1999). Macerate samples are stored in 200 proof ethyl alcohol to discourage fungal and bacterial growth.
For SEM study, drops of sample macerate were strewn on glass slides or on SEM stubs and allowed to air dry. Transmitted light microscopy (using a Zeiss Axioskop 40) was performed on the glass slide preparations in order to locate specimens, note coordinates, and circle them with a fine-point marker so they could be located during SEM study. A 20- to 30-nm-thick carbon coat was applied with a high-vacuum carbon coater to reduce the effects of charge build-up. SEM was performed with a FEI Quanta 400 field-emission, environmental SEM using a voltage of 5 kV and working distances from 7 to 9 mm. After SEM analyses, glass coverslips were epoxied to the glass slides (using Petropoxy 154) and photographed under high magnification transmitted light microscopy using QImaging camera and Qcapture software. This allowed comparison of the same specimens in SEM and light microscopy.
Cross sectioning by Focused Ion Beam Electron microscopy (FIB-EM) was performed on Culcitulisphaera revelata n. gen. n. sp. specimens partially embedded in epoxy using FEI DB235 Dual-Beam FIB. Samples were prepared by applying a drop of epoxy (Petropoxy 154) to an SEM stub and then holding the stub with the stem in contact with a hot plate in order to begin curing before a drop of fossil macerate was applied. The goal was to apply the fossils to epoxy that was not completely cured but would cure by virtue of residual heat of the stub. When the epoxy reached a tacky texture, the stub was removed from the heat and a drop of fossil macerate was applied by pipette. The stub was then allowed to cool. After carbon coating (20 to 30 nm), fossils were located by SEM. Relocation of fossils for FIB sectioning was expedited by creation of high-resolution montages of stubs during SEM. FIB is most efficient and least likely to produce slicing artifacts when used on smooth surfaces; this was achieved by selecting regions of low topographic relief and applying a ~500 nm coat of platinum to the 10 µm x 10 µm square region to be sliced. Near the target region, a 2×2 µm square of platinum was applied and an ‘X’ marked into the surface to act as a fiducial marker, used after sectioning was complete in order to align images. The FIB milled away 80 ~120-nm-thick sections of the fossil; after each slice, an electron image of the milled edge of the fossil was captured.
Systematic paleontology
All illustrated specimens have been reposited in the collections of the South Australian Museum (SAM), Adelaide, under the accession numbers SAM P49464–P49558. Slide numbers in captions begin with depth (in meters) in the Giles 1 drill core and are followed by a forward slash mark and specimen coordinates and then accession number in parentheses. Fossil coordinates were generated using England Finder graticule with sample slide label to the left for all slides except 1265.46-Feb6 and 1265.46-2_28B, for which the label is to the right. A table of all specimens, their accession numbers, slides or stubs, and coordinates is available in the supplemental data file. Coordinates are unavailable for specimens on stubs. The International Code of Nomenclature for Algae, Fungi, and Plants (Melbourne Code, 2011) is followed.
Acritarchs Evitt, Reference Evitt1963
Genus Caelatimurus new genus
Type species
Caelatimurus foveolatus, n. sp., by monotypy.
Diagnosis
As for type species.
Etymology
From the Latin, caelatum, meaning ‘embossed or engraved’ and murus, meaning ‘wall’ for the embossed appearance of the vesicle. Pseudocompounding is intentional (recommendation 60G.1(c) of the ICN) and used to indicate etymological difference with the Latin caelum, meaning sky or heaven.
Remarks
The diagnostic feature of this genus, the embossed ellipsoids upon the vesicle wall, is not seen in previously named genera, thus a new genus is erected here for the new species, Caelatimurus foveolatus.
Caelatimurus foveolatus new species
(1–5) Karenagare alinyaensis n. gen. n. sp.; (4) holotype. (6–8) Caelatimurus foveolatus n. gen. n. sp.; (6, 7) holotype. (9–14) Volleyballia dehlerae. Note that on (2, 3) striations are visible on only a portion of vesicle; (1) possible outer vesicle visible; (4) ridges suggestive of external ornamentation visible on the lower-most portions. Images (1–8, 12–14) are from transmitted light microscopy; (9–11) are from scanning electron microscope. Scale bar below (3) is 50 µm for (1–6, 8) and is 25 µm for (7, 9–11). Slides and coordinates: (1) 1265.46-18B/M28-2 (P49491); (2) 1265.57-19A/N38-1 (P49506); (3) 1265.46-18B/W31-0 (P49492); (4) 1265.46-18B/H18-3 (P49493); (5) 1265.57-19A/Y40-2 (P49507); (6, 7) 1265.57-19A/G27-2 (P49508); (8) 1265.57-19A/L16-4 (P49509); (9) 1265.46-2_28B (P49504); (10) 1265.57-March8StubA (P49545); (11) 1265.57-March20_epoxyA (P49546); (12) 1265.57-19A/H38-2 (P49510); (13) 1265.57-19A/M40-0 (P49511); (14) 1265.57-19A/M15-4 (P49512).

1978 Sphere with type I reticulate surface; Reference Peat, Muir, Plumb, McKirdy and NorvickPeat, Muir, Plumb, McKirdy, and Norvick, p. 5, fig. 3A.
1978 Sphere with type II reticulate surface; Reference Peat, Muir, Plumb, McKirdy and NorvickPeat, Muir, Plumb, McKirdy, and Norvick, p. 5, fig. 3B, 3D–F.
1984 Turuchanica maculata Reference Tynni and UutelaTynni and Uutela, p. 24, ?fig. 175, fig. 176, non 177, nec 178–179, ?180–182, nec 183–186 (in part).
2016Caelatimurus foveolatus; Reference Porter and RiedmanPorter and Riedman, p. 819, fig. 3.1.
Holotype
(Fig. 3.6, 3.7), SAM Collection number P49508, slide 1265.57-19A, coordinate G27-2, depth of 1,265.57 m Giles 1 drill core, Alinya Formation, Officer Basin, Australia.
Diagnosis
Optically dense spheroidal to ellipsoidal organic-walled microfossils ~30 to 60 µm in diameter, bearing frequent (~40 per 100 µm2), small (0.9 to 1.2 µm wide and ~2 µm long), light-colored ellipsoidal depressions upon the vesicle.
Occurrence
This form has been reported from the Neoproterozoic Chuar Group (Porter and Riedman, Reference Porter and Riedman2016), the Mesoproterozoic Roper Group (Peat et al., Reference Peat, Muir, Plumb, McKirdy and Norvick1978), and in the poorly constrained, but probably Mesoproterozoic, Muhos Formation of Finland (Tynni and Uutela, Reference Tynni and Uutela1984).
Description
Optically dense spheroidal to ellipsoidal organic-walled microfossils ranging in diameter from 30.6 to 59.2 μm (
 $${\rm \bar{x}}=41.3\,{\rm \mu m}$$
, s=15.6, N=3) bearing lighter-colored ellipsoidal marks 0.9 to 1.2 µm wide and typically ~2 µm in length that appear to be impressions in the vesicle wall.
Etymology
From the diminutive of the Latin fovea, meaning ‘minutely pitted.’
Material examined
Three specimens from the Alinya Formation, Giles 1 drill core depth 1,265.46 and 1,265.57 m.
Remarks
Peat and colleagues (Reference Peat, Muir, Plumb, McKirdy and Norvick1978) reported two morphotypes of reticulated spheroids from the McMinn Formation of the Mesoproterozoic Roper Group (fig. 3A, 3B, 3C–F; we do not include fig. 3C in the preceding synonymy because distortion due to crystalline growth makes identification of that specimen equivocal). These two morphotypes are distinguished by width of the ellipsoidal impressions. Measurements from the images of the Roper Group specimens indicate similar vesicle diameters, ranging from 45 to 50 μm; the type I reticulated spheroids bear ellipsoidal markings 0.5 to 1 μm in width and 1.5 to 4 μm in length, and type II reticulated spheroids bear ellipsoidal markings 1.8 to 2 μm in width and 2 to 3.2 μm in length. Specimens from the Alinya Formation range from 30.6 to 59.2 μm in diameter and bear ellipsoidal markings 0.9 to 1.2 μm in width and ~2 μm in length, and the single specimen recovered from the Chuar Group (Porter and Riedman, Reference Porter and Riedman2016) is 29 μm in diameter with ellipsoidal markings 1 to 1.5 μm in width and 1 to 3 μm in length. Thus, the specimens from the Alinya and Chuar assemblages bridge the morphological distance between the two morphotypes described by Peat et al. (Reference Peat, Muir, Plumb, McKirdy and Norvick1978). Because of this, we interpret the differences in ellipsoidal dimensions as intraspecific rather than indicative of separate species.
This species also occurs in the Muhos Formation of Finland (Tynni and Uutela, Reference Tynni and Uutela1984), but the name assigned in that paper, Turuchanica maculata, is not employed here. This is because although Tynni and Uutela (Reference Tynni and Uutela1984) mentioned a patterned wall in their description, this feature—considered here to be a diagnostic feature—is not apparent in the holotype (pl. 8, fig. 175). It is clearly visible in only one (pl. 8, fig. 176) and possibly present in another three (pl. 8, fig. 180–182) of the twelve specimens figured.
Due to the frequency and regularity of these markings in all occurrences as well as their absence from any other taxa, the embossed vesicle ornamentation of C. foveolatus is interpreted to be of primary biological origin rather than a taphonomic one—either by distortions caused by crystal growth or movement (cf. Xiao and Knoll, Reference Xiao and Knoll1999) or by borings of microbial degradation of the vesicle (cf. Grey and Willman, Reference Grey and Willman2009).
Genus Comasphaeridium Staplin, Jansonius, and Pocock, Reference Staplin, Jansonius and Pocock1965
Type species
Comasphaeridium cometes (Valensi, Reference Valensi1949) Staplin, Jansonius and Pocock, Reference Staplin, Jansonius and Pocock1965.
‘ Comasphaeridium’ tonium Zang, Reference Zang1995
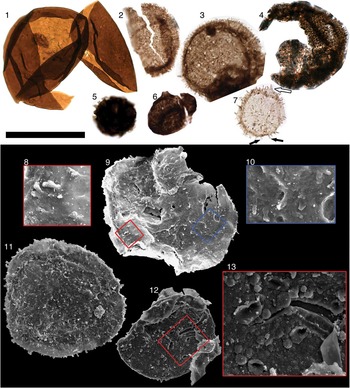
(1) Valeria lophostriata. (2–4) ‘Comasphaeridium’ tonium. (5) Unnamed Acritarch sp. B. (6) Unnamed Acritarch sp. C. (7–11) Unnamed Acritarch sp. D: (7) white arrow indicates conical extension of vesicle below process; left black arrow indicates process bifurcation; right black arrow indicates process overlap. (12) Unnamed Acritarch sp. E. Black scale bar is 50 µm for (1–7), 33 μm for (9), 25µm for (11, 12), 10 μm for (8, 10), and 8 μm for (13). Slide and coordinates: (1) 1265.57-19A/L38-0 (P49517); (2) 1255.76-16B/G22-1 (P49484); (3) 1265.57-19A/L18-3 (P49518); (4) 1255.76-16B/M34-3 (P49485); (5) 1242.84-13A/L16-1 (P49467); (6) 1255.43-15A/Q20-1 (P49478); (7) 1255.76-16A/T13-0 (P49482); (8–10) 1265.46-Feb6/on top of other fossils, unavailable (P49499); (11) 1265.57-1_29BigStubB (P49538), (12) 1265.57-1_29BigStubB (P49539).

1995 Comasphaeridium tonium Reference ZangZang, p. 162, fig. 24A–G.
Holotype
(Zang, Reference Zang1995; fig. 24B), slide 5341RS308-8 from 1,237.9 m of Giles 1 drill core, Alinya Formation, Officer Basin, Australia.
Occurrence
The Neoproterozoic Alinya Formation (Zang, Reference Zang1995). Singh and Babu (Reference Singh and Babu2013) also reported C. tonium from the Neoproterozoic Raipur Group of India; however, the fossil figured is too poorly preserved to provide an unequivocal identification.
Description
Spheroidal organic-walled microfossils ranging in vesicle diameter from 42.5 to 57.9 µm (
 $$ {\rm \bar{x}}=51.3\,{\rm \mu m}$$
, s=5 µm, N=7) and bearing frequent (12–20 visible in 10 µm section of vesicle perimeter) short, simple, unbranching fine processes (length range 0.8–2.4 µm,
 $$ {\rm \bar{x}}=1.5\,{\rm \mu m}$$
, s=0.6; width range 0.4 to 0.7 µm,
 $$ {\rm \bar{x}}=0.5\,{\rm \mu m}$$
, s=0.1 µm). No outer envelope has been observed. Processes appear to be solid, as determined from the consistent optical density of processes viewed from the side and head-on; they do not appear to be a lighter shade in the center of the process.
Material examined
Seven specimens from the Alinya Formation, Giles1 drill core depths 1,255.43, 1,255.76, 1,265.57 and 1,265.71 m.
Remarks
The specimens recovered in this study conform to Zang’s (Reference Zang1995) description of C. tonium from the Alinya Formation. However, the generic assignment of this species to the Mesozoic genus Comasphaeridium is considered dubious due to its overly broad diagnosis (“spherical to ellipsoidal, sometimes of large size with densely crowded, thin, solid, usually simple, more or less flexible hair-like spines”; Staplin et al., Reference Staplin, Jansonius and Pocock1965, p. 192). Unfortunately, the current fossil material is not sufficient to recommend a new nomenclatural combination or erection of a new genus.
Genus Culcitulisphaera new genus
Type species
Culcitulisphaera revelata n. sp., by monotypy.
Diagnosis
As for type species.
Etymology
From the Latin culcitula, meaning ‘small pillow,’ and sphaera; a sphere covered by small pillows.
Remarks
The distinctiveness of the pillow elements of the vesicle exterior warrants the erection of a new genus. No existing genus is known that can accommodate the features diagnostic of Culcitulisphaera revelata, thus a new genus is established here.
Culcitulisphaera revelata new species
Culcitulisphaera revelata n. gen. n. sp.: (1–5) transmitted light images; (6–12) scanning electron microscope images; (1) holotype. Scale bar is 50 µm for (1–6, 8, 11), 8 μm for (7), and 16 μm for (9, 10, 12). Slide and coordinates: (1) 1265.57-19A/N24-1 (P49519); (2) 1265.26-18B/S34-2 (P49494); (3) 1265.46-18A/L38-3 (P49487); (4) 1265.46-18B/G30-3 (P49495); (5) 1265.46-18A/L26-2 (P49488); (6, 7) 1265.57-LittleStubB (P49541); (8, 9) 1265.57-1_17BigStubA (P49534); (10–12) 1265.46-Feb6/Z34-0 (P49500).

Transmitted light and scanning electron microscope images of Lanulatisphaera laufeldii and Culcitulisphaera revelata n. gen n. sp. specimens: (1–3) are same specimen of L. laufeldii; (4–6) are same specimen of C. revelata. (1, 4) Transmitted light microscope images; (2, 3, 5, 6) scanning electron microscope images. Scale bar is 20 µm for (1, 2, 4, 5), 10 μm for (3), and 7 μm for (6). Slide and coordinates: (1–3) 1265.46-Feb6/E29-0 (P49498); (4–6) 1265.46-2_28B/AA55-4 (P49503).

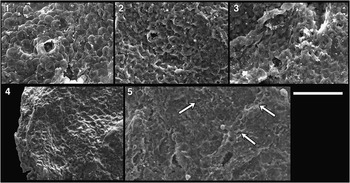
(1–5) Sequence of taphonomic degradation of Culcitulisphaera revelata n. gen. n. sp. Note pillow-like elements of C. revelata (1) become progressively sunken (2–4). In parts of (5) the top layer of the pillow element is sheared away (white arrows). Scale bar=10 µm. Slide/stub and coordinates: (1) 1265.57-1_17BigStubA (P49534); (2) 1265.46-Feb6/on top of other fossils, unavailable (P49497); (3) 1265.57-1_17BigStubA (P49535); (4) 1265.57-4_15/N45-2 (P49549); (5) 1265.46-2_28B/O50-2 (P49502).

FIB-EM sectioning of Culcitulisphaera revelata n. gen. n. sp. All images of same specimen. (2) Platinum coating and nearby fiducial marker applied to fossil before FIB sectioning. (3) Fossil after sectioning complete. (4, 5) Acritarch wall with nanopores. Scale bar is 20 µm for (1), 4 µm for (2), 13 μm for (3), 1 µm for (4, 5). Stub: 1265.57 March20_epoxyA (P49547).

Non 1966 Trachyhystrichosphaera laminaritum Reference TimofeevTimofeev, p. 36, pl. 7, fig.3.
1979 Kildinella sp.; Reference VidalVidal, pl. 4, figs. C, D.
?1985 Trachysphaeridium sp. A; Reference Vidal and FordVidal and Ford, p. 377, figs. 8B, 8D.
1992 Trachysphaeridium laminaritum; Reference SchopfSchopf, pl. 14, fig. A.
2009 Trachysphaeridium laminaritum; Reference Nagy, Porter, Dehler and ShenNagy, Porter, Dehler, and Shen, fig. 1H.
2016 Culcitulisphaera revelata; Reference Porter and RiedmanPorter and Riedman, p. 822, figs. 5.1–5.7.
Holoype
(Fig. 5.1), SAM Collection number P49519, slide 1265.57-19A, coordinate N24-1, depth of 1,265.56 m, Giles 1 drill core, Alinya Formation.
Diagnosis
Optically dense spheromorphic organic-walled microfossil distinguished by a surface ornament of tightly packed 1 to 3 µm cushion-shaped outpockets of the vesicle that may appear only as ~1 µm diameter light spots or alveolae under transmitted light microscopy.
Occurrence
Appears in late Mesoproterozoic to middle Neoproterozoic units: the uppermost Limestone Dolomite ‘series’ (beds 19–20) of the Eleonore Bay Group of East Greenland (Vidal, Reference Vidal1979), the Chuar Group of southwestern United States (Nagy et al., Reference Nagy, Porter, Dehler and Shen2009; Porter and Riedman, Reference Porter and Riedman2016), and the Lakhanda Group of Siberia (Schopf, Reference Schopf1992; however, see the following).
Description
Optically dense organic vesicle circular to ellipsoidal in outline, ranging in diameter from 34.6 to 88.4 µm (
 $${\rm \bar{x}}=60.3\,{\rm \mu m}$$
, s=15.6, N=24); reflecting an originally spherical to subspherical shape. Vesicle surface consists of small circular to subcircular outpockets. The outpocket elements range in diameter from 1.3 to 2.7 µm (
 $${\rm \bar{x}}=1.8\,{\rm \mu m}$$
, s=0.6, N=17; measurement unavailable in specimens viewed only by transmitted light microscopy). Vesicular elements are unlikely to have been surficial scales as none has yet been found separated from the vesicle surface, and inspection of all specimens suggests full attachment to the vesicle. Thus far, these vesicular elements have been recognized only under SEM. When specimens are viewed with transmitted light microscopy, the surface appears to have small (~0.7 µm) alveolae or hemispherical depressions in the vesicle, which are in fact the centers of the outpockets where light passes through fewer layers of vesicle. Occasionally, these structures can be recognized as cushion-shaped elements along the periphery of a specimen as viewed under light microscopy (Fig. 5.1–5.5).
A spectrum of taphonomic variation is seen in C. revelata specimens. Study of these variants has been informative for developing an understanding of the vesicle morphology (for example, by providing evidence of the hollow nature of the pillow-shaped elements and indication that the wall is composed of individual pillow elements rather than bearing only a textured surface). The flexibility of the vesicle wall is indicated in the folding that occurs in the elements along the perimeter of the flattened fossil, giving an imbricated appearance (Fig. 7.4). During degradation, the pillow elements of the vesicle appear to ‘deflate’; the outer wall of the element sinks into the underlying cavity (Figs. 5.7, 5.12, 7.3), creating a honeycomb-like appearance. Occasionally, the outermost skin of the pillows shows rupture (Fig. 7.1, 7.2) or appears to have been sheared away from the fossil (arrows in Fig. 7.5), revealing a smooth surface within. Several of the fossils studied here also show a wart-like crater that excavates through the vesicle layers (Fig. 5.6, 5.11, 5.12); this feature is not interpreted as an excystment structure, but more likely represents postmortem degradation.
FIB-EM sectioning and analysis by energy-dispersive X-ray spectroscopy (EDS) of C. revelata specimens (Fig. 8) indicates a homogeneous carbon composition with no discernable boundaries between vesicle layers, likely to be a product of compaction and diagenesis. FIB-EM nanotomography of these samples did, however, reveal the presence of frequent 30 to 600 nm nanopores within the vesicle (Fig. 8.4, 8.5). Similar nanopores are seen in FIB serial sections of the Mesoproterozoic acritarch, Shuiyousphaeridium macroreticulatum (Du, 1988 in Guan et al., Reference Guan, Geng, Rong and Du1988) Yan 1992 (in Yan and Zhu, Reference Yan and Zhu1992) (Schiffbauer and Xiao, Reference Schiffbauer and Xiao2009; Pang et al., Reference Pang, Tang, Schiffbauer, Yao, Yuan, Wan, Chen, Ou and Xiao2013). The occurrence of these features is unlikely to represent artifacts of processing and may speak to a spongy, woven, or reticulated subsurface in this taxon. A particularly clear example of this spongy, woven substructure is seen in a specimen of the Chuar Group (fig. 5.4a, 5.5a of Porter and Riedman, Reference Porter and Riedman2016).
Etymology
From the Latin revelatum, meaning ‘revealed,’ referring to the fact that the pillow elements of the vesicle were unknown until revealed by SEM.
Material examined
Twenty-seven specimens from the Alinya Formation, Giles 1 drill core depths 1,265.36, 1,265.46, and 1,265.57 m.
Remarks
C. revelata is not considered here to be conspecific or congeneric with Trachysphaeridium laminaritum, although this was thought a likely taxonomic home for these specimens due to similarities with specimens figured by Schopf et al. (1992) and Nagy et al. (Reference Nagy, Porter, Dehler and Shen2009). The original diagnosis and description of T. laminaritum (Timofeev, Reference Timofeev1966) are vague and do not mention features considered diagnostic of C. revelata (i.e., alveolae or circular to cushion-shaped vesicular elements), instead describing a thick-walled vesicle with a chagrinate texture ranging from 70 to 250 μm in diameter (typically 120 to 200 μm)—larger than the 35- to 88-μm-diameter specimens recovered from the Alinya Formation. In addition, the fossil images of T. laminaritum (pl. 7, fig. 3; hand-drawn illustrations) do not conclusively illustrate diagnostic features of this taxon.
The fossil imaged in plate 14, figure A, p. 1075 of Schopf (Reference Schopf1992) appears to be C. revelata. The caption reads, “Trachysphaeridium laminaritum Timofeev in press HOLOTYPE” and the fossil is indicated as being from the Lakhanda Group of Siberia (the publication “in press” is unclear and not listed in the bibliography). The “holotype” designation in the caption is apparently incorrect as the holotype Timofeev (Reference Timofeev1966) designated for T. laminaritum was from a drill core taken from northern Moldova, not from the Lakhanda Group of Siberia. Differences in diameter and outline indicate these are two distinct specimens. There would have been no need to designate a neotype in 1992 as Timofeev’s original specimens were still available for study as of 1996 (Knoll, Reference Knoll1996; contra Jankauskas et al., Reference Jankauskas, Mikhailova and Hermann1989). In any case, the specimen figured by Schopf (Reference Schopf1992) indicates that C. revelata was a part of the ca. 1 Ga Lakhanda biota, extending this form’s geographic and stratigraphic range.
Genus Karenagare new genus
Type species
Karenagare alinyaensis n. sp., by monotypy
Diagnosis
As for type species.
Etymology
Karenagare is from the Japanese name for the element of raked sand or gravel in Zen rock gardens forming impressionistic waterless streams. It applies here to the resemblance of the fossil’s ridged ornament to the lines of sand or gravel composing the ‘stream.’
Remarks
These fossils are distinguished from other striated acritarch taxa by the undulating nature of the striations rather than sharp grooves as seen in Volleyballia dehlerae or narrow ridges (~0.5 µm from crest to crest) as in Valeria lophostriata. In addition, these undulations are seen on the exterior of the vesicle as opposed to the interior linear ornamentations of V. lophostriata (Javaux et al., Reference Javaux, Knoll and Walter2004). Although these species share superficial similarity, there is no reason to presume they may have been closely related. Thus, the decision to erect a new genus for this species (rather than a new species within Valeria or Volleyballia) is based on intent to create a biologically meaningful generic concept.
Karenagare alinyaensis new species
?1996 Unnamed acritarch, Reference KnollKnoll , pl. 4, fig 11.
Holotype
(Fig. 3.4), SAM Collection number P49493, slide 1265.46-18B, coordinate H18-3, depth of 1,265.46 m, Giles 1 drill core, Alinya Formation.
Diagnosis
Spheroidal to ellipsoidal organic-walled microfossils bearing 2–3 µm wide, parallel, undulatory, ripple-like external striations.
Occurrence
Neoproterozoic Alinya Formation of Officer Basin, South Australia, and perhaps an unspecified Neoproterozoic unit of Russia (Knoll, Reference Knoll1996).
Description
Spheroidal to ellipsoidal organic-walled microfossils with vesicles of varying opacity and distinctive ornamentation of wide, parallel, undulating, ripple-like striations measuring 2–3 µm from crest to crest of ridges (the darker lineations). Vesicles range in diameter from 32.2 to 86.7 µm (
 $${\rm \bar{x}}=42.7\,{\rm \mu m}$$
, s=16.2 µm, N=10). On certain specimens (Fig. 3.2, 3.3), the striations are visible on only a small part of the vesicle, but others exhibit striations over the entire visible vesicle surface; whether this is indicative of ontogenetic or taphonomic variation is not yet clear. One specimen may exhibit an outer envelope (Fig. 3.1). Striations appear to ornament the external surface of the vesicle as suggested by their appearance along the periphery of the vesicle (lower portion of Fig. 3.4).
Etymology
For the fossil’s discovery in the Alinya Formation of Officer Basin, South Australia.
Material examined
Ten specimens from the Alinya Formation, Giles 1 drill core depths 1,265.46 and 1,265.57 m.
Remarks
The ‘unnamed acritarch’ of Knoll (Reference Knoll1996) appears similar to K. alinyaensis but as measured from the image is ~25 µm in diameter with striations ~1 µm from crest to crest, somewhat smaller with more closely spaced ridges than those recovered here.
There is an intriguing morphological similarity between K. alinyaensis and species of Moyeria, early Paleozoic organic-walled microfossils interpreted as possible euglenoids (Gray and Boucot, Reference Gray and Boucot1989). The size and curvature of the undulations in the vesicle of K. alinyaensis are consistent with the appearance of the ridges in Moyeria sp.; these have been interpreted as pellicle strips in the latter (Gray and Boucot, Reference Gray and Boucot1989). At this time nothing more than a mention of morphological similarity is possible, but if further study were to establish a euglenoid affinity for K. alinyaensis, this would be the oldest known record of this clade.
Genus Lanulatisphaera Porter and Riedman Reference Porter and Riedman2016
Type species
Lanulatisphaera laufeldii (Vidal, Reference Vidal1976) Porter and Riedman Reference Porter and Riedman2016.
Lanulatisphaera laufeldii (Vidal, Reference Vidal1976) Porter and Riedman Reference Porter and Riedman2016
(1–8) Morgensternia officerensis n. gen. n. sp.: (1) holotype; (2, 3) arrows indicate rare bent processes; (6, 8) arrows indicate stump of a broken process revealing solid character. (9–12) Lanulatisphaera laufeldii: (9) close-up on nano-scale mammillary ornament upon vesicle; (11) close-up on anastomosing filaments beneath outer envelope (absent from this specimen). Scale bar is 50 µm for (1–4), 35 μm for (5, 7, 10, 12), 18 μm for (6), and 9 μm for (8, 9, 11). Slide and coordinates: (1) 1265.57-19A/V32-4 (P49520); (2) 1265.46-18B/N19-1 (P49496); (3) 1265.57-19A/S38-0 (P49521); (4) 1265.71-105A/U27-2 (P49550); (5, 6) 1265.57-LittleStubB (P49542); (7, 8)–1265.57-LittleStubA (P49536); (9, 10) 1265.57-LittleStubB (P49543); (11, 12) 1265.46-Feb6/missing after epoxy (P49501).

Vesicle detail of Lanulatisphaera laufeldii: (2) detail of inset in (1); (4) detail of inset in (3); note nano-scale mammillary ornamentation. Scale bar is 5 µm for (2, 4) and 40 µm for (1, 3). Slide/Stub and coordinates: (1, 2) 1265.46-Feb6/E29-0 (P49498); (3, 4) 1265.57-1_29LittleStubA (P49537).

1976 Trachysphaeridium laufeldi Reference VidalVidal, p. 36, fig. 21A–N.
1985 Trachysphaeridium laufeldi; Reference Vidal and FordVidal and Ford, p. 375, fig. 7A, B.
?1985 Trachysphaeridium laufeldi; Reference Vidal and FordVidal and Ford, p. 375, fig. 7D, F.
?1985 Trachysphaeridium laminaritum; Reference Vidal and FordVidal and Ford, p. 373, fig. 8A, C.
1997 Lophosphaeridium laufeldii; Reference SamuelssonSamuelsson, p. 174, fig, 7F, H, I.
2009 Lophosphaeridium laufeldi; Reference Nagy, Porter, Dehler and ShenNagy, Porter, Dehler, and Shen , fig. 1J.
2016 Lanulatisphaera laufeldii; Reference Porter and RiedmanPorter and Riedman, p. 828–831, figs. 9.1–9.6, 10.1–10.7, 11.1–11.4, 12.1–12.7, ?12.8.
Holotype
(Vidal, Reference Vidal1976; fig. 21A–E), Specimen BV/83.60—1:X/53.3 middle unit, Kumlaby bore hole, Neoproterozoic Visingsö Group, Sweden. Designated by Vidal (Reference Vidal1976).
Occurrence
Occurs in early Neoproterozoic units including Visingsö Group of southern Sweden (Vidal, Reference Vidal1976), the Kildinskaya Group, northwestern Russia (Samuelsson, Reference Samuelsson1997), and the Chuar and Uinta Mountain groups of southwestern United States (Vidal and Ford, Reference Vidal and Ford1985; Nagy et al., Reference Nagy, Porter, Dehler and Shen2009; Porter and Riedman, Reference Porter and Riedman2016).
Description
Small, spheroidal, organic-walled microfossils ranging in diameter from 26.5 to 46.1 µm (
 $${\rm \bar{x}}=33.1\,{\rm \mu m}$$
, s=4.6 µm, N=21) and bearing abundant, solid, thin (
 $${\rm \bar{x}}=0.4\,{\rm \mu m}$$
, s=0.1 µm, N=21), filamentous structures that emanate from the external surface of the inner vesicle and fuse distally. Outer vesicle envelops—but does not appear to make contact with—the inner vesicle or reticulate filamentous structures. Outer vesicle exhibits a fine-scale (~50 to 100 nm diameter) mammillar ornament (Figs. 9.9, 10.2, 10.4; see also fig. 10.4, 10.5a, 10.6a in Porter and Riedman, 2016). Filamentous processes not typically visible in transmitted light microscopy but are easily identifiable by SEM. In transmitted light, fossils appear very dark and often mottled; double-vesicle construction not always easily determined due to optical density of outer vesicle.
During taphonomic degradation the filaments become flattened and shortened by breakage, but still visibly fused (Fig. 6.3).
The occasional spiny protuberances and circular openings surrounded by raised rims reported by Vidal (Reference Vidal1976) and Vidal and Ford (Reference Vidal and Ford1985) and seen in Nagy et al. (Reference Nagy, Porter, Dehler and Shen2009, fig. 1j) were not observed in the present material.
Material examined
Twenty-one specimens from the Alinya Formation, Giles 1 drill core depths 1,265.46 and 1,265.57 m.
Remarks
Similarities are seen between L. laufeldii and Morgensternia officerensis n. gen. n. sp. (both Fig. 9); these species may be distinguished by differences in process character. Whereas the conical processes of M. officerensis are easily viewed in transmitted light, the reticulated filaments of L. laufeldii do not project as far from the surface and may be difficult to recognize in transmitted light. In addition, as viewed by SEM, processes of L. laufeldii are constant in diameter and anastomose distally with neighboring processes whereas M. officerensis processes are conical, tapering distally, and do not anastomose. Both forms possess external envelopes; however, the nano-scale mammillar ornament of L. laufeldii has not been observed on specimens of M. officerensis.
Genus Leiosphaeridia Eisenack, Reference Eisenack1958b, emend. Downie and Sarjeant, Reference Downie and Sarjeant1963
Type Species
Leiosphaeridia baltica Eisenack, Reference Eisenack1958b.
Remarks
Leiosphaeridia is a form genus comprising morphologically simple, smooth, organic-walled microfossils. Recent ultrastructural analyses have illustrated the polyphyletic nature of this group (e.g., Talyzina and Moczydłowska, Reference Talyzina and Moczydłowska2000; Javaux et al., Reference Javaux, Knoll and Walter2004; Willman, Reference Willman2009).
The formal designations of Leiosphaeridia species given by Jankauskas and colleagues (Reference Jankauskas, Mikhailova and Hermann1989) are followed here. Species are differentiated on the basis of diameter and opacity of the vesicle. L. crassa and L. jacutica possess an optically dense vesicle and are differentiated by being less than (L. crassa) or greater than (L. jacutica) 70 µm in diameter. Similarly, L. minutissima and L. tenuissima possess vesicles of low optical density and are differentiated on the basis of being less than (L. minutissima) or greater than (L. tenuissima) 70 µm in diameter.
Leiosphaeridia crassa (Naumova, Reference Naumova1949) Jankauskas (in Jankauskas et al., Reference Jankauskas, Mikhailova and Hermann1989)
(1, 2) Unnamed Acritarch sp. A. (3, 4, 8) Vidalopalla verrucata n. comb. (5) Leiosphaeridia crassa. (6) Leiosphaeridia jacutica. (7) Leiosphaeridia minutissima. (9, 10) Navifusa majensis. (12) Leiosphaeridia tenuissima. (8) Shows detail of (4). (11) Shows transverse annulations of (9). Scale bar is 50 µm for (1–7, 9, 10, 12), 10 µm for (8), and 25 µm for (11). Slide and coordinates: (1) 1255.43-15A/E25-1 (P49477); (2) 1265.71-105A/L17-4 (P49479); (3) 1265.57-19A/H32-1 (P49513); (4, 8) 1265.57- LittleStubB (P49540); (5) 1265.57-19A/T40-2 (P49514); (6) 1265.57- 19A/M43-0 (P49515); (7) 1237.74-12/J34-1(P49464); (9, 11) 1265.57-19A/T28-3 (P49516); (10) 1266.31-20/P35-0 (P49556); (12) 1265.46-18A/N17-0 (P49486).

1949 Leiotriletes crassus Reference NaumovaNaumova, p. 54, pl.1, figs. 5, 6, pl.2, figs. 5, 6.
1989 Leiosphaeridia crassa; Reference Jankauskas, Mikhailova and HermannJankauskas in Jankauskas, Mikhailova, and Hermann, p. 75, pl. 9, figs. 5–10 (see for additional synonymy).
1994 Leiosphaeridia crassa; Reference Butterfield, Knoll and SwettButterfield, Knoll, and Swett, p. 40, figs. 16F, 23K.
1994 Leiosphaeridia crassa; Reference Hofmann and JacksonHofmann and Jackson, p. 22, figs. 13.3, 15.19–15.29.
1999 Leiosphaeridia crassa; Reference Buick and KnollBuick and Knoll, p. 756, fig. 5.2–5.4.
2005 Leiosphaeridia crassa; Grey, Reference Grey2005, p. 179, figs. 63A–C, 64 A, ?B, ?C, D.
2008 Leiosphaeridia crassa; Reference MoczydłowskaMoczydłowska, p. 84, figs. 7A, 8G.
2016 Leiosphaeridia crassa; Porter and Riedman, p. 830, fig. 11.2
Holotype
No holotype was designated by Naumova (Reference Naumova1949). Jankauskas (in Jankauskas et al., Reference Jankauskas, Mikhailova and Hermann1989, p. 75) designated a specimen (pl. 1, fig. 3) from Naumova (Reference Naumova1949) as lectotype. However, this specimen was not of a species they synonymized with Leiosphaeridia crassa, but was instead Leiotriletes simplicissimus, a species Jankauskas and colleagues (Reference Jankauskas, Mikhailova and Hermann1989) synonymized with a different species of Leiosphaeridia, L. minutissima.
Occurrence
Ubiquitous in Precambrian and Phanerozoic organic-walled microfossil assemblages.
Description
Solitary, spheroidal, smooth, single-walled vesicles 18 to 70 µm in diameter (
 $${\rm \bar{x}}=36.5\,{\rm \mu m}$$
, s=13.4 µm, N=132). Vesicle dark but translucent.
Material examined
One hundred sixty-seven specimens measured (many more present but uncounted) from the Alinya Formation, Giles 1 drill core depths 1,237.74, 1,242.84, 1,244.17, 1,248.91, 1,255.43, 1,255.76, 1,257.73, 1,265.36, 1,265.46, 1,265.57, 1,265.71, and 1,266.31 m.
Leiosphaeridia jacutica (Timofeev, Reference Timofeev1966) Mikhailova and Jankauskas
(in Jankauskas et al., Reference Jankauskas, Mikhailova and Hermann1989)
1966 Kildinella jacutica Reference TimofeevTimofeev, p. 30, pl. 7, fig. 2.
1989 Leiosphaeridia jacutica; Mikailova and Jankauskas in Reference Jankauskas, Mikhailova and HermannJankauskas, Mikhailova, and Hermann, p. 77, pl. 12, figs. 3, 7, 9 (see for additional synonymy).
1994 Leiosphaeridia jacutica; Reference Butterfield, Knoll and SwettButterfield, Knoll, and Swett, p. 42, fig. 16H.
1994 Leiosphaeridia jacutica; Hofmann and Jackson, Reference Hofmann and Jackson1994, p. 22, fig. 17.1–17.4.
2005 Leiosphaeridia jacutica; Grey, Reference Grey2005, p. 183, fig 63G.
2009 Leiosphaeridia jacutica; Reference Vorob’eva, Sergeev and KnollVorob’eva, Sergeev, and Knoll, p. 185, fig. 14.13.
2016 Leiosphaeridia jacutica; Porter and Riedman, p. 830, fig. 11.3
Holotype
(Timofeev, Reference Timofeev1966; pl. 7, fig. 2), preparation number 452/1, Biostratigraphy Laboratory, ЛАГЕД AН CCCP Maya River Collection, Mesoproterozoic to Neoproterozoic Lakhanda Group, Russia.
Occurrence
Ubiquitous in Precambrian and Phanerozoic organic-walled microfossil assemblages.
Description
Solitary, spheroidal, smooth, single-walled vesicles 70 to 317 µm in diameter (
 $${\rm \bar{x}}=137.3\,{\rm \mu m}$$
, s=48.4 µm, N=35). Vesicle dark but translucent.
Material examined
Thirty-six specimens from the Alinya Formation, Giles 1 drill core depths 1,242.84, 1,244.17, 1,248.91, 1,255.76, 1,265.36, 1,265.46, and 1,265.57 m.
Leiosphaeridia minutissima (Naumova, Reference Naumova1949) Jankauskas (in Jankauskas et al., Reference Jankauskas, Mikhailova and Hermann1989)
1949 Leiotriletes minutissimus Reference NaumovaNaumova, p. 52, pl. 1, figs. 1, 2, pl. 2, figs. 1, 2.
1989 Leiosphaeridia minutissima; Reference Jankauskas, Mikhailova and HermannJankauskas in Jankauskas, Mikhailova, and Hermann, p. 79, pl. 9, figs. 1–4, 11 (see for additional synonymy).
1994 Leiosphaeridia minutissima; Reference Hofmann and JacksonHofmann and Jackson, p. 21, figs. 15.9–15.15.
1999 Leiosphaeridia minutissima; Reference Buick and KnollBuick and Knoll, p. 756, fig. 5.3–5.6.
2005 Leiosphaeridia minutissima; Reference GreyGrey, p. 184, fig. 63D.
2008 Leiosphaeridia minutissima; Reference MoczydłowskaMoczydłowska, p. 84, fig. 8H.
2016 Leiosphaeridia minutissima; Porter and Riedman, p. 830, fig. 11.1, 11.5, 11.6.
Holotype
No holotype was designated by Naumova (Reference Naumova1949). Jankauskas (in Jankauskas et al., Reference Jankauskas, Mikhailova and Hermann1989, p. 80) designated a specimen of Leiotriletes minutissimus (pl. 1, fig. 1) from Naumova (Reference Naumova1949) as lectotype. Lower Cambrian Blue Clay, Baltic States.
Occurrence
Ubiquitous in Precambrian and Phanerozoic organic-walled microfossil assemblages.
Description
Solitary, spheroidal, smooth, single-walled vesicles 10 to 70 µm in diameter (
 $${\rm \bar{x}}=35.7\,{\rm \mu m}$$
, s=13.4 µm, N=79).
Material examined
One hundred specimens measured (many more present but uncounted) from the Alinya Formation, Giles 1 drill core depths 1,237.74, 1,242.84, 1,244, 1,244.17, 1,255.76, 1,257.73, 1,265.36, 1,265.46, 1,265.57, 1,265.71, and 1,266.31 m.
Leiosphaeridia tenuissima Eisenack, Reference Eisenack1958a
1958a Leiosphaeridia tenuissima Reference EisenackEisenack, p. 391, pl. 1, figs. 2, 3.
1989 Leiosphaeridia tenuissima; Reference Jankauskas, Mikhailova and HermannJankauskas in Jankauskas, Mikhailova, and Hermann, p. 81, pl. 9, figs. 12, 13.
1994 Leiosphaeridia tenuissima; Reference Butterfield, Knoll and SwettButterfield, Knoll, and Swett, p. 42, fig. 16I.
1994 Leiosphaeridia tenuissima; Hofmann and Jackson, Reference Hofmann and Jackson1994, p. 22, fig. 15.16–15.18.
2005 Leiosphaeridia tenuissima; Reference GreyGrey, p. 184, fig. 63H.
2016 Leiosphaeridia tenuissima; Porter and Riedman, p. 830, fig. 11.4.
Holotype
(Eisenack, Reference Eisenack1958a; pl. 1, fig. 2), preparation A3, 3 number 4 from the Dictyonema-shales of the Ordovician Baltic.
Occurrence
Ubiquitous in Precambrian and Phanerozoic organic-walled microfossil assemblages.
Description
Solitary, spheroidal, smooth, single-walled vesicles 70 to 144 µm in diameter (
 $${\rm \bar{x}}=95.9\,{\rm \mu m}$$
, s=23.1 µm, N=11).
Material examined
Seventeen specimens from the Alinya Formation, Giles 1 drill core depths 1,237.74, 1,244.17, 1,255.76, 1,265.36, 1,265.46, 1,265.57, and 1,265.71 m.
Genus Morgensternia new genus
Type Species
Morgensternia officerensis n. sp., by monotypy.
Diagnosis
As for type species.
Etymology
The German, morgenstern, referring to the fossil’s resemblance to the medieval weapon of that name composed of a metal ball bearing frequent spikes.
Remarks
Similar fossils have been assigned in open nomenclature to the genus Gorgonisphaeridium; however, due to significant differences in diagnostic characters, the new genus Morgensternia is erected here for the new species M. officerensis rather than including this species in the existing genus Gorgonisphaeridium. M. officerensis processes are straight rather than sinuous and consistently conically tipped, rather than the occasional branched processes seen in species of Gorgonisphaeridium, including the type species, G. winslowiae Staplin, Jansonius, and Pocock, Reference Staplin, Jansonius and Pocock1965. In addition, M. officerensis possesses an outer vesicle, a feature not found in Gorgonisphaeridium species. The combination of diagnostic characters seen in M. officerensis is not found in previously erected genera.
Morgensternia officerensis new species
?1991 Gorgonisphaeridium maximum Reference Knoll, Swett and MarkKnoll, Swett, and Mark, p. 557, fig. 21.12.
?1992 Baltisphaeridium sp. A; Reference Zang and WalterZang and Walter, p. 280, pl. 5, figs. A–J.
?1992 Baltisphaeridium sp. B; Reference Zang and WalterZang and Walter, p. 281, pl. 5, figs. K–L, (non M–O).
?1994 Gorgonisphaeridium sp.; Reference Butterfield, Knoll and SwettButterfield, Knoll, and Swett, p. 40, figs. 14I–J.
?2009 Cymatiosphaeroides cf. C. kullingii; Reference Nagy, Porter, Dehler and ShenNagy, Porter, Dehler, and Shen, fig. 1.I.
Holotype
(Fig. 9.1), SAM collection number P49520, slide 1265.57-19A, coordinate V32-4, depth of 1,265.57 m, Giles 1 drill core, Alinya Formation.
Diagnosis
Optically dense, organic-walled microfossils with abundant (7 to 10 processes visible in a 10 µm section of vesicle periphery) processes that are ~2 µm long, solid, and conical, narrowing from a ~0.8 µm diameter base to a ~0.4 µm diameter tip. Smooth-walled outer envelope occasionally preserved. Processes do not support or connect to the outer envelope.
Occurrence
See Remarks section for details of possible occurrences.
Description
Organic-walled microfossils with optically dense vesicles ranging in diameter from 23.7 to 59.6 µm (
 $${\rm \bar{x}}=36.3\,{\rm \mu m}$$
, s=8 µm, N=37), bearing abundant short, solid, conical processes that range in length from 1.0 to 3.3 µm (
 $${\rm \bar{x}}=1.9\,{\rm \mu m}$$
, s=0.6 µm, N=37). Solid character was determined in SEM by observation of stumps upon the vesicle left by broken processes (e.g., arrow in Fig. 9.8). Processes narrow from the base (0.8 µm) to a blunt tip (~0.4 µm); rarely, specimens are seen to possess processes with bulbous terminations in addition to conical processes (Fig. 9.4). Processes are typically straight, but rarely a few are seen to be bent (not broken; arrows in Fig. 9.2, 9.3), possibly indicating a plastic, rather than brittle, character. Smooth outer envelope is occasionally preserved (Fig. 9.1, 9.2).
Etymology
In reference to the fossil’s discovery in units of Officer Basin, Australia.
Material examined
Thirty-seven specimens from the Alinya Formation, Giles 1 drill core depths 1,265.46, 1,265.57, and 1,265.71 m.
Remarks
The specimens described here from the Alinya Formation resemble fragmentary acritarch fossils from the Draken (Knoll et al., Reference Knoll, Swett and Mark1991) and Svanbergfjellet formations (Butterfield et al., Reference Butterfield, Knoll and Swett1994) in that all of these forms bear small, solid, conical processes. The Draken and Svanbergfjellet specimens were assigned to the genus Gorgonisphaeridium, an almost entirely Paleozoic genus with a broad diagnosis that indicates the spines are “solid, usually sinuous, slender or broad … tips simple or distally branched, flexible, bases may be slightly bulbous” (Staplin et al., Reference Staplin, Jansonius and Pocock1965). Knoll and colleagues (Reference Knoll, Swett and Mark1991) created a new combination, Gorgonisphaeridium maximum, based on the single, solid-process bearing Draken specimen and seemingly similar fossils from the Ediacaran age Doushantuo Formation. However, subsequent study of the Doushantuo specimens revealed a hollow character to the processes, and the combination was recognized as invalid (Knoll, Reference Knoll1992, p. 765). The genus Echinosphaeridium (later renamed Knollisphaeridium by Willman and Moczydłowska, Reference Willman and Moczydłowska2008) was then erected for large acritarchs with densely arranged, hollow processes, excluding the solid-process-bearing Draken specimen. Butterfield and colleagues (Reference Butterfield, Knoll and Swett1994) left a similar form in open nomenclature, Gorgonisphaeridium sp. Both the Draken and Svanbergfjellet specimens resemble those described here, save the near order-of-magnitude difference in vesicle diameters.
The new genus Morgensternia is erected here to accommodate the new species M. officerensis due to dissimilarity with species of Gorgonisphaeridium such as the presence of an outer envelope, a general lack of flexibility to the spines, an absence of branching, and shorter and more numerous processes in this new species.
Cymatiosphaeroides kullingii is another form bearing short, thin, solid processes and having an outer envelope (up to twelve envelopes according to the emended diagnosis of Butterfield and colleagues, Reference Butterfield, Knoll and Swett1994). However, C. kullingii differs from Morgensternia officerensis not only by its tendency toward much greater vesicle dimensions (30–350 µm) but, more important, by its diagnostic thickening of its processes at both the base and apex and the connection of the processes to the outer vesicle (Knoll et al., Reference Knoll, Swett and Mark1991). M. officerensis specimens do not indicate connection between the processes and outer vesicle.
Certain specimens illustrated from the Neoproterozoic Liulaobei and Gouhou formations of North China (pl. 5, figs. A–L; Zang and Walter, Reference Zang and Walter1992) appear comparable to the forms described here as M. officerensis. Zang and Walter describe the processes as hollow in character and communicating freely with the vesicle interior, an interpretation difficult to reconcile with the images provided. This interpretation contrasts with that of solid processes in M. officerensis of the Alinya Formation. In addition, Yin and Sun (Reference Yin and Sun1994) suggest, because of a lack of flattening, that the Liulaobei and Gouhou specimens may actually be modern contaminants. These fossils would be placed in synonymy only if future investigation assures a Neoproterozoic provenance and reveals a shared hollow or solid character for processes of both the Australian and Chinese forms.
M. officerensis is considered to fall outside of Lanulatisphaera laufeldii due to its conical and nonfusing processes, more optically dense vesicle, and somewhat smaller vesicle diameter of the former. In addition, the nano-scale mammillar ornament of L. laufeldii (Figs. 9.9, 10) is not seen in M. officerensis.
Genus Navifusa Combaz, Lange, and Pansart, Reference Combaz, Lang and Pansart1967 ex Eisenack, Reference Eisenack1976
Type species
Navifusa navis (Eisenack Reference Eisenack1938) Eisenack, Reference Eisenack1976
Navifusa majensis Pyatiletov, Reference Pyatiletov1980
1980 Navifusa majensis Reference PyatiletovPyatiletov, p. 144, fig. 1.
1994 Navifusa majensis; Reference Hofmann and JacksonHofmann and Jackson, p. 20, fig. 15.1–15.4.
1995 Lakhandinna dilatata; Reference ZangZang, p. 165, fig. 29A, ?D, ?G.
1995 Archaeoellipsoides karatavicus; Reference ZangZang, p. 162, fig. 29H, J, K.
1999 Navifusa majensis; Reference Samuelsson, Dawes and VidalSamuelsson, Dawes, and Vidal, fig. 5A.
2001 Navifusa majensis; Reference Samuelsson and ButterfieldSamuelsson and Butterfield, fig. 5A.
2005 Navifusa majensis; Reference Prasad, Uniyal and AsherPrasad, Uniyal, and Asher, figs. 3.10, 5.15, ?7.1.
2011 Navifusa majensis; Reference Couëffé and VecoliCouëffé and Vecoli, fig. 6.7.
2013 Navifusa majensis; Reference Tang, Pang, Xiao, Yuan, Ou and Wan.Tang et al., fig. 5H.
2016 Navifusa majensis; Porter and Riedman, p. 833, fig. 13.1.
Holotype
(Pyatiletov, Reference Pyatiletov1980; fig. 1a), ИГиГ СО АН СССР, preparation number 685 from Khabarovsk Krai, left bank of Maya River, Mesoproterozoic to Neoproterozoic Lakhanda Group, third subsuite, Russia.
Occurrence
Navifusa majensis is widely distributed in units of late Mesoproterozoic to early Neoproterozoic age, including the Lakhanda Group of Siberia (Pyatiletov, Reference Pyatiletov1980), the Bylot Supergroup of Arctic Canada (Hofmann and Jackson, Reference Hofmann and Jackson1994), the Thule Supergroup of Greenland (Samuelsson et al., Reference Samuelsson, Dawes and Vidal1999), the Lone Land Formation of northwestern Canada (Samuelsson and Butterfield, Reference Samuelsson and Butterfield2001), the Vindhyan Supergroup of Central India (Prasad et al., Reference Prasad, Uniyal and Asher2005), the Kwahu Group of Ghana (Couëffé and Vecoli, Reference Couëffé and Vecoli2011), and the Liulaobei Formation of North China (Tang et al., Reference Tang, Pang, Xiao, Yuan, Ou and Wan.2013).
Description
Ellipsoidal organic-walled microfossils with a mean length of 63.3 µm and mean width of 28.0 µm (length range 39.9 to 118.0 µm, width range 16.2 to 78.9 µm). Mean length-to-width ratio is 2.5, varying from 1.5 to 4.1 (N=9).
Material examined
Nine specimens from the Alinya Formation, Giles 1 drill core depths 1,255.43, 1,265.57, and 1,266.31 m.
Remarks
One specimen (Fig. 11.9, 11.11) bears subtle transverse annulations in its center, a feature suggestive of Pololeptus rugosus described from the Liulaobei Formation (Yin and Sun, Reference Yin and Sun1994; Tang et al., Reference Tang, Pang, Xiao, Yuan, Ou and Wan.2013). The genus Pololeptus was erected by Yin (in Yin and Sun, Reference Yin and Sun1994) to accommodate oval-shaped, organic-walled microfossils with patches of characteristic “worm-like or netted sculptures” (p. 101). Tang and colleagues (Reference Tang, Pang, Xiao, Yuan, Ou and Wan.2013) synonymized the three species of this genus and emended the diagnosis of the remaining species, P. rugosus, to include the newly discovered character of transverse annulations. The single annulated specimen recovered from the Alinya Formation does not bear the characteristic terminal sculpture described by Yin and Sun (Reference Yin and Sun1994) and Tang et al. (Reference Tang, Pang, Xiao, Yuan, Ou and Wan.2013) and is narrower than the Liulaobei specimens (19 µm wide, 53 µm long as compared to 30–145 µm wide and 40–280 µm long in Liulaobei Formation). For these reasons, we are hesitant to assign the name P. rugosus to this one specimen.
Genus Pterospermopsimorpha Timofeev, Reference Timofeev1966 emend. Mikhailova and Jankauskas (in Jankauskas et al., Reference Jankauskas, Mikhailova and Hermann1989)
Type Species
Pterospermopsimorpha pileiformis Timofeev, Reference Timofeev1966.
Remarks
The diagnosis followed here is from Jankauskas and colleagues (Reference Jankauskas, Mikhailova and Hermann1989). The fossils are described as consisting of two spheroidal to ellipsoidal vesicles, one within the other. The diameter of the inner vesicle is not less than two-thirds the diameter of the outer. Vesicle diameters range from 10 to 500 µm for the outer and 8 to 400 µm for the inner.
This genus, like many morphologically simple acritarch genera, is almost certainly polyphyletic. Thus, interpretations of biological or ecological significance of the presence or absence of members of this genus warrant caution.
Pterospermopsimorpha, a dispheromorph, is often confused with the pteromorph genus, Simia. See Simia remarks section for details.
Pterospermopsimorpha insolita Timofeev, Reference Timofeev1969 emend. Mikhailova (in Jankauskas et al., Reference Jankauskas, Mikhailova and Hermann1989)
(1–5) Simia annulare: (3, 5) note tears extending from equatorial flap into central portion. (6–9) Pterospermopsimorpha insolita: (6, 9) note wrinkles and folds in outer vesicle; (7–9) note tears in outer vesicle. Scale bar=50 µm. Slide and coordinates: (1) 1244.17-14B/F16-1 (P49471); (2) 1244.17-14B/N36-2 (P49472); (3) 1244.17-14B/O34-0 (P49473); (4) 1244.17-14B/E31-0 (P49474); (5) 1244.17-14A/H22-0 (P49468); (6) 1244.17-14B/N36-2 (P49475); (7) 1237.74-12/O25-3 (P49466); (8) 1265.71-105A/Q38-3 (P49554); (9) 1265.71-105A/P11-2 (P49555).

1969 Pterospermopsimorpha insolita Reference TimofeevTimofeev, p. 16, pl. 3, fig. 8.
1989 Pterospermopsimorpha insolita; Mikhailova in Reference Jankauskas, Mikhailova and HermannJankauskas, Mikhailova, and Hermann, p. 49, pl. 3, figs. 5, 6 (see for additional synonymy).
1994 Pterospermopsimorpha insolita; Reference Hofmann and JacksonHofmann and Jackson, p. 24, fig. 17.10–17.13.
?1997 ?Pterospermopsimorpha sp.; Reference CotterCotter, p. 266, fig. 8H.
1999 Pterospermopsimorpha insolita; Reference CotterCotter, p.76, fig. 7B.
?1999 Simia annulare; Reference Samuelsson, Dawes and VidalSamuelsson, Dawes, and Vidal, fig. 7A.
2005 Pterospermopsimorpha insolita; Reference Prasad, Uniyal and AsherPrasad, Uniyal, and Asher, pl. 3, figs. 7, 9, pl. 5, fig. 17.
2009 Pterospermopsimorpha insolita; Reference Nagy, Porter, Dehler and ShenNagy, Porter, Dehler, and Shen, fig. 1E.
?2011 Pterospermopsimorha insolita; Reference Couëffé and VecoliCouëffé and Vecoli, fig. 6.6.
Holotype
Holotype designated by Timofeev (Reference Timofeev1969, p. 16, pl. 3, fig. 8 from Turukhansk area on Tunguska River, preparation number 16/5, Biostratigraphy Laboratory ИГГД АН СССР) was reported by Jankauskas and colleagues (Reference Jankauskas, Mikhailova and Hermann1989, p. 49) as lost; they selected preparation number 16/42 from the same location for the lectotype (Jankauskas, 1989; p. 49, pl. 3, fig. 6).
Occurrence
A common and widely distributed component of organic-walled microfossil assemblages ranging from Mesoproterozoic to early Paleozoic in age (discussed in Hofmann and Jackson, Reference Hofmann and Jackson1994). Reported occurrences include units of Siberia (Timofeev, Reference Timofeev1969; Jankauskas et al., Reference Jankauskas, Mikhailova and Hermann1989), the Bylot Supergroup of Canada (Hofmann and Jackson, Reference Hofmann and Jackson1994), the Vindhyan Supergroup of India (Prasad et al., Reference Prasad, Uniyal and Asher2005), the Chuar Group of western United States (Nagy et al., Reference Nagy, Porter, Dehler and Shen2009); and Kanpa, Hussar, and Browne formations of western Officer Basin, Australia (Cotter, Reference Cotter1999).
Description
Spheroidal organic-walled microfossils of vesicle-within-vesicle construction. Diameters of inner vesicles range from 16.9 to 64.3 µm (
 $${\rm \bar{x}}=35.7\,{\rm \mu m}$$
, s=12.7 µm), diameters of outer vesicles from 25.0 to 97.4 µm (
 $${\rm \bar{x}}=42.5\,{\rm \mu m}$$
, s=16.9 µm).
Material examined
Thirty-seven specimens from Alinya Formation, Giles 1 drill core depths 1,237.74, 1,244.17, 1,248.91, 1,255.76, 1,257.73, 1,265.36, 1,265.57, 1,265.71, and 1,266.31 m.
Genus Simia Mikhailova and Jankauskas (in Jankauskas et al., Reference Jankauskas, Mikhailova and Hermann1989)
Type Species
Simia simica (Jankauskas, Reference Jankauskas1980) Jankauskas et al., Reference Jankauskas, Mikhailova and Hermann1989.
Description
Organic-walled microfossils with spheroidal to discoidal central bodies 20 to 300 µm in diameter and bearing an equatorial flange of widths 5 to 30 µm.
Remarks
There is much confusion in the literature regarding the genus Simia and how it differs from the genus Pterospermopsimorpha. The main difference between these two genera is easily recognized in principle; Simia is a spheroidal to discoidal body bearing an equatorial flange, not unlike a ballerina’s tutu, whereas Pterospermopsimorpha is a dispheromorph, an acritarch composed of sphere-within-a-sphere construction. However, accurate fossil identification is problematic because Simia fossils are preserved as flattened bodies viewed from the poles, not the equator (as the ‘equator’ is represented by the great circle of the flange or ‘tutu’). Part of this confusion may likely be attributed to the unfortunate choice of the name Pterospermopsimorpha, a name misleadingly suggestive of the pteromorph (wing or flap-bearing) acritarchs (Downie et al., Reference Downie, Evitt and Sarjeant1963).
In practical terms, certain characters aid in distinguishing these two forms. Convenient wrinkles, folds, and tears (e.g., radial cracking of the internal body independently of the external envelope; Fig. 12.8, 12.9) can often suggest the presence of two nested vesicles. In addition, if the fossil’s opacity remains more or less consistent from the center to the edge, one would expect this to be indicative of Simia. In a dispheromorph such a Pterospermopsimorpha, one would expect the central region to be darker in transmitted light; in this area the light must pass through four vesicle layers, as opposed to only two nearer its edges. This is in contrast to the two layers in the central body of a pteromorph such as Simia and the one or two layers at its edges.
Simia annulare (Timofeev, Reference Timofeev1969) Mikhailova (in Jankauskas et al., Reference Jankauskas, Mikhailova and Hermann1989)
1969 Pterospermopsimorpha annulare Reference TimofeevTimofeev, p. 17, pl. 3, fig. 9.
1989 Simia annulare; Mikhailova in Reference Jankauskas, Mikhailova and HermannJankauskas, Mikhailova, and Hermann, p. 66, pl. 6, figs. 5–8.
?1992 Simia annulare; Reference Zang and WalterZang and Walter, p. 307, pl. 7, figs. A–B.
1995 Simia annulare; Reference ZangZang, fig. 28E.
1999 Simia annulare; Cotter, Reference Cotter1999, p. 77, fig. 7H.
1999 Simia annulare; Reference Samuelsson, Dawes and VidalSamuelsson, Dawes, and Vidal (in part), figs. 7B–E, non 7A.
?2005 Simia annulare; Reference Prasad, Uniyal and AsherPrasad, Uniyal, and Asher, p. 46, pl. 3, fig. 8, pl. 5, fig. 9.
2009 Ostiumsphaeridium complitum Reference Vorob’eva, Sergeev and KnollVorob’eva, Sergeev, and Knoll, p. 186, fig. 14.1–14.5.
2013 Simia annulare; Reference Tang, Pang, Xiao, Yuan, Ou and Wan.Tang et al., fig. 4F–G.
Holotype
(Timofeev, Reference Timofeev1969; pl. 3, fig. 9), preparation number 147/4 of Biostratigraphy Laboratory ИГГД АН СССР, Riphean Kildinskaya Suite.
Occurrence
Occurrences are difficult to establish from published reports due to confusion between Simia and Pterospermopsimorpha species. S. annulare appears to range from the late Mesoproterozoic into at least the middle Ediacaran Period. This form has been reported from the Thule Supergroup of Greenland (Samuelsson et al., Reference Samuelsson, Dawes and Vidal1999), Vychegda Formation of eastern Russia (Vorob’eva et al., Reference Vorob’eva, Sergeev and Knoll2009), and Liulaobei Formation of North China (Tang et al., Reference Tang, Pang, Xiao, Yuan, Ou and Wan.2013).
Description
Organic-walled microfossils 20.4 to 209.5 µm in diameter (
 $${\rm \bar{x}}=81.4\,{\rm \mu m}$$
, s=37.5 µm, N=44), spheroidal to discoidal central bodies bearing an equatorial flange of width 3.3 to 32.4 µm (
 $${\rm \bar{x}}=9.4\,{\rm \mu m}$$
, s=5.6 µm) that is 5% to 20% the diameter of the central body.
Material examined
Forty-four specimens from Alinya Formation, Giles1 drill core depths 1,237.74, 1,242.84, 1,244.17, 1,248.91, and 1,265.57 m.
Remarks
Specimens of Simia annulare described in this study are closely comparable to those identified as Ostiumsphaeridium complitum (Vorob’eva et al., Reference Vorob’eva, Sergeev and Knoll2009), which is considered here to be a junior synonym of S. annulare. O. complitum was described as a spheroidal to subspheroidal vesicle with a distinctive slit-like opening that causes the vesicle to pop open and “forms a flap that surrounds [the] vesicle like a halo 10–30 µm wide with a fringed margin” (Vorob’eva et al., Reference Vorob’eva, Sergeev and Knoll2009; p. 186). The formation of this halo or flange is problematic as even a flexible spheroidal membrane, when everted, will exhibit radial splits, not form a continuous border. In addition, if the equatorial flange is formed by the opened vesicle, the split itself should no longer be visible on the specimen; instead there should be only a roughly circular sheet of vesicle with radial splitting that occurred during eversion. Instead, specimens of O. complitum exhibit a spheroidal central body surrounded by a fringed border; this accords well with the diagnosis of S. annulare, although requiring an increase in diameter for the species description. The identification of these forms with the larger Simia species, S. nerjenica Veis, 1989 in Jankauskas et al., Reference Jankauskas, Mikhailova and Hermann1989, was rejected due to their lack of the characteristic 4 to 6 concentric folds surrounding the central body and a general dissimilarity with the S. nerjenica holotype (Jankauskas et al., Reference Jankauskas, Mikhailova and Hermann1989, pl. 9, fig. 10). Specimens from the Alinya Formation lack the slit-like opening that Vorob’eva and colleagues considered diagnostic of O. complitum, but these forms are similar in dimension and presence of a fringed equatorial border.
Genus Valeria Jankauskas, Reference Jankauskas1982
Type Species
Valeria lophostriata Jankauskas (Reference Jankauskas1979) Reference Jankauskas1982.
Valeria lophostriata Jankauskas (Reference Jankauskas1979) 1982
1979 Kildinella lophostriata Reference JankauskasJankauskas, p. 53, fig. 1.13–1.15.
1982 Valeria lophostriata; Reference JankauskasJankauskas, p. 109, pl. 39, fig. 2.
1989 Valeria lophostriata; Reference Jankauskas, Mikhailova and HermannJankauskas in Jankauskas, Mikhailova, and Hermann, p. 86, pl. 16, figs. 1–5 (see for additional synonymy).
1995 Valeria lophostriata; Reference ZangZang, p. 170, fig. 28I.
1999 Valeria lophostriata; Reference Samuelsson, Dawes and VidalSamuelsson, Dawes, and Vidal, fig. 8E.
2001 Valeria lophostriata; Reference Javaux, Knoll and WalterJavaux, Knoll, and Walter, fig 1D.
2009 Valeria lophostriata; Reference Nagy, Porter, Dehler and ShenNagy, Porter, Dehler, and Shen, fig. 1a, b.
2009 Valeria lophostriata; Reference NagovitsinNagovitsin, p. 144, fig. 4E.
?2011 Valeria lophostriata; Reference Couëffé and VecoliCouëffé and Vecoli, fig. 6.4.
?2012 dark-walled megaspheric coccoid; Reference Battison and BrasierBattison and Brasier , fig. 8B.
2016 Valeria lophostriata; Porter and Riedman, p. 842, figs. 19.1–19.3
(For additional synonymy, see also Hofmann, Reference Hofmann1999, table 1)
Holotype
(Jankauskas, Reference Jankauskas1979; fig. 1.14), Lithuanian Geological Prospecting Research Institute, number 16-62-4762/16, sp. 1, DH Kabakovo 62 drill core, depth 4,762 to 4,765 m, Zigazino-Komarovo suite, middle Riphean.
Occurrence
Widely distributed in late Paleoproterozoic through early (pre-Sturtian glacial) Neoproterozoic rocks.
Description
Spheroidal organic-walled microfossils bearing distinctive sculpture of parallel ridges, similar to corduroy fabric. Vesicle diameters range from 50.4 to 119.0 µm (
 $${\rm \bar{x}}=79.3\,{\rm \mu m}$$
, s=26.2 µm, N=13); ridges are ~0.5 µm apart.
Material examined
Fourteen specimens from Alinya Formation, Giles1 drill core depths 1,265.46, 1,265.57, and 1,265.71 m.
Genus Vidalopalla new genus
Type species
Vidalopalla verrucata (Vidal in Vidal and Siedlecka, Reference Vidal and Siedlecka1983) n. comb., by monotypy.
Diagnosis
Spheroidal organic-walled microfossil bearing more or less regularly arranged, solid, small (typically 1 to 2 µm in diameter), hemispherical verrucate external ornament.
Etymology
Named in honor of the Precambrian paleontologist Gonzalo Vidal with the addition of the Greek, palla, describing the spherical form of the fossils.
Remarks
The genus Vidalopalla is erected here to accommodate the species V. verrucata (= Kildinosphaera verrucata). Originally erected in 1983 by Vidal (in Vidal and Siedlecka, 1983) as a species of the new genus Kildinosphaera, K. verrucata was born into limbo. In erecting Kildinosphaera and naming one of its constituent species as Kildinosphaera lophostriata (transferring it from Kildinella), Vidal and Siedlecka unknowingly transferred the newly minted type species of the genus Valeria that Jankauskas (Reference Jankauskas1982) had created less than a year previous. This caused the genus Kildinosphaera to instantaneously become a junior (homotypic) synonym of Valeria. The other species Vidal and Siedlecka named to Kildinosphaera (K. chagrinata, K. granulata, and K. verrucata) were left homeless—validly published but belonging to an illegitimate genus. In 1990, Fensome and colleagues suggested a new combination, placing ‘K.’ verrucata into the genus Valeria as V. tschapomica. This specific epithet was chosen in light of implications in the species remarks by Vidal and Siedlecka (Reference Vidal and Siedlecka1983) and the more formal recommendation by Amard (Reference Amard1984) that Kildinosphaera verrucata was synonymous with the earlier named form Kildinella tschapomica Timofeev Reference Timofeev1966 (Amard also suggested synonymy with Kildinella exsculpta Timofeev, Reference Timofeev1969, but K. tschapomica would have priority if these forms were truly synonymous). The recommendation of Fensome and colleagues (Reference Fensome, Williams, Barss, Freeman and Hill1990), and suggested synonymies of Amard (Reference Amard1984), are rejected here, as done tacitly by others such as Knoll (Reference Knoll1994) and Butterfield and Rainbird (Reference Butterfield and Rainbird1998). The ornaments of K. tschapomica and K. exsculpta appear to be diagenetically introduced features on a smooth-walled acritarch belonging to the form genus, Leiosphaeridia (Knoll, Reference Knoll1996, p.70).
Samuelsson and colleagues (Reference Samuelsson, Dawes and Vidal1999) informally suggested the transfer of ‘K.’ verrucata to the genus Lophosphaeridium. This suggestion is not taken here because the descriptions of the genus and type species, although broadly permissive (“thick, knobby envelope,” Timofeev, Reference Timofeev1969, p. 29), are so broad as to include a number of other genera, and the illustration of the holotype material, a hand-drawn figure (plate 2, fig. 5, Timofeev, Reference Timofeev1959), appears to show the tubercles as hollow protuberances of the vesicle rather than solid verrucae as diagnostic of the new genus Vidalopalla.
Vidalopalla verrucata (Vidal and Siedlecka, Reference Vidal and Siedlecka1983) new combination
1981 Kildinella sp. B; Reference VidalVidal, p. 26, fig. 13 A–D.
1983 Kildinosphaera verrucata Reference Vidal and SiedleckaVidal and Siedlecka, p. 62, fig. 5C.
?1984 Kildinosphaera verrucata; Reference AmardAmard, p. 1406, fig. 3C.
1985 Kildinosphaera verrucata; Reference Vidal and FordVidal and Ford, p. 363, fig. 4A.
?1990 Leiosphaeridia exculpta (sic); Reference HermannHermann, pl. 1, fig. 3.
?1992 Leiosphaeridia verrucata; Reference Zang and WalterZang and Walter, p. 68, fig. 52I, non 50I.
Non 1994Kildinosphaera verrucata; Reference Yin and SunYin and Sun, p. 100, figs. 5I, 5J, 7A.
1996 Kildinosphaera verrucata; Reference KnollKnoll, p. 70, pl. 4, fig. 5.
?1999 Lophosphaeridium sp. A; Reference Samuelsson, Dawes and VidalSamuelsson, Dawes, and Vidal, figs. 4E and 4H.
?2005 Kildinosphaera verrucata; Reference Prasad, Uniyal and AsherPrasad, Uniyal, and Asher, figs. 7.19, 8.12, 11.15.
non 2009?Kildinosphaera verrucata; Reference Nagy, Porter, Dehler and ShenNagy, Porter, Dehler, and Shen, fig.1F.
?2011 Lophosphaeridium sp.; Reference Strother, Battison, Brasier and WellmanStrother, Battison, Brasier, and Wellman , fig. 1C–D.
?2016 Vidalopalla cf. verrucata; Porter and Riedman, p. 842, fig. 20.1.
Holotype
(Vidal Reference Vidal1981; p. 26, fig. 13A–D), specimen E74–02: V/47 from the Neoproterozoic Ekkerøy Formation. Designated by Vidal and Siedlecka (Reference Vidal and Siedlecka1983).
Occurrence
Occurs as an occasional component of early Neoproterozoic organic-walled microfossil assemblages. Distribution includes Vadsø and Barents Sea groups of East Finnmark (Vidal and Siedlecka, Reference Vidal and Siedlecka1983) and Baffin Bay Group of Greenland (Samuelsson et al., Reference Samuelsson, Dawes and Vidal1999). Occurrence of this species was reported from the Wynniatt Formation of Arctic Canada (Butterfield and Rainbird, Reference Butterfield and Rainbird1998), but no fossils were figured.
Description
Spheroidal organic-walled microfossil with vesicle of moderate opacity, ~50 µm in diameter (range 25.8 µm to 68.6 µm,
 $${\rm \bar{x}}=50.4\,{\rm \mu m}$$
, s=17.8 µm, N=4) with circular to ellipsoidal solid verrucae ~1 µm in diameter (range 0.7 to 1.3 µm,
 $${\rm \bar{x}}=0.9\,{\rm \mu m}$$
, s=0.3 µm, N=4) on the exterior of vesicle.
Material examined
Four specimens from the Alinya Formation, Giles 1 drill core depths 1,244.17, 1,265.46, and 1,265.57 m.
Basionym
Kildinosphaera verrucata Vidal (in Vidal and Siedlecka, Reference Vidal and Siedlecka1983, p. 62).
Remarks
The Alinya specimens are somewhat smaller than those of the Ekkerøy Formation (Vidal, Reference Vidal1981; 40–132 µm) and somewhat larger than those of the Atar Formation (Amard, Reference Amard1984; 24–40 µm) but are generally in accordance with both.
Vidal (Reference Vidal1976) reports Stictosphaeridium verrucatum from the upper Visingsö beds of southern Sweden, but the specimen figured does not conform to the concept of V. verrucata (= K. verrucata) that he and Anna Siedlecka described from the Båtsfjord Formation of the Barents Sea Group, Norway. Instead, the specimen appears to be a leiosphaerid that may bear sparse, possibly taphonomically induced spots or bumps. Vidal (Reference Vidal1979) also reports S. verrucatum from the Eleonore Bay Group of East Greenland, but no specimens were figured.
Vidalopalla verrucata can be distinguished from Coneosphaera arctica because the former bears ~1 to 2 µm solid, hemispherical vesicular ornament, whereas the latter is distinguished by bearing loosely aggregated, irregularly distributed, hollow spheroids about one-eight to one-tenth the diameter of the main vesicle.
Genus Volleyballia Porter and Riedman, Reference Porter and Riedman2016
Type species
Volleyballia dehlerae Porter and Riedman 2016, by monotypy.
Remarks
The striae of Volleyballia dehlerae are dissimilar from those of Karenagare alinyaensis n. gen, n. sp. in that K. alinyaensis bears wide, parallel, undulating ripple-like striations (Fig. 5.1–5.5) rather than ruts or gouges that incise the vesicle of V. dehlerae (Fig. 5.9–5.14).
Volleyballia dehlerae Porter and Riedman 2016
?1995 Striasphaera radiata Reference Gao, Xing and LiuGao, Xing, and Liu, p. 14, 20, fig. 2.10, 2.11.
1999 ?Leiosphaeridia sp.; Reference CotterCotter, fig. 8H.
?2000 Form 1; Reference Simonetti and FairchildSimonetti and Fairchild, p. 25, fig. 8S.
?2009 Unnamed form A; Reference Nagy, Porter, Dehler and ShenNagy, Porter, Dehler, and Shen, fig. 4D.
2016 Volleyballia dehlerae Porter and Riedman, p. 844, fig. 21.1–21.7.
Holotype
(Porter and Riedman, Reference Porter and Riedman2016; fig. 16.1–16.3), UCMP 36080d, sample SP14-63-11, SEM slide=ker-2, EF=Q49. Neoproterozoic Tanner Member, Chuar Group, Grand Canyon, USA.
Occurrence
This form is comparable to those reported from early Neoproterozoic units in the Chuar Group, USA (Nagy et al., Reference Nagy, Porter, Dehler and Shen2009; Porter and Riedman, Reference Porter and Riedman2016), Officer Basin, Australia (Cotter, Reference Cotter1999), a Mesoproterozoic unit of northeastern China (Gao et al., Reference Gao, Xing and Liu1995) and a poorly constrained unit considered an equivalent of the Mesoproterozoic Conselheiro Mata Group of Brazil (Simonetti and Fairchild, Reference Simonetti and Fairchild2000).
Description
Spheroidal organic-walled microfossils 20.1 to 35.4 µm in diameter (
 $${\rm \bar{x}}=26.2\,{\rm \mu m}$$
, s=3.8 µm, N=15) bearing linear striations 0.9 to 1.8 µm wide (
 $${\rm \bar{x}}=1.2\,{\rm \mu m}$$
, s=0.2 µm, N=15) as measured from crest to crest on vesicle surface. Vesicle optically dense. Groups of two to four striae frequently oriented at opposing angles to each other. Individual striae are typically visible for less than half the diameter of the vesicle surface. SEM specimens indicate the presence of unornamented outer envelope that may obscure the identity of this fossil, the additional layers serving to make some specimens opaque in transmitted light microscopy.
Material examined
Fifteen specimens from the Alinya Formation, Giles1 drill core depths 1,255.43, 1,265.46, 1,265.57 m.
Unnamed Acritarch species A
?1978 cells and endospores; Reference Peat, Muir, Plumb, McKirdy and NorvickPeat, Muir, Plumb, McKirdy, and Norvick, fig. 5B, D.
?1999 Coneosphaera sp. cf. C. arctica; Reference CotterCotter, p. 72, fig. 7E.
Description
Spheroidal organic-walled microfossils 32.8 to 47.5 µm in diameter (
 $${\rm \bar{x}}=36.9\,{\rm \mu m}$$
, s=7.1 µm, N=4), bearing dark spots 2.1 to 3.7 µm in diameter (
 $${\rm \bar{x}}=2.9\,{\rm \mu m}$$
, s=0.7 µm, N=4) on vesicle.
Material examined
Four specimens from the Alinya Formation, Giles 1 drill core depths 1,242.84, 1,255.43, and 1,265.71 m.
Remarks
These specimens possess dark spots on the vesicle, but since none of these occur along the periphery, it cannot be confirmed that these project from the vesicle surface as would processes or verrucae. It is possible these spots indicate variations in composition or density of the vesicle.
These specimens were not placed into the genus Lophosphaeridium Timofeev, Reference Timofeev1959 ex Downie Reference Downie1963 because that genus appears to have hollow protuberances from the vesicle, a feature inconsistent with these Alinya specimens.
Unnamed Acritarch species B
Description
A single specimen of an optically dense, spheroidal, organic-walled acritarch bearing frequent (2 to 3 per 10 µm of vesicle periphery) tubular processes. Vesicle is 26.9 µm in diameter and processes are 2 µm in width and up to 3 µm in length, although they have probably been shortened by breakage.
Material examined
Single specimen from the Alinya Formation, Giles 1 drill core depth 1,242.84 m.
Remarks
This specimen is somewhat similar to two recovered from the upper Svanbergfjellet Formation (Butterfield et al., Reference Butterfield, Knoll and Swett1994, fig. 14F, G) and left in open nomenclature as Goniosphaeridium sp. With only one specimen recovered from the Alinya material, we hesitate to formally assign a taxonomic home.
Unnamed Acritarch species C
Description
A single specimen of an optically dense, ellipsoidal, organic-walled acritarch measuring 24.9 µm by 34.6 µm and bearing a single neck-like structure that extends from the main vesicle; structure is 7.0 µm wide at base and extends 3.0 µm, tapering to 3.8 µm at what may be a broken tip.
Material examined
Single specimen from the Alinya Formation, Giles 1 drill core depth 1,255.43 m.
Unnamed Acritarch species D
Description
Three specimens of spheroidal, organic-walled acritarchs 30.6 to 47.9 µm diameter that bear frequent but variable processes that are up to 3.0 µm in length and less than 0.5 µm in width and that show occasional bifurcation (Fig. 4.7 [left-hand black arrow], 4.8). In transmitted light microscopy, bifurcation of the processes can be difficult to distinguish from overlap of adjacent processes (Fig. 4.7, right-hand black arrow).
Material examined
Three specimens from the Alinya Formation, Giles 1 drill core depth 1,255.76, 1,265.46, and 1,265.57 m.
Remarks
These specimens share some resemblance with forms from the 750–850 Ma Wynniatt Formation of northwestern Canada. Butterfield (Reference Butterfield2005) identified those forms as Tappania sp., a fossil genus previously known only from Paleo- and Mesoproterozoic units. Javaux (Reference Javaux2011) has cited uncertainty about the assignment of the Wynniatt fossils to Tappania as the Wynniatt fossils lack the diagnostic neck-like extension and possess distinctive distal fusion not seen in the type material (a feature Butterfield, Reference Butterfield2005, suggested may have been destroyed by laboratory processing of the older materials). The occurrence of occasional septae in the processes is a feature shared by the Mesoproterozoic and Wynniatt forms (not seen in the Alinya specimens).
The fossils recovered from the Alinya Formation do not conform well to the description of Tappania species from the Paleoproterozoic (He et al., Reference He, Zhao, Sun and Xia2009; Su et al., Reference Su, Li, Xu, Jia, Geng, Zhou, Wang and Pu2012) Ruyang Group type material (Yin, Reference Yin1997) or from the somewhat younger Roper Group (1.5 Ga; Javaux et al., Reference Javaux, Knoll and Walter2001). Although the vesicles of the Alinya fossils are only slightly smaller, the processes of the Alinya forms are significantly narrower than those described for these Mesoproterozoic Tappania species. In addition, the fossils described here do not possess the diagnostic neck-like protrusion.
The fossils described here are smaller but in keeping with the vesicle and process diameters of the Wynniatt material and demonstrate the irregularly furcating processes of both the Wynniatt ‘Tappania’ and Tappania spp. of Yin (Reference Yin1997) and Javaux and colleagues (Reference Javaux, Knoll and Walter2001). In addition, the broad extension of the vesicle into a conical base of a process as seen in the Wynniatt fossils is seen in one of the Alinya specimens (Fig. 4.7, white arrow). No fusion of the processes is seen in the Alinya material. The ends of the processes of the SEM specimens are unbroken and lobe-shaped; a similar feature is seen in some specimens of ‘Tappania’ (Butterfield, Reference Butterfield2005; figs. 3A, B, 7B).
Unnamed Acritarch species E
Description
A single specimen of an organic-walled, probably originally spheroidal acritarch measuring 31.6 µm across and bearing frequent, irregularly distributed hemispherical bodies (0.6 to 1.0 µm in diameter) as well as processes up to 1.5 µm in length and 0.6 to 0.8 µm in width. Processes may originate as hemispherical bodies. In addition to these features, this specimen bears a number of what appear to be ruptured blisters; these have centers of about 0.7 µm diameter and a flaring collar that extends 1.5 to 3.0 µm away from the center (Fig. 4.13). It is currently unclear whether this feature is primary or is a result of heterotrophic degradation.
Material examined
Single specimen from the Alinya Formation, Giles 1 drill core depth 1,265.57 m.
Unnamed Acritarch species F
Figures 13.1–13.3, 13.11, 14
(1–3, 11) Unnamed Acritarch sp. F. (2) Note the darkened spot has a tear in the lower left quadrant through which the back side of the sphaerical vesicle is visible; in (3) the cell has torn across the darkened spot. (4, 5, 9) Unnamed Acritarch sp. G. (6–8, 10, 12–16) Synsphaeridium spp.; (6, 7) the same specimen imaged by SEM and transmitted light microscopy, respectively; note opaque spots in (7) are visible as raised knobs in (6); (10) illustrates variation of cell packing, ranging from a polygonal close-packing habit at the top left to loose-pack habit at the right. Scale bar=50 µm. Slide/Stub and coordinates: (1) 1265.71-105A/R16-3 (P49551); (2) 1244.17-14B/S30-3 (P49469); (3) 1237.74-12/E27-2 (P49465); (4) 1265.57-19A/M21-3 (P49522); (5) 1265.57-19A/L17-3 (P49523); (6, 7) 1265.46-2_28B/W53-0 (P49505); (8) 1266.31-20/U35-0(P49557); (9) 1265.57-19A/R23-1 (P49524); (10) 1265.57-19A/O19-4 (P49525); (11) 1244.17-14B/P17-3 (P49470); (12) 1255.43-15B/J19-4 (P49480); (13) 1265.71-105A/J26-2 (P49552); (14) 1265.71-105A/S34-2 (P49553); (15) 1265.57- March20_epoxyA (P49548); (16) 1265.57- LittleStubB (P49544).

Unnamed Acritarch sp. F vesicle diameter as compared with diameter of spot and histogram of vesicle diameters. Upper panel illustrates the linear relationship between diameters of vesicle and of spot upon vesicle.

Description
Spheroidal organic-walled microfossils bearing typically one, occasionally more than one, optically dense spot as a part of the vesicle. This is distinct from reports of dark bodies within vesicles that are interpreted to represent condensed cytoplasm (e.g., Knoll and Barghoorn, Reference Knoll and Barghoorn1975). Vesicles range in diameter from 19.7 to 285.0 µm (
 $${\rm \bar{x}}=54.6\,{\rm \mu m}$$
, s=43.3 µm, N=52), and dark spots range from 3.1 to 142.7 µm (
 $${\rm \bar{x}}=21.9\,{\rm \mu m}$$
, s=23.3 µm, N=52). In one case, two spots are seen upon a vesicle; it appears to be in the process of fission (Fig. 13.1).
Material examined
Sixty-two specimens from the Alinya Formation, Giles 1 drill core depths 1,237.74, 1,242.84, 1,244.17, 1,248.91, 1,255.43, 1,255.76, 1,257.73, 1,265.36, 1,265.46, 1,265.71, and 1,266.31 m.
Remarks
The spots appear to be a (probably thickened) part of the vesicle, rather than a separate body within the vesicle as with the vesicle-within-a-vesicle construction of Pterospermopsimorpha sp. or in cases of shrunken cell contents of forms such as Caryosphaeroides sp. and Glenobotrydion sp. (e.g., Knoll and Barghoorn, Reference Knoll and Barghoorn1975). The surficial nature is indicated in observation by light microscopy that the spots are in the same focal plane as the rest of the vesicle (often with somewhat diffuse edges as opposed to the distinct edges of internal bodies) as well as by the fact that occasional torn specimens show tearing across the spots (Fig. 13.3), and in some instances, degradation of the spot allows the viewer to see through the fossil to the back wall of the vesicle (Fig. 13.2, 13.11). This said, it is clear both from work by Pang and colleagues (Reference Pang, Tang, Schiffbauer, Yao, Yuan, Wan, Chen, Ou and Xiao2013) and from FIB-EM analyses of Culcitulisphaera revelata in this paper that acritarch vesicle walls do fuse during diagenesis, sandwiching any internal bodies between the walls and complicating interpretations of life positions. Cross sectioning of specimens and study by SEM and transmission electron microscopy (TEM) would aid in resolution of this matter.
This group appears to comprise one taxon; the distribution of vesicle diameters (Fig. 14) is weakly bimodal with a major mode at 20 to 30 µm and a minor mode from 60 to 80 µm. There is a linear relationship between vesicle diameters and spot diameters (m=0.51, R2=0.90658; Fig. 14). This linear relationship in spot and vesicle diameters is also seen in Leiosphaeridia species A of Nagy et al. (Reference Nagy, Porter, Dehler and Shen2009) (S.M.P., unpublished observations). In that form, the body or ‘spot’ upon the vesicle is clearly an operculum. It is unclear whether variability reflects an ontogenetic sequence or simply variation within a population.
The function of the spots in the Alinya specimens is unclear; were they opercula, one would reasonably expect to find a number of specimens opened, with opercula either attached or detached and showing distinctive holes, or even loose opercula within the strewn mount. None of these has been observed.
It is worth noting that similar features are seen in some specimens of Synsphaeridium spp. reported here (Fig. 13.6, 13.7, 13.13, 13.14). It is conceivable that this unnamed group and Synsphaeridium spp. are conspecific, their differences perhaps indicative of ontogenetic or ecophenotypic variation.
Unnamed Acritarch species G
Description
Small (~36 µm), spheroidal, organic-walled microfossils bearing a ring (~3 µm wide) about the perimeter. Vesicle diameters range from 28.6 to 48.0 µm including the ring (
 $${\rm \bar{x}}=35.8\,{\rm \mu m}$$
, s=6.7 µm, N=7), and ring widths range from 2.6 to 3.8 µm (
 $${\rm \bar{x}}=3.1$$
, s=0.4 µm, N=7). This ring is not considered a happenstance of concentric folding as there is no evidence of radial cracking, and in one fossil (Fig. 13.9) the ring is no darker than the interior, arguing against the presence of more layers of vesicle in the periphery. This group may be another example of a winged, or pteromorphic, morphotype.
Material examined
Seven specimens from the Alinya Formation, Giles1 drill core depths 1,265.46 and 1,265.57 m.
Cellular aggregates
Genus Synsphaeridium Eisenack, Reference Eisenack1965
Occurrence
Ubiquitous in Precambrian and Phanerozoic organic-walled microfossil assemblages.
Description
Aggregates of organic-walled, spheroidal cells; tight-packing habit may lead to compression and polygonal cell outline. Cell diameters range from 7.5 to 33.7 µm (
 $${\rm \bar{x}}=14.8\,{\rm \mu m}$$
, s=4.6 µm, N=450 measured cells from 221 colonies) across forms showing loose association, tight-packing, optically dense and not dense vesicles and forms with dark spots upon the vesicle surface (those with dark bodies within the interior of the vesicle rather than a part of the vesicle were not counted separately).
Material examined
Two hundred seventy-six colonies from the Alinya Formation, Giles 1 drill core depths 1,237.74, 1,242.84, 1,244, 1,244.17, 1,248.91, 1,255.43, 1,255.76, 1,257.73, 1,265.36, 1,265.46, 1,265.57, 1,265.71, 1,266.03, and 1,266.31 m.
Remarks
Initially, variations in cell packing, vesicle opacity, and presence of dark spots were thought to indicate separate taxa, but over the course of the study, these characters were seen to grade into each other—even within single colonies (Fig. 13.10).
A number of genera have been erected for smooth-walled colonial aggregates of cells (e.g., Synsphaeridium Eisenack, Reference Eisenack1965; Myxococcoides Schopf, Reference Schopf1968; Symplassosphaeridium Timofeev, Reference Timofeev1959 ex Timofeev, Reference Timofeev1969; Ostiana Hermann, 1976 in Timofeev et al., Reference Timofeev, Hermann and Mikhailova1976). Descriptions vary slightly but all generally describe aggregations of cells 3 to ~90 µm in diameter that may show tight- or loose-packing habit, may or may not have optically dense vesicles, and occasionally display optically dense or opaque spots upon or within the vesicle. Specimens recovered from the Alinya Formation have been placed in open nomenclature with attribution to Synsphaeridium, the first erected of these genera.
This morphologically simple group is almost certainly polyphyletic, but there is also no indication that the preponderance of available generic designations addresses this issue in a biologically relevant way. A major revision of fossil colonial aggregates is warranted and should be guided by neontology, including consideration of phenotypic plasticity as well as actualistic studies of taphonomic variation.
Filamentous microfossils
Genus Cyanonema Schopf Reference Schopf1968 emend. Butterfield, Knoll, and Swett, Reference Butterfield, Knoll and Swett1994
Type Species
Cyanonema attenuata Schopf, Reference Schopf1968.
Remarks
Members of the genus Cyanonema are unbranched, uniseriate cellular trichomes that are distinguished from those of Oscillatoriopsis on the basis of length-to-width ratios of the cells. Members of Cyanonema have cell lengths greater than cell widths, and members of Oscillatoriopsis have cell lengths less than, or equal to, cell widths.
Cyanonema sp.
Filamentous microfossils: (1, 2) Obruchevella parva; (3, 10) Siphonophycus typicum; (4) Cyanonema sp.; (5) S. typicum and Polythricoides lineatus; (6) S. solidum; (7) S. septatum; (8, 14) R. tenuis; (9) P. lineatus; (11) S. robustum; (12) S. kestron; (13) Rugosoopsis tenuis; (15) P. lineatus. Scale bar=50µm. Slide and coordinates: (1) 1265.57-19A/O30-2 (P49526); (2) 1265.57-19A/L24-3 (P49527); (3, 4) 1244.17-14B/T35-3 (P49476); (5) 1265.57-19A/O35-3 (P49528); (6) 1265.46-18A/Q38-1 (P49490); (7) 1265.57-19A/M41-2 (P49529); (8) 1265.57-19A/J37-2 (P49532); (9) 1266.31-20/V33-0 (P49558); (10) 1255.76-16A/J35-3 (P49483); (11) 1255.43-15B/S18-0 (P49481); (12) 1265.46-18A/M38-0 (P49489); (13) 1265.57-19A/O20-2 (P49531); (14) 1265.57-19A/L42-3 (P49533); (15) 1265.57-19A/H22-3 (P49530).

Description
The single specimen recovered in the present study has cells of length ~6 µm and width ~5 µm, thus falling into the genus Cyanonema. However, these dimensions are greater than those indicated for the type species, C. attenutata, and the length-to-width ratio of 1.1 is less than the diagnosed 1.5 to 2.5 for the type.
Material examined
One specimen from the Alinya Formation, Giles 1 drill core depth 1,244.17 m.
Genus Obruchevella Reitlinger, Reference Reitlinger1948, emend. Yakshchin and Luchinina, Reference Yakshchin and Luchinina1981
Type species
Obruchevella delicata Reitlinger, Reference Reitlinger1948
Obruchevella parva Reitlinger, Reference Reitlinger1959
1959 Obruchevella parva Reference ReitlingerReitlinger, p. 21, pl. 6, figs. 1, 2.
1992 Obruchevella parva; Reference KnollKnoll, p. 756, pl. 1, figs. 2, 5.
Holotype
(Reitlinger, Reference Reitlinger1959; p. 21, pl. 6, fig. 2) Tinov Formation, Nohtuyska region, Siberia.
Occurrence
Widely distributed in Proterozoic through Paleozoic units.
Description
Helically coiled, organic-walled filaments measuring ~5 µm in filament diameter (range 3.4 to 6.0 µm,
 $${\rm \bar{x}}=4.7\,{\rm \mu m}$$
, s=1.2 µm, N=5). These fossils have the appearance of concentric circles due to the long-axis view provided by macerates.
Material examined
Five specimens from the Alinya Formation, Giles 1 drill core depth 1,265.57 m.
Remarks
Reitlinger erected three species of Obruchevella, differentiated chiefly by filament width: O. delicata (12–18 µm; Reitlinger, Reference Reitlinger1948), O. parva (6.8–8.5 µm; Reitlinger, Reference Reitlinger1959), and O. sibirica (14–17 µm; Reitlinger, Reference Reitlinger1959). The difference between O. delicata and O. sibirica is the total width of the specimen, effectively the number of whorls preserved of the filament. This character is taphonomically controlled, thus O. sibirica is a junior synonym of O. delicata.
The Alinya Formation specimens are somewhat smaller in diameter than the dimensions of 6.8 to 8.5 µm given in the original description of O. parva (Reitlinger, Reference Reitlinger1959; p. 20–21). However, the size of the Alinya forms is in keeping with those from the Baklia Formation of the Scotia Group (Knoll, Reference Knoll1992), which measured 4 to 5 µm in diameter. This is also consistent with specimens of the Bylot Group (3 to 10 µm in filament diameter); however, those specimens were assigned to O. valdaica rather than O. parva without mention of the latter. We place the Alinya specimens into O. parva rather than the also comparable O. valdaica (erected as Volyniella valdaica by Shepeleva in an unpublished dissertation, validly published by Aseeva, Reference Aseeva1974, and then moved to Obruchevella by Jankauskas et al., Reference Jankauskas, Mikhailova and Hermann1989) due to the nomenclatural priority of O. parva.
Mankiewicz (Reference Mankiewicz1992) gives a careful analysis of the genus and lists seventeen validly named species of Obruchevella, suggesting many may be synonyms, but stops short of a major revision.
Genus Polythrichoides Hermann, Reference Hermann1974 emend. Timofeev et al., Reference Timofeev, Hermann and Mikhailova1976
Type species
Polythrichoides lineatus Hermann, Reference Hermann1974 emend. Knoll et al., Reference Knoll, Swett and Mark1991
Polythrichoides lineatus Hermann, Reference Hermann1974 emend. Knoll et al., Reference Knoll, Swett and Mark1991
1974 Polythrichoides lineatus Reference HermannHermann, p. 8, pl. 6, figs. 3, 4.
1976 Polythrichoides lineatus; Timofeev and Hermann in Timofeev, Hermann, and Mikhailova, p. 37, pl. 14, fig. 7.
1989 Polytrichoides (sic) lineatus; Reference Jankauskas, Mikhailova and HermannJankauskas, Mikhailova, and Hermann, p. 119, pl. 30, figs. 5A, B, 6, 7.
1991 Polytrichoides (sic) lineatus; Reference Knoll, Swett and MarkKnoll, Swett, and Mark, p. 563, fig. 4.3, 4.5.
1992 Polytrichoides (sic) lineatus; Reference KnollKnoll, p. 760, pl. 2, fig. 6.
1994 Polythrichoides lineatus; Reference Hofmann and JacksonHofmann and Jackson, p. 12, fig. 11.13–11.17.
1995 Quaestiosignum filum; Reference ZangZang, p. 171, figs. 32A–C.
2008 Polythrichoides lineatus; Reference MoczydłowskaMoczydłowska, p. 81, fig. 7E.
2009 Polytrichoides (sic) lineatus; Reference Vorob’eva, Sergeev and KnollVorob’eva, Sergeev, and Knoll, p. 188, figs. 15.13, 15.14.
Holotype
(Hermann in Timofeev et al., 1974, p. 8, pl. 6, fig. 3), preparation number 49/11 from Krasnoyarsk Krai in Turukhansk region, near Maya River, Neoproterozoic Miroyedikha Formation, Russia.
Occurrence
Widely distributed in Proterozoic organic-walled microfossil assemblages.
Description
Tightly grouped bundles of parallel, smooth-walled, apparently aseptate trichomes ranging in width from 0.9 to 2.5 µm (
 $${\rm \bar{x}}=1.4\,{\rm \mu m}$$
, s=0.5 µm, N=10). Filament bundles range in width from 8 to 24 µm (
 $${\rm \bar{x}}=14.1\,{\rm \mu m}$$
, s=5.6 µm, N=11).
Material examined
Eleven specimens from the Alinya Formation, Giles 1 drill core depths 1,265.46, 1,265.57, 1,265.71, and 1,266.31 m.
Remarks
The P. lineatus specimens recovered from the Alinya Formation are slightly smaller than the 3.9 µm indicated in the diagnosis by Hermann (Reference Hermann1974) and the range of 3 to 5 µm given in her later emendation (in Timofeev et al., Reference Timofeev, Hermann and Mikhailova1976) but are very similar in range to those described from the Bylot Supergroup (1 to 3 µm) by Hofmann and Jackson (Reference Hofmann and Jackson1994). Similarly, the widths of the bundles of filaments found in the Alinya Formation (8 to 24 µm) are somewhat smaller than those of the type material (19.5 to 39 µm), but are consistent with findings from Bylot Supergroup specimens (5 to 30 µm). This form is often compared with members of the extant cyanobacterial genus Microcoleus in which the width of filaments is typically 2 to 10 µm and the number of filaments within a sheath varies from 2 or 3 to more than 100, resulting in a wide range of bundle widths.
Genus Rugosoopis (Timofeev and Hermann, Reference Timofeev and Hermann1979), emend. Butterfield, Knoll, and Swett, Reference Butterfield, Knoll and Swett1994
Type species
Rugosoopsis tenuis Timofeev and Hermann, Reference Timofeev and Hermann1979.
Remarks
In the emended diagnosis of Butterfield et al., Reference Butterfield, Knoll and Swett1994 (followed here), this genus is indicated to be bilayered, consisting of a smooth-walled or pseudoseptate inner sheath surrounded by a diagnostic outer sheath bearing a transverse fabric. In the material recovered from the Alinya Formation, this form is most frequently found to be missing the inner smooth-walled filament.
Butterfield and colleagues (Reference Butterfield, Knoll and Swett1994) suggest a cyanobacterial affinity for Rugosoopsis based on observations of Rugosoopsis-like transverse fabric developed during cyanobacterial response to desiccation in modern lagoonal systems (Horodyski et al., Reference Horodyski, Bloeser and Vonder Haar1977).
Rugosoopsis tenuis Timofeev and Hermann, Reference Timofeev and Hermann1979 emend. Butterfield, Knoll, and Swett, Reference Butterfield, Knoll and Swett1994
1979 Rugosoopsis tenuis Reference Timofeev and HermannTimofeev and Hermann, p. 139, pl. 29, figs. 5, 7.
1994 Rugosoopsis tenuis; Reference Butterfield, Knoll and SwettButterfield, Knoll and Swett, p. 62, figs. 25A-D, 27B (see for additional synonymy).
2001 Rugosoopsis tenuis; Reference Samuelsson and ButterfieldSamuelsson and Butterfield, fig. 3.
2016 Rugosoopsis tenuis; Porter and Riedman, p. 830, fig. 11.12.
(For additional synonymy see also Moczydłowska, Reference Moczydłowska2008.)
Holotype
(Timofeev and Hermann, Reference Timofeev and Hermann1979; p. 139, pl. 29, fig. 7), preparation number 1-22/1-77/1, Mesoproterozoic to Neoproterozoic Lakhanda Group, Maya River, Khabarovsk Krai, Russia.
Occurrence
This form has been reported from early Neoproterozoic units such as the Lakhanda Group (Timofeev and Hermann, Reference Timofeev and Hermann1979), Svanbergfjellet Formation (Butterfield et al., Reference Butterfield, Knoll and Swett1994), and Lone Land (Samuelsson et al., Reference Samuelsson, Dawes and Vidal1999) Formation.
Description
Rugose filaments 6.2 to 29.5 μm in diameter (
 $${\rm \bar{x}}=11.7\,{\rm \mu m}$$
, s=4.9 µm, N=23), consistent with the forms described from the Svanbergfjellet Formation (7 to 57 µm in diameter) described by Butterfield and colleagues (Reference Butterfield, Knoll and Swett1994) and from which the emended diagnosis was made. In two specimens, cellular contents are retained (Fig. 15.13).
Material examined
Twenty-three specimens from the Alinya Formation, Giles 1 drill core depths 1,265.46, 1,265.57, 1,265.71, and 1,266.31 m.
Genus Siphonophycus Schopf, Reference Schopf1968 emend. Knoll, Swett, and Mark, Reference Knoll, Swett and Mark1991
Type species
Siphonophycus kestron Schopf, Reference Schopf1968.
Remarks
Siphonophycus is a form genus of unbranched, smooth-walled, originally tubular filamentous sheaths that are differentiated into form species based on width.
Siphonophycus septatum (Schopf, Reference Schopf1968) Knoll, Swett, and Mark, Reference Knoll, Swett and Mark1991
1968 Tenuofilum septatum Reference SchopfSchopf, p. 679, pl. 86, figs. 10–12.
1991 Siphonophycus septatum; Reference Knoll, Swett and MarkKnoll, Swett, and Mark, p. 565, fig. 10.2.
1994 Siphonophycus septatum; Reference Butterfield, Knoll and SwettButterfield, Knoll, and Swett, p. 64, figs. 10H, 22G–H (see for additional synonymy).
1994 Siphonophycus septatum; Reference Hofmann and JacksonHofmann and Jackson, p. 10, fig. 11.1–11.4.
2016 Siphonophycus septatum; Porter and Riedman, p. 830, fig. 11.10.
Holotype
(Schopf, Reference Schopf1968; p. 679, pl. 86, fig. 11), thin section Bit/Spr 6–3, Paleobotanical collections, Harvard University, number 58527 from Neoproterozoic Bitter Springs Formation, Amadeus Basin, Australia.
Diagnosis
Unbranched, nonseptate, smooth-walled filamentous microfossil 1 to 2 µm in diameter.
Occurrence
Widely distributed; found in Mesoproterozoic through Paleozoic units.
Description
Unbranched, nonseptate, smooth-walled filamentous microfossils, both specimens 1.6 µm in diameter. One specimen ~235 μm in length.
Material examined
Two specimens recovered from the Neoproterozoic Alinya Formation, 1,265.57 and 1,265.71 meters depth in Giles 1 drill core, Officer Basin, South Australia.
Siphonophycus robustum (Schopf, Reference Schopf1968) Knoll, Swett, and Mark, Reference Knoll, Swett and Mark1991
1968 Eomycetopsis robusta Reference SchopfSchopf, p. 685, pl. 82, figs. 2, 3, pl. 83, figs. 1–4.
1991 Siphonophycus robustum; Reference Knoll, Swett and MarkKnoll, Swett, and Mark, p. 565, fig. 10.3, 10.5.
1994 Siphonophycus robustum; Reference Butterfield, Knoll and SwettButterfield, Knoll, and Swett, p. 64, fig. 26A, G (see for additional synonymy).
1994 Siphonophycus robustum; Reference Hofmann and JacksonHofmann and Jackson, p. 10, fig. 11.5.
1998 Siphonophycus robustum; Reference Yuan and HofmannYuan and Hofmann, p. 209, fig. 13I.
2001 Siphonophycus robustum; Reference Samuelsson and ButterfieldSamuelsson and Butterfield, figs. 2B, 9F–H.
2009 Siphonophycus robustum; Reference Dong, Xiao, Shen, Zhou, Li and YaoDong et al., p. 39, fig. 6.12.
2010 Siphonophycus robustum; Reference Sergeev and SchopfSergeev and Schopf, p. 387, fig. 6.4.
2016 Siphonophycus robustum; Porter and Riedman, p. 837, fig. 16.4.
Holotype
(Schopf, Reference Schopf1968; p. 685, pl. 83, fig. 1), thin section Bit. Spr. 10-1, Paleobotanical collections, Harvard University number 58491 from Neoproterozoic Bitter Springs Formation, Amadeus Basin, Australia.
Diagnosis
Unbranched, nonseptate, smooth-walled filamentous microfossil 2 to 4 µm in diameter.
Occurrence
Widely distributed; found in Mesoproterozoic through Paleozoic units.
Description
The Alinya specimens range in diameter from 2.1 to 3.8 µm (
 $${\rm \bar{x}}=3.2\,{\rm \mu m}$$
, s=0.6 µm, N=7).
Material examined
Twelve specimens from the Alinya Formation, Giles 1 drill core depths 1,244.17, 1,255.43, 1,265.36, 1,265.57, and 1,266.21 m.
Siphonophycus typicum (Hermann, Reference Hermann1974) Butterfield (in Butterfield et al., Reference Butterfield, Knoll and Swett1994)
1974 Leiothrichoides tipicus Reference HermannHermann, p. 7, pl. 6, figs. 1–2.
1994 Siphonophycus typicum; Butterfield in Reference Butterfield, Knoll and SwettButterfield et al., p. 66, figs. 23B–D, 26B, H, I (see for additional synonymy).
1995 Siphonophycus robustum; Reference ZangZang, fig. 32L, M.
2001 Siphonophycus typicum; Reference Samuelsson and ButterfieldSamuelsson and Butterfield, figs. 2A, 8F.
2008 Siphonophycus typicum; Reference MoczydłowskaMoczydłowska, p. 83, fig. 5E.
2010 Siphonophycus typicum; Reference Sergeev and SchopfSergeev and Schopf, p. 387, fig. 6.4.
2016 Siphonophycus typicum; Porter and Riedman, p. 837, fig. 16.3.
Holotype
(Hermann, Reference Hermann1974; p. 7, pl. 6, figs. 1, 2), preparation number 49/2T from Krasnoyarsk Krai in Turukhansk region, near Maya River, Neoproterozoic Miroyedikha Formation, Russia.
Diagnosis
Unbranched, nonseptate, smooth-walled filamentous microfossil 4 to 8 µm in diameter.
Occurrence
Widely distributed; found in Mesoproterozoic through late Ediacaran units.
Description
The Alinya specimens range in diameter from 4.0 to 8.0 µm (
 $${\rm \bar{x}}=5.8\,{\rm \mu m}$$
, s=1.2 µm, N=35).
Material examined
Forty-seven specimens from the Alinya Formation, Giles 1 drill core depths 1,244.17, 1,255.43, 1,255.76, 1,265.36, 1,265.46, 1,265.57, 1,265.71, and 1,266.31 m.
Siphonophycus kestron Schopf, Reference Schopf1968
1968 Siphonophycus kestron Reference SchopfSchopf, p. 671, pl. 80, figs. 1–3.
1994 Siphonophycus kestron; Reference Butterfield, Knoll and SwettButterfield, Knoll, and Swett, p. 67, fig. 21D (see for additional synonymy).
1994 Siphonophycus kestron; Reference Hofmann and JacksonHofmann and Jackson, p. 12, fig. 11.8, 11.9.
1995 Siphonophycus sp. cf. S. kestron; Reference ZangZang, p. 171, fig. 32G non 32F.
1998 Siphonophycus rugosum; Reference Yuan and HofmannYuan and Hofmann, fig. 13H.
2001 Siphonophycus kestron; Reference Samuelsson and ButterfieldSamuelsson and Butterfield, fig. 8F.
2008 Siphonophycus kestron; Reference MoczydłowskaMoczydłowska, p. 82, fig. ?4G, 5F, 7F.
2010 Siphonophycus kestron; Reference Sergeev and SchopfSergeev and Schopf, p. 385, fig. 8.5.
Holotype
(Schopf, Reference Schopf1968; p. 671, pl. 80, fig. 1) thin section Bit/Spr 6-3, Paleobotanical collections, Harvard University, number 58469 from the Neoproterozoic Bitter Springs Formation, Amadeus Basin, Australia.
Diagnosis
Unbranched, nonseptate, smooth-walled filamentous microfossil 8 to 16 µm in diameter.
Occurrence
Widely distributed; found in Mesoproterozoic through early Cambrian units.
Description
The Alinya specimens range in diameter from 8.3 to 15.2 µm (
 $${\rm \bar{x}}=10.9\,{\rm \mu m}$$
, s=2.1 µm, N=22).
Material examined
Twenty-six specimens from the Alinya Formation, Giles 1 drill core depths 1,255.43, 1,265.36, 1,265.46, 1,265.57, and 1,266.31 m.
Siphonophycus solidum (Golub, Reference Golub1979) Butterfield (in Butterfield et al., Reference Butterfield, Knoll and Swett1994)
1979 Omalophyma solida Reference GolubGolub, p. 151, pl. 31, figs. 1–4, 7.
1994 Siphonophycus solidum; Reference Butterfield, Knoll and SwettButterfield, Knoll, and Swett, p. 67, fig. 25H–I, 27D (see for additional synonymy).
?1995 Siphonphycus sp. cf. S. kestron; Reference ZangZang, p. 171, fig. 32F.
2001 Siphonophycus solidum; Reference Samuelsson and ButterfieldSamuelsson and Butterfield, fig. 8A, C, ?D, E.
2002 Siphonophycus solidum; Reference Xiao, Yuan, Steiner and KnollXiao, Yuan, Steiner, and Knoll, p. 371, fig. 10.1–10.3.
2010 Siphonophycus solidum; Reference Sergeev and SchopfSergeev and Schopf, p. 387, figs. 7.6–7.8, 8.1, 8.2.
Holotype
(Golub, Reference Golub1979; p. 151, pl. 31, fig. 1) ВСЕГЕИ, preparation P-163/3, Rudnyanskaya collection, upper Smolensk Suite, Neoproterozoic, Russia.
Diagnosis
Unbranched, nonseptate, smooth-walled filamentous microfossil 16 to 32 µm in diameter.
Occurrence
Widely distributed in Proterozoic and Paleozoic organic-walled microfossil assemblages.
Description
The Alinya specimens range in diameter from 16.9 to 32.6 µm (
 $${\rm \bar{x}}=24.3\,{\rm \mu m}$$
, s=6.4 µm, N=6).
Material examined
Seven specimens from the Alinya Formation, Giles 1 drill core depths 1,265.36, 1,265.46, and 1,266.31 m.
Conclusions
The high taxonomic richness of the middle Neoproterozoic Alinya Formation is consistent with the elevated levels of eukaryotic diversity seen from other Tonian units. However, the Alinya assemblage is more similar to that of the 770–742 Ma Chuar Group than to the somewhat older Svanbergfjellet and Wynniatt formations. Indeed, the Alinya and Chuar assemblages may be two of the youngest records of high organic-walled microfossil diversity before the diversity downturn that preceded the Cryogenian snowball earth glaciations.
Study of micro- and nano-scale morphology by SEM has proven to be of great use in the description of the Alinya assemblage. It appears that the apparent lack of morphological detail in early to middle Neoproterozoic acritarchs is partly a methodological limitation; the traditional use of transmitted light microscopy does not permit appreciation of the very subtle diagnostic detail found in some of these taxa. More widespread use of SEM in study of middle Neoproterozoic taxa may illustrate that fine detail is common in acritarchs of this age. Such a finding could have a significant effect on Neoproterozoic biostratigraphy and, in turn, our understanding of early eukaryotic diversity trends. Routine use of SEM in acritarch studies would also reduce taxonomic inflation and depression caused by taphonomic variation—results not only valuable for within-assemblage diversity assessment, but also important for identification of taxa from units of poor preservational quality.
Acknowledgments
This work was supported by National Science Foundation grant EAR-0922305 to S.M.P. Authors thank managers and staff of core facilities at Glenside Core Library, Adelaide, SA, for aid in sampling, G. Waanders for sample preparations, and J.L. Moore for manuscript feedback and a generally insightful nature. Thank you to M. Moczydłowska, S. Xiao, and A.H. Knoll for insightful and thorough reviews.
Accessibility of supplemental data
Data available from the Dryad digital repository: http://dx.doi.org/10.5061/dryad.7vv37.