Introduction
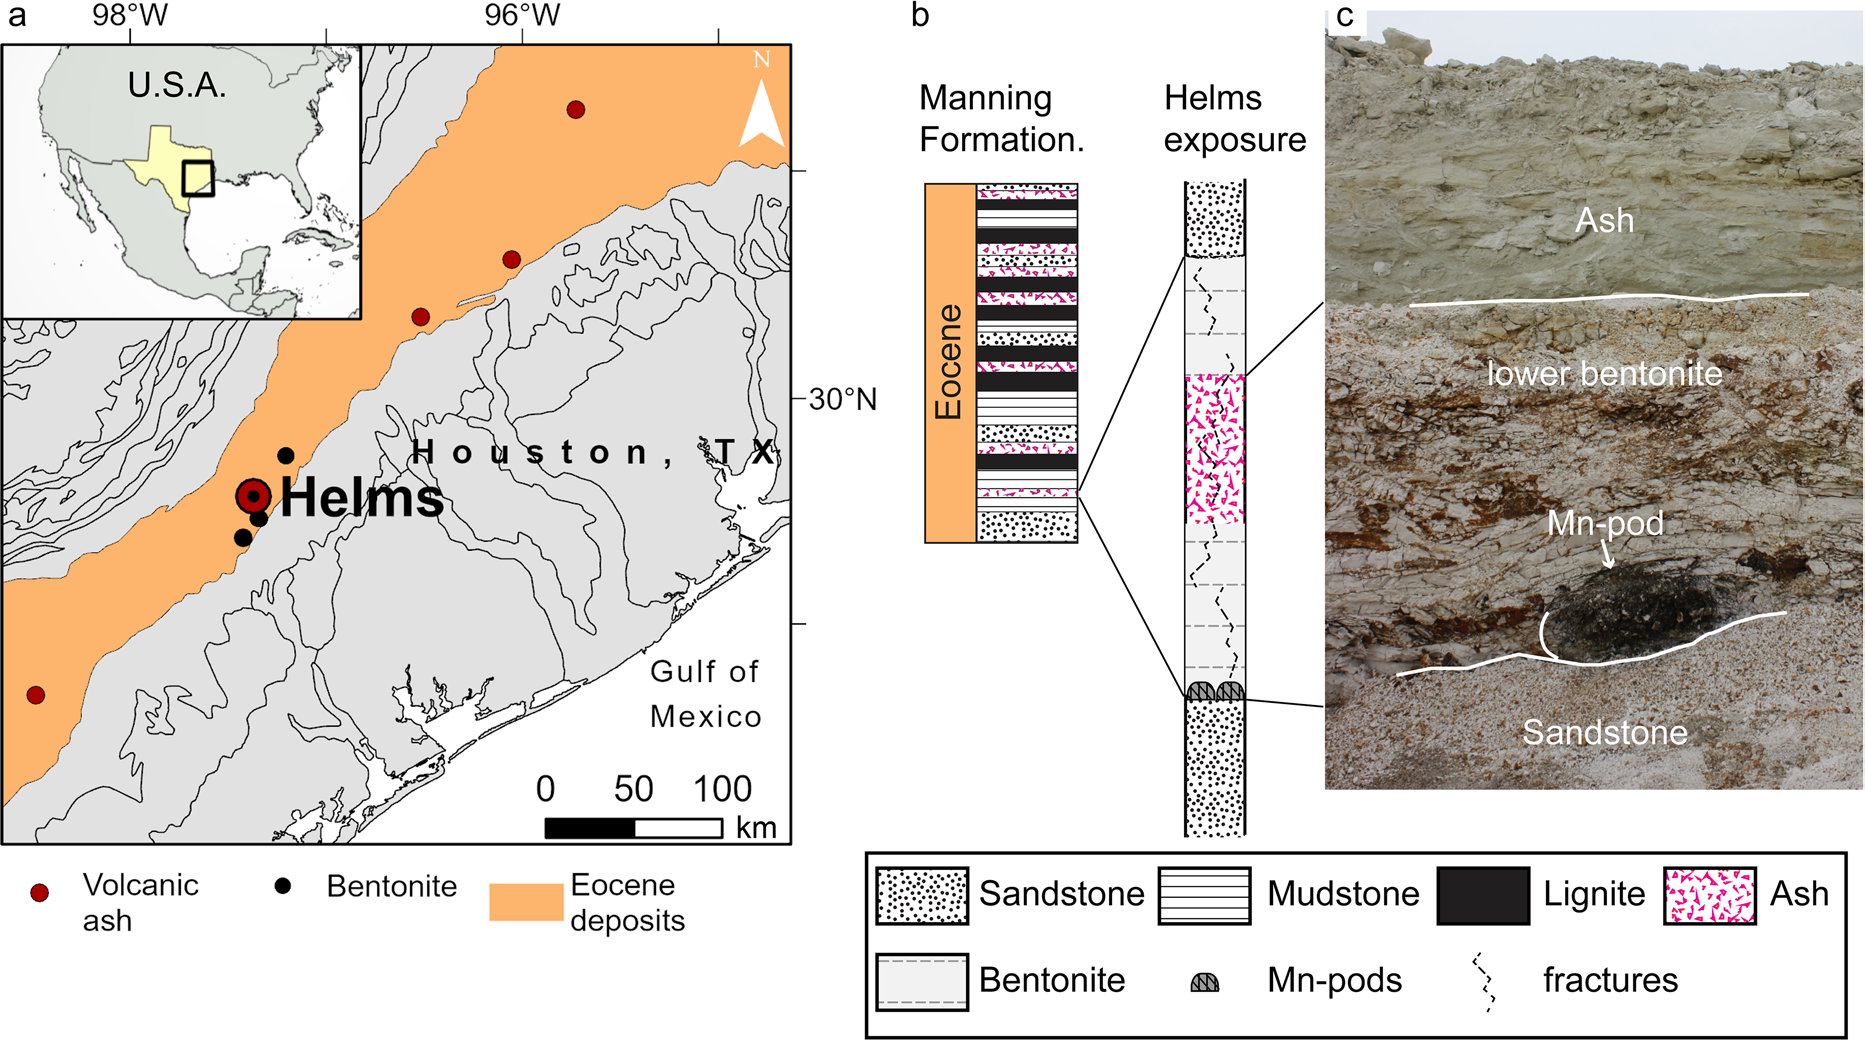
Eocene-aged sediments of the Texas coastal plain contain numerous, widespread rhyolitic ash layers that are exposed along a southwest-northeast corridor, ~ 70 km inward of the current coastline (Fig. 1). Near the Eocene coastline in central Texas, a strandplain-barrier depositional system provided local conditions favorable to the alteration of volcanic ash into thick bentonite deposits that have been mined in Gonzalez (Texas, USA) for over a century (Chen, 1968; Fisher et al., 1970; Heintz et al., Reference Heintz, Yancey, Miller and Heizler2015; Roberson, Reference Roberson1964; Yancey & Guillemette, Reference Yancey and Guillemette1998; Yancey et al., Reference Yancey, Heizler, Miller and Guillemette2018). Volcanic glass conversion into montmorillonite — the main mineral of these bentonite deposits — is driven by interaction with brackish water; silica and alkali leach from the glass while nucleation and growth of montmorillonite leads to the enrichment of Al, Mg, and Ca relative to the parent ash (Galloway, Reference Galloway1978; Zielinski, Reference Zielinski1982; Senkayi et al., Reference Senkayi, Dixon, Hossner, Abder-Ruhman and Fanning1984; Christidis, Reference Christidis1998). Leaching also leads to accumulation of immobile or less mobile elements (e.g. Ti) in the altered ash deposit and the release of others into pore water (Galloway, Reference Galloway1978; Zielinski, Reference Zielinski1982; Senkayi et al., Reference Senkayi, Dixon, Hossner, Abder-Ruhman and Fanning1984; Christidis, Reference Christidis1998).
Location of the Helms pit and stratigraphy of the bentonite deposit. a Geological map of the Eocene coastal deposits where black circles mark locations of bentonite deposits, red circles mark locations of Eocene ash layers outcrops. b Stratigraphic column of the late Eocene Manning Fm. (Yancey & Guillemette, Reference Yancey and Guillemette1998) and of the bentonite deposit exposed at Helms pit. c Picture of the Helms deposit exposure showing a Mn pod at its base

Texas bentonite deposits accumulated rare earth elements, the lanthanides of the periodic table and yttrium (REE), where the ionic radius of Y is between those of Dy and Ho. Published data report total concentrations up to 600 ppm, in strata up to 6 m thick (Michaelides, 2011), with REEs hosted in secondary phosphate nanominerals that formed with montmorillonite during the aqueous alteration of volcanic ash (Berti et al., Reference Berti, Slowey, Yancey and Deng2022). Further, these deposits contain favorable proportions of REEs that are critical (Nd, Eu, Tb, Dy, Y, Er) for current technologies and are limited in supply (Dai & Finkelman, Reference Dai and Finkelman2018; Seredin & Dai, Reference Seredin and Dai2012). Indeed, altered volcanic ash is an important source of REEs in coal deposits (e.g. Dai & Finkelman, Reference Dai and Finkelman2018; Dai et al., Reference Dai, Ward, Graham, French, Hower, Zhao and Wang2017; Hower et al., Reference Hower, Berti, Hochella and Mardon2018; Liu et al., Reference Liu, Song, Dai, Nechaev, Graham, French and Nechaeva2019), late Permian bentonite horizons in Yunnan province of China (Shen et al., Reference Shen, Dai, Graham, Nechaev, French, Zhao, Shao, Liu, Zuo, Zhao, Chen and Xie2021; Zhao et al., Reference Zhao, Dai, Graham, Li, Liu, Song, Hower and Zhou2017), and also tuff in the Heling deposit, one of the regolith-hosted ores that supplies REEs to most of the world market (Bao & Zhao, Reference Bao and Zhao2008; Li et al., Reference Li, Zhou and Williams-Jones2020).
Some of the Texas Eocene bentonite deposits show a yellow hue due to the presence of ferromanganese (oxyhydr) oxide veins, varnishes, and host characteristic Mn oxide-rich pods that are close to 1 m in diameter and in which preliminary investigations identified anomalously high REE concentrations (7800 ppm REE, this study). Associations of ferromanganese nodules and crusts with anomalous concentrations of REEs are not uncommon (though usually at smaller concentrations); in marine settings, some of these associations have been linked to scavenging from seawater, hydrothermal circulation, or phosphatization events (Bau et al., Reference Bau, Koschinsky, Dulski and Hein1996, Reference Bau, Schmidt, Koschinsky, Hein, Kuhn and Usui2014; Conrad et al., Reference Conrad, Hein, Paytan and Clague2017; Kuhn et al., Reference Kuhn, Bau, Blum and Halbach1998; Sasmaz et al., Reference Sasmaz, Zagnitko and Sasmaz2020, Reference Sasmaz, Sasmaz and Hein2021). Enriched REE intervals also form in marine and lake sediments post deposition by release of adsorbed REEs during reduction of Fe–Mn (oxyhydr)oxides (e.g. Och et al., Reference Och, Müller, Wichser, Ulrich, Vologina and Sturm2014). However, Fe–Mn (oxyhydr)oxides are not always associated with enrichment of REEs; for instance, no association was found between Fe–Mn (oxyhydr)oxides and REEs in the Chinese regolith deposits that are one of the world's main sources (Li et al., Reference Li, Zhou and Williams-Jones2020). Among REEs, Ce has the strongest association with Fe–Mn deposits because of similar redox behavior (Bau et al., Reference Bau, Schmidt, Koschinsky, Hein, Kuhn and Usui2014; Conrad et al., Reference Conrad, Hein, Paytan and Clague2017) and can be scavenged oxidatively by particulate Fe–Mn oxides (Bau and Koschinsky, Reference Bau and Koschinsky2009) whereas the aqueous behavior of other REEs is more affected by the presence of ligands (e.g.
 ,
 ,
 ,
 ) and reactive surfaces, both being pH dependent (Cao et al., Reference Cao, Chen, Wang and Deng2001; Cetiner et al., Reference Cetiner, Wood and Gammons2005; Migdisov et al., Reference Migdisov, Williams-Jones, Brugger and Caporuscio2016; Poitrasson et al., Reference Poitrasson, Oelkers, Schott and Montel2004). Prolonged weathering can remobilize REEs from easily alterable components of a deposit and the different aqueous behavior of REEs result, over long periods of time, in their fractionation along the depth profile or groundwater path. In particular, Ce oxidizes from tri- to a tetravalent form that precipitates in authigenic minerals, thereby resulting in a Ce concentration spike at the oxidation front and consequent subtraction from leaching solution (Bao & Zhao, Reference Bao and Zhao2008; Li et al., Reference Li, Zhou and Williams-Jones2020).
For the Eocene-aged bentonites of the Texas coastal plain, deciphering the nature of the REE association with Mn oxides as well as their modes of occurrence is crucial for understanding low-temperature processes that mobilize and fractionate REEs in coastal settings, their relation to the volcanic ash, and their economic potential. These bentonite deposits are comparable to other weathering-type deposits in the USA (e.g. Cheshire et al., Reference Cheshire, Bish, Cahill, Kertesz and Stack2018; Elliott et al., Reference Elliott, Gardner, Malla and Riley2018; Hower et al., Reference Hower, Berti, Hochella and Mardon2018; Pingitore et al., Reference Pingitore, Clague and Gorski2018) for which mineral-specific REE extraction technologies are being developed (Dai & Finkelman, Reference Dai and Finkelman2018; Stuckman et al., Reference Stuckman, Lopano and Granite2018; Wanhala et al., Reference Wanhala, Wanhala, Doughty, Bryantsev, Wu, Mahurin, Jansone-Popova, Cheshire, Navrotsky and Stack2019).
The objective of the present study was to investigate the occurrences of REEs associated with pods of Mn oxides found at the base of bentonite-altered ashfall deposits in Gonzales County, Texas, USA to ascertain their association with Mn oxides and the processes that led to their accumulation.
Geological Setting
The middle–late Eocene to early Oligocene stratigraphic record of the Texas coastal plain is marked by numerous volcanic ash layers that are exposed along the Eocene paleo-coastline, ~70 km landward of the current coastline (Fig. 1). These layers occur most frequently in the late-Eocene Manning Formation, where they interbed with alternating layers of sandstones and mudstones that compose para-sequences of multiple transgressive–regressive cycles of sea-level (Fig. 1b). High frequency depositional cycles are superimposed on an overall regressive sea-level trend, reflecting a change in global climate conditions from warm to cool. Each ash bed is typically in sharp contact with surrounding sedimentary deposits and is laterally extensive. Indeed, a few ash beds have been traced along the Gulf Coast in Texas (Yancey & Guillemette, Reference Yancey and Guillemette1998) and as far as Louisiana and Mississippi (Jordan et al., Reference Jordan, Yancey, Heinrich, Miller and McGuire2019).
Previous studies determined the volcanic ash has a rhyolitic, subalkaline composition and originates from the Sierra Madre Occidental volcanic field (Guillemette & Yancey, Reference Guillemette and Yancey1996; Heintz et al., Reference Heintz, Yancey, Miller and Heizler2015; Michaelides, 2011; Yancey et al., Reference Yancey, Heizler, Miller and Guillemette2018) where ignimbrite flare-up episodes in the late Eocene emitted large volumes of volcanic ash into the atmosphere (Ferrari et al., Reference Ferrari, Orozco-Esquivel, Bryan and López-Martı́nez, M., & Silva-Fragoso, A.2018; Yancey et al., Reference Yancey, Heizler, Miller and Guillemette2018). Ash clouds were transported eastward over distances exceeding 1000 km to the Texas gulf coast and as far as Mississippi (Yancey & Guillemette, Reference Yancey and Guillemette1998; Yancey et al., Reference Yancey, Heizler, Miller and Guillemette2018). Near Gonzalez (Texas), volcanic ash settled in marine or brackish environments where it subsequently altered — partially or completely — into thick deposits of bentonite (some exceeding 6 m in thickness) that have been important economically for over a hundred years.
In all known deposits, the bentonite is composed largely of montmorillonite (80–95%) with a smaller fraction (0–20%) of opal-C, that acts as a cement, and a small fraction (0 to 5%) of coarser phenocrysts, including feldspars (mostly sanidine), zircon, titanite, biotite, and quartz (Berti et al., Reference Berti, Slowey, Yancey and Deng2022; Chen, 1968; Chipera & Bish, Reference Chipera and Bish2001; Henderson et al., Reference Henderson, Jackson, Syers, Clayton and Rex1971; Michaelides, 2011; Roberson, Reference Roberson1964). Chen (1968) and Roberson (Reference Roberson1964) described different lithotypes for the Gonzalez bentonites, based on coloration and hardness; coloration varies between blue that is due to the presence of pyrite, white from bentonite formed in a well oxygenated environment, and yellow from iron oxide-stained fractures. Soft and hard intervals are recognized with greater hardness reflecting the presence of opal-C cement.
The Helms pit in Gonzalez exposes an approximately 4 m thick ashfall deposit that is altered fully into bentonite at the top and bottom but comprises a less altered, ash-rich middle section. Sharp boundaries separate the ashfall deposit from an overlying sandstone layer and an underlying cemented sandstone layer. This deposit age is 35.67 ± 0.05 Ma, based on 40Ar/39Ar dating of single sanidine phenocrysts and is coeval with the bentonite at the nearby H. W. Johnson pit (Yancey et al., Reference Yancey, Heizler, Miller and Guillemette2018) which shows similar REE enrichment (Berti et al., Reference Berti, Slowey, Yancey and Deng2022). The top portion of the ashfall deposit (~ 1 m thick) is hard white bentonite, the mid-section is a mixture of bentonite and volcanic glass shards, whereas the bottom of the deposit is heavily fractured bentonite that exhibits a yellow hue, deriving from Fe (oxyhydr)oxide crusts on fracture walls. Within the Fe (oxyhydr)oxide crusts, Mn oxides are rare and in minor concentrations. However, well developed Mn oxide intervals occur at the top and bottom boundaries of the bentonite layer. Remarkably, large concentrations of Mn oxides are found at the base of the ashfall deposit (on top of a cemented sandstone), in pods characterized by a mound shape, with a diameter ranging between 80 and 120 cm and a height of ~ 50 cm. The patchy lateral distribution of the pods indicates their association with the set of fractures that cut through (otherwise impermeable) bentonite, thus opening preferential paths for water downward flow.
Materials and Methods
Samples
Samples were collected from freshly exposed surfaces of several Mn pods at the base of the ashfall deposit exposed at the Helms pit in Gonzales, Texas (Lat. 29.4843400N, Lon. 97.3709870W) and surveyed by XRD and by ICP-MS (limited set of elements). Based on preliminary data, two Mn pod samples (Mn13-03, Mn14-01) were selected for electron microscopy investigation. Additionally, samples collected from the top and bottom bentonite (B13-08, B13-04), from the intervening ash interval (V13-01), and > 20 μm sized glass shards separated from the ash interval (V13-01 > 20 μm) were analyzed by ICP-MS and SEM.
Chemical Composition of Major, Trace, and RE Elements
Samples were ground using an agate mortar and pestle until >95% of the sample passed a #140 mesh sieve. Splits of the ground, homogenized samples were sent to Activation Laboratories, Ltd. (Ancaster, Ontario, Canada) for elemental analysis by ICP-OES or ICP-MS. Samples and a blank were processed by lithium metaborate/tetraborate fusion to ensure complete fusion, then digested in weak nitric acid solution prior to analysis by ICP-MS for Cr, Co, Ni, Cu, Zn, Ga, Ge, As, Rb, Nb, Mo, Ag, In, Sn, Sb, Cs, REY, Hf, Ta, W, Tl, Pb, Bi, Th, and U and by ICP-OES for major element oxides, Sc, Be, V, Ba, Sr, Y, and Zr. Accuracy and precision were ensured by calibration with 14 certified USGS and CANMET standards.
The chemical index of alteration (CIA), defined as the ratio of Al and the sum of Al and alkali (Nesbitt & Young, Reference Nesbitt and Young1982), was calculated from the ICP-OES data as: Al2O3/(Al2O3 + K2O + CaO + Na2O) in percent. The Ce anomaly (Ce/Ce*) was calculated using concentrations normalized to the Upper Continental Crust (UCC, McLennan, Reference McLennan2001) using the geometrical mean method: Ce/Ce* = Ce/√(La • Pr); similarly, the Eu anomaly (Eu/Eu*) was calculated using UCC normalized concentrations as: Eu/Eu* = Eu/√(Sm•Gd). Additionally, the proportion of critical over total REEs (REEdef,rel) and the outlook coefficient (Cout) were calculated as: REEdef,rel = (Nd + Eu + Dy + Tb + Y + Er)/∑REE and Cout = (Nd + Eu + Dy + Tb + Y + Er)/(Ce + Ho + Tm + Yb + Lu).
Powder X-ray Diffraction
A portion of the bulk samples was treated to separate the sand, silt, and clay fractions using the procedures of Deng et al. (Reference Deng, White and Dixon2013). The mineralogical characterization of the ground bulk samples splits as well as its silt and clay fractions was performed using a D8 Bruker Advance diffractometer (Bruker AXS, Karlsruhe, Germany) with a 1-D position sensitive LynxEye detector (Bruker AXS, Karlsruhe, Germany) and CuKα radiation, operated at 35 kV and 45 mA. Additionally, XRD patterns of the clay fraction were acquired after Mg-saturation, glycerol solvation, K-saturation at room temperature, and after heating treatments at 300 and 550°C.
Scanning Electron Microscopy
Sample blocks for SEM analysis were prepared by dehydration and embedding, using a four-component epoxy resin that combines the stability and polishing quality of Araldite 502 with the low-viscosity and water-forgiving properties of Quetol 601 (Ellis, Reference Ellis2016), using chemicals manufactured by Electron Microscopy Sciences (Hatfield, Pennsylvania, USA). One surface of the embedded blocks was polished using diamond lapping films with sequentially finer grit size, ending at a grit size of 0.1 μm. After carbon coating, the flat, polished block surfaces were analyzed using a Tescan LYRA-3 high-resolution dual-beam FIB-SEM (Tescan, Kohoutovice, Czech Republic), equipped with an Oxford Instruments silicon drift detector for EDS (Oxford Instruments Nanoanalysis, Concord, Massachusetts, USA), and a dedicated backscatter electron (BSE) detector (Tescan, Kohoutovice, Czech Republic) mounted on the polepiece of the electron beam column. BSE images — for which contrast is a function of average atomic number — were collected at beam energies of 10 and 5 keV. Voltage was increased to 15 keV for EDS analysis to provide sufficient overvoltage for the detection of most elements while maintaining a spatial resolution of ~ 1 μm. The Oxford Instruments AZtec® software was used to identify elements in the EDS spectra and for standardless quantification. SEM analysis identified REE hosted in nanoparticulates for which the SEM–EDS spatial resolution is not sufficient to characterize the chemical composition adequately; therefore, a few representative sites were chosen for further analysis by TEM. Sections suitable for TEM analysis were extracted from the selected sites using the FIB liftout technique (Giannuzzi, et al., Reference Giannuzzi, Drown, Brown, Irwin and Stevie1998) and the same FIB-SEM instrument. With this technique, a section (~ 10 μm long, 5 μm deep) through the region of interest was exposed by ion milling trenches on either side, then extracted with the aid of a micro-manipulator and soldered (using Pt) on a TEM grid holder; finally, the in situ section was made ready for TEM by thinning it to electron transparency (~0.1 μm) using the ion beam.
Transmission Electron Microscopy
In situ sections prepared by FIB liftout were analyzed using a Tecnai G20 TEM (Thermo Fisher Scientific Inc., Waltham, Massachusetts, USA) with an Oxford Instruments EDS detector (Oxford Instruments Nanoanalysis, Concord, Massachusetts, USA), operated at 200 keV. Because the spatial resolution of TEM-EDS analysis is controlled by the size of the beam (Cliff & Lorimer, Reference Cliff and Lorimer1975), EDS spectra were acquired in scanning mode (STEM), by focusing the beam to a spot size ranging between 30 nm and ~1 nm (depending on operating conditions and magnification). In the same mode and conditions, atomic contrast images were acquired using a High Angle Annular Dark Field (HAADF) electron detector (Thermo Fisher Scientific Inc., Waltham, Massachusetts, USA). Mineral identification was based on chemical composition determined by EDS in combination with crystal structure parameters determined from selected area diffraction patterns (SAED) and from high-resolution TEM images (HRTEM). For HRTEM images, lattice parameters were measured from their corresponding fast fourier transform (FFT) which was computed using Gatan Microscopy Suite (GMS 3.5) software.
Results
Major Elements and REE Concentrations
The major- and trace-element compositions of the ashfall deposit and of the manganese pods (Supplementary Table S1) showed that the aqueous alteration of volcanic ash into bentonite results in a loss of silica and alkali, as well as uptake of Mg from seawater. The degree of alteration, quantified by the CIA, displayed a minimum of 55% in the sorted ash — which is in good agreement with the value expected for rhyolitic composition — and increased to a maximum of 77% in the bentonite intervals, corresponding to the progressive alteration from the mid-section toward the top and bottom of the deposit. In the Mn pods, the CIA was slightly lower than in the bentonite, due to the presence of Ca in the manganese minerals (as shown by SEM–EDS) rather than a lower degree of alteration.
In the pods, the Mn oxide concentration ranged from 20.75 to 24.5%, as opposed to ~0.06% in the midsection of the ashfall deposit and ~0.013% in the top and bottom bentonite intervals. Additionally, the iron concentration in pods was twice that of the ashfall deposit but remained low (~2%), yielding a Mn/Fe ratio of ~9. Concentrations of other major elements also differed from those in the ash, revealing less SiO2, an order of magnitude more P (mean of 0.3% versus 0.03% for ash), slightly more Ca, and less Mg. Compared to the composition of the volcanic ash, the Mn pods showed anomalously high concentrations of several trace elements (Supplementary Table S2, Supplementary Fig. S1): Ba, Zn, Ni, Sr, Co, V, Mo, As, Ga, Cu, Sb, Tl, and U (ordered from high to low concentration); high concentrations of REEs; and depletion of Rb, Cs, W, and Zr.
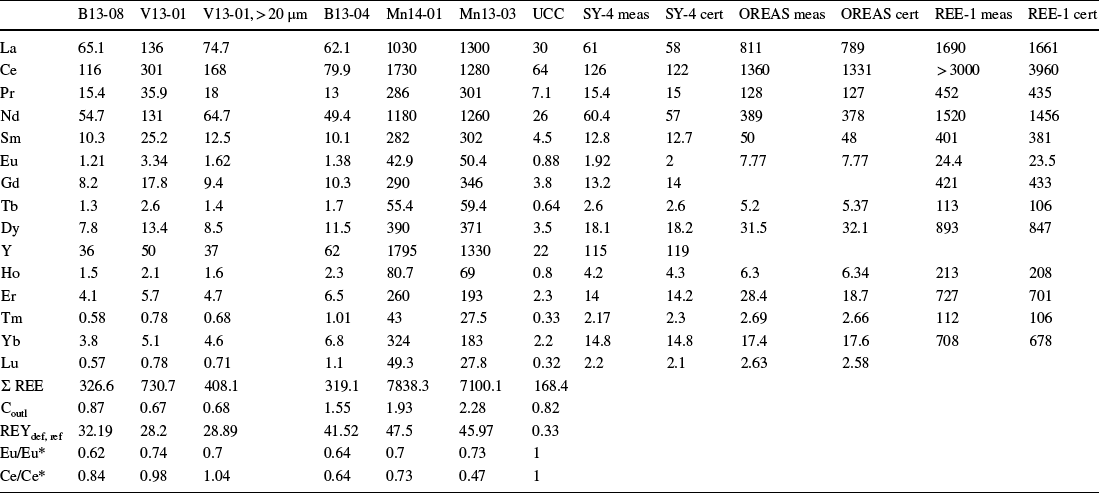
The concentration of REEs in the Helms ashfall deposit was high (Table 1), reaching a maximum of 730 ppm in the meter-thick mixed ash-clay interval. This value is the highest concentration reported so far for the Gonzalez bentonite deposits (Berti et al., Reference Berti, Slowey, Yancey and Deng2022; Heintz et al., Reference Heintz, Yancey, Miller and Heizler2015; Michaelides, 2011). Remarkably, the REE concentration increased ten-fold in the Mn pods where it ranged between 7100 and 7838 ppm. The Ba/Eu ratio remained well below the 1000 threshold above which quantification of Eu by ICP-MS is not considered reliable (Yan et al., Reference Yan, Dai, Graham, He, Shan and Liu2018).
REE Concentrations (ppm). Samples B13-08 and B13-04 are from the top and bottom bentonites, respectively; V13-01 is from the mixed-ash interval, 13–01 > 20 mm coarse size (ash); and Mn14-01 and Mn13-03 are from Mn pods. UCC: Upper Continental Crust model by McLennan (Reference McLennan2001). The measured (meas) and certified (cert) values of the SY-4, OREAS, and REE-1 standards that were run with the samples are also reported

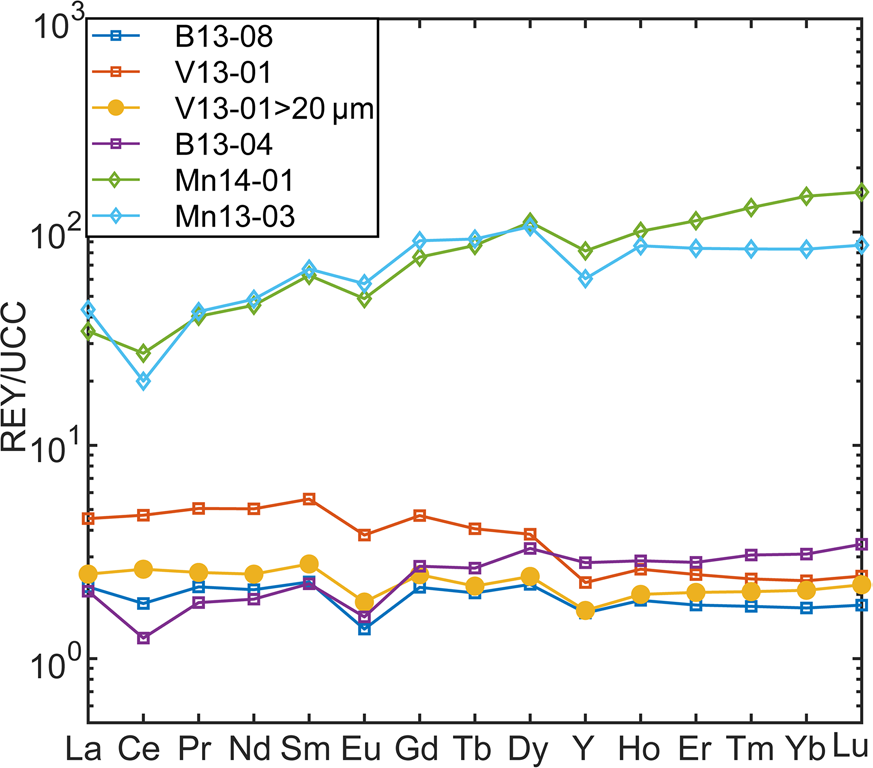
The relative proportions of light REE (LREE: La–Sm), medium REE (MREE: Eu–Dy + Y), and heavy REE (HREE: Ho–Lu) also changed between the ashfall deposit and the Mn pods, as illustrated in Fig. 2 by the trends of REE concentrations normalized to the UCC (McLennan, Reference McLennan2001). A relatively flat REE trend for the ash and bentonite shifted, for the Mn pods, to an upward trend with a higher proportion of MREEs and HREEs than LREEs (e.g. the LaUCC concentration increased by three times between ash and Mn pods while that of DyUCC increased by 40 times).
Helms deposit UCC-normalized REE trend

The UCC-normalized trends also showed anomalous Eu and Ce concentrations, where an anomaly was defined as the deviation of the UCC normalized concentration of the element from the mean of the two adjacent elements and is symbolized by REE/REE* (Bau et al., Reference Bau, Koschinsky, Dulski and Hein1996). The Eu/Eu* shows a negative anomaly that remained relatively constant in all samples (Table 1) and constituted an imprint of the rhyolitic source ash (Bau, Reference Bau1991). Differently, the Ce/Ce* values showed no anomaly in the ash and top bentonite, but a negative anomaly in the lower bentonite and in the Mn pod samples (Table 1); a trend that suggests remobilization of REE during post-depositional processes.
Neodymium, Eu, Dy, Tb, Y, and Er are considered to be critical REEs due to their broad use in current technologies and limited supply. Seredin and Dai (Reference Seredin and Dai2012) and Dai and Finkelman (Reference Dai and Finkelman2018), drawing on their coal research, proposed to evaluate the economic potential of alternative deposits based on the proportion of critical elements with respect to the total (REEdef,rel) and the outlook coefficient (Cout), which was defined as the ratio between critical REEs and excessive REEs (Ce, Ho, Tm, Yb, Lu). The REEdef,rel of the Helms deposit increased from ~30% in the top bentonite and mixed-ash interval to 40% in the lower bentonite and 45% in the Mn pods while the outlook coefficient Cout increased from slightly less than 1 to a range of 1.5–2 (Table 1), a range of values that falls into the promising interval of this classification (30% < REEdef,rel < 51%,0.7 < Coutl < 1.9; Supplementary Fig. S2). Accordingly, the Helms bentonite deposit, and especially the Mn pods at its base, have the characteristics of a promising alternative deposit that would expand the use of resources already mined for other purposes (bentonite).
Mineralogy by X-ray Diffraction
The Gonzalez bentonite deposits owe their economic importance to their uniform mineralogy, dominated by either Ca- or Na-saturated montmorillonite (e.g. Berti et al., Reference Berti, Slowey, Yancey and Deng2022; Chen, 1968; Chipera & Bish, Reference Chipera and Bish2001). The Helms ashfall deposit is composed of Ca-saturated montmorillonite with a variable minor fraction of opal-C. Volcanic glass shards are abundant in the mid-section of the deposit, and a minor fraction of volcanic phenocrysts has been identified that includes sanidine (most abundant), zircon, and titanite.
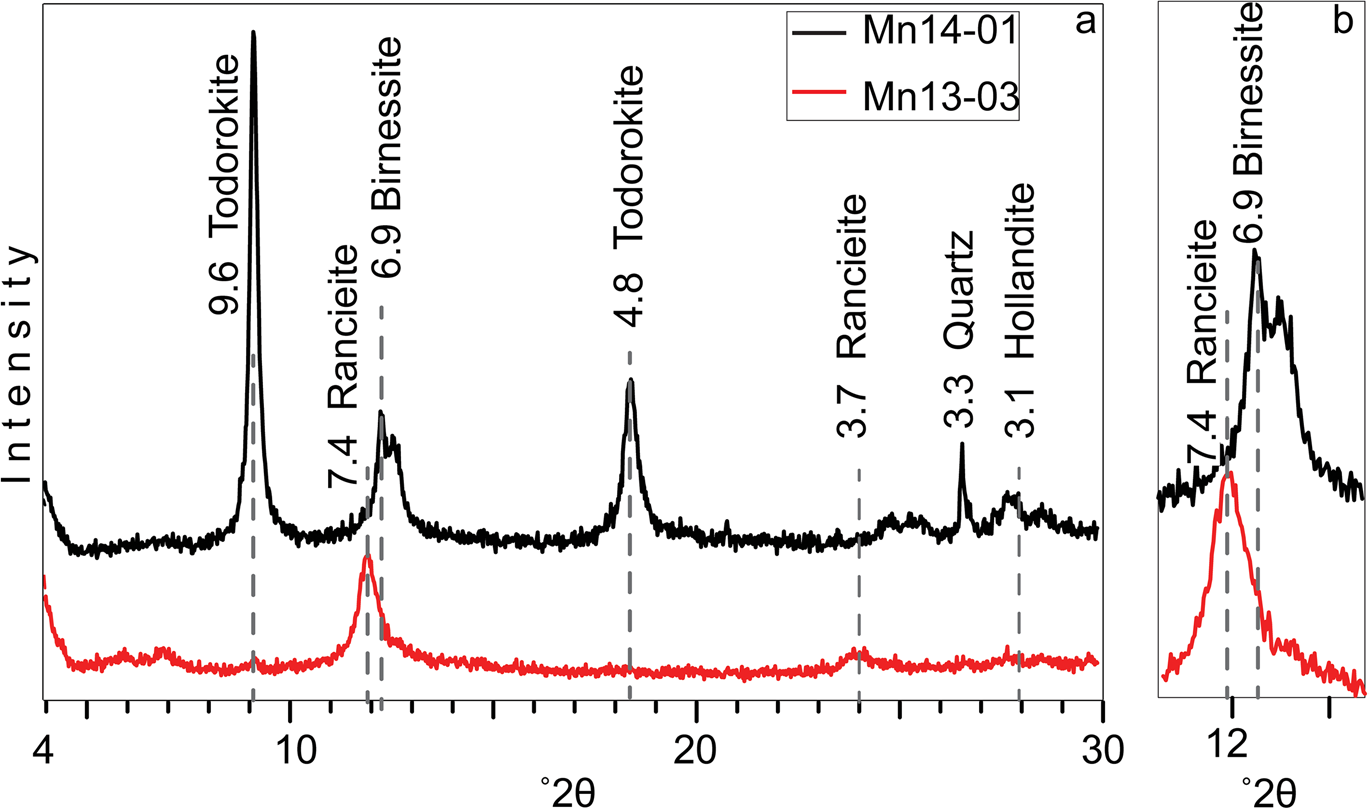
While the mineralogy of the bentonite is uniform, the XRD patterns showed changes in the Mn minerals that occur in different pods, despite the short distance between them (Fig. 3). The most abundant manganese mineral identified in sample 13–03 was the hydrated layer-structured ranciéite, which contains Ca as the dominant interlayer cation, and birnessite. In sample 14–01, the mineralogy also included tunnel-structure Mn oxides, primarily todorokite but also hollandite.
a XRD patterns of the manganese samples (1–2 μm fractions); b the region around 12°2θ is enlarged x2 to better show the peaks of ranciéite and birnessite

Microscale Investigation by SEM
SEM-BSE images were collected from representative Mn pod samples, as well as from the two bentonite intervals and the intervening ash interval; in addition, >250 EDS spectra were collected by point-ID, focusing on regions with high BSE contrast.
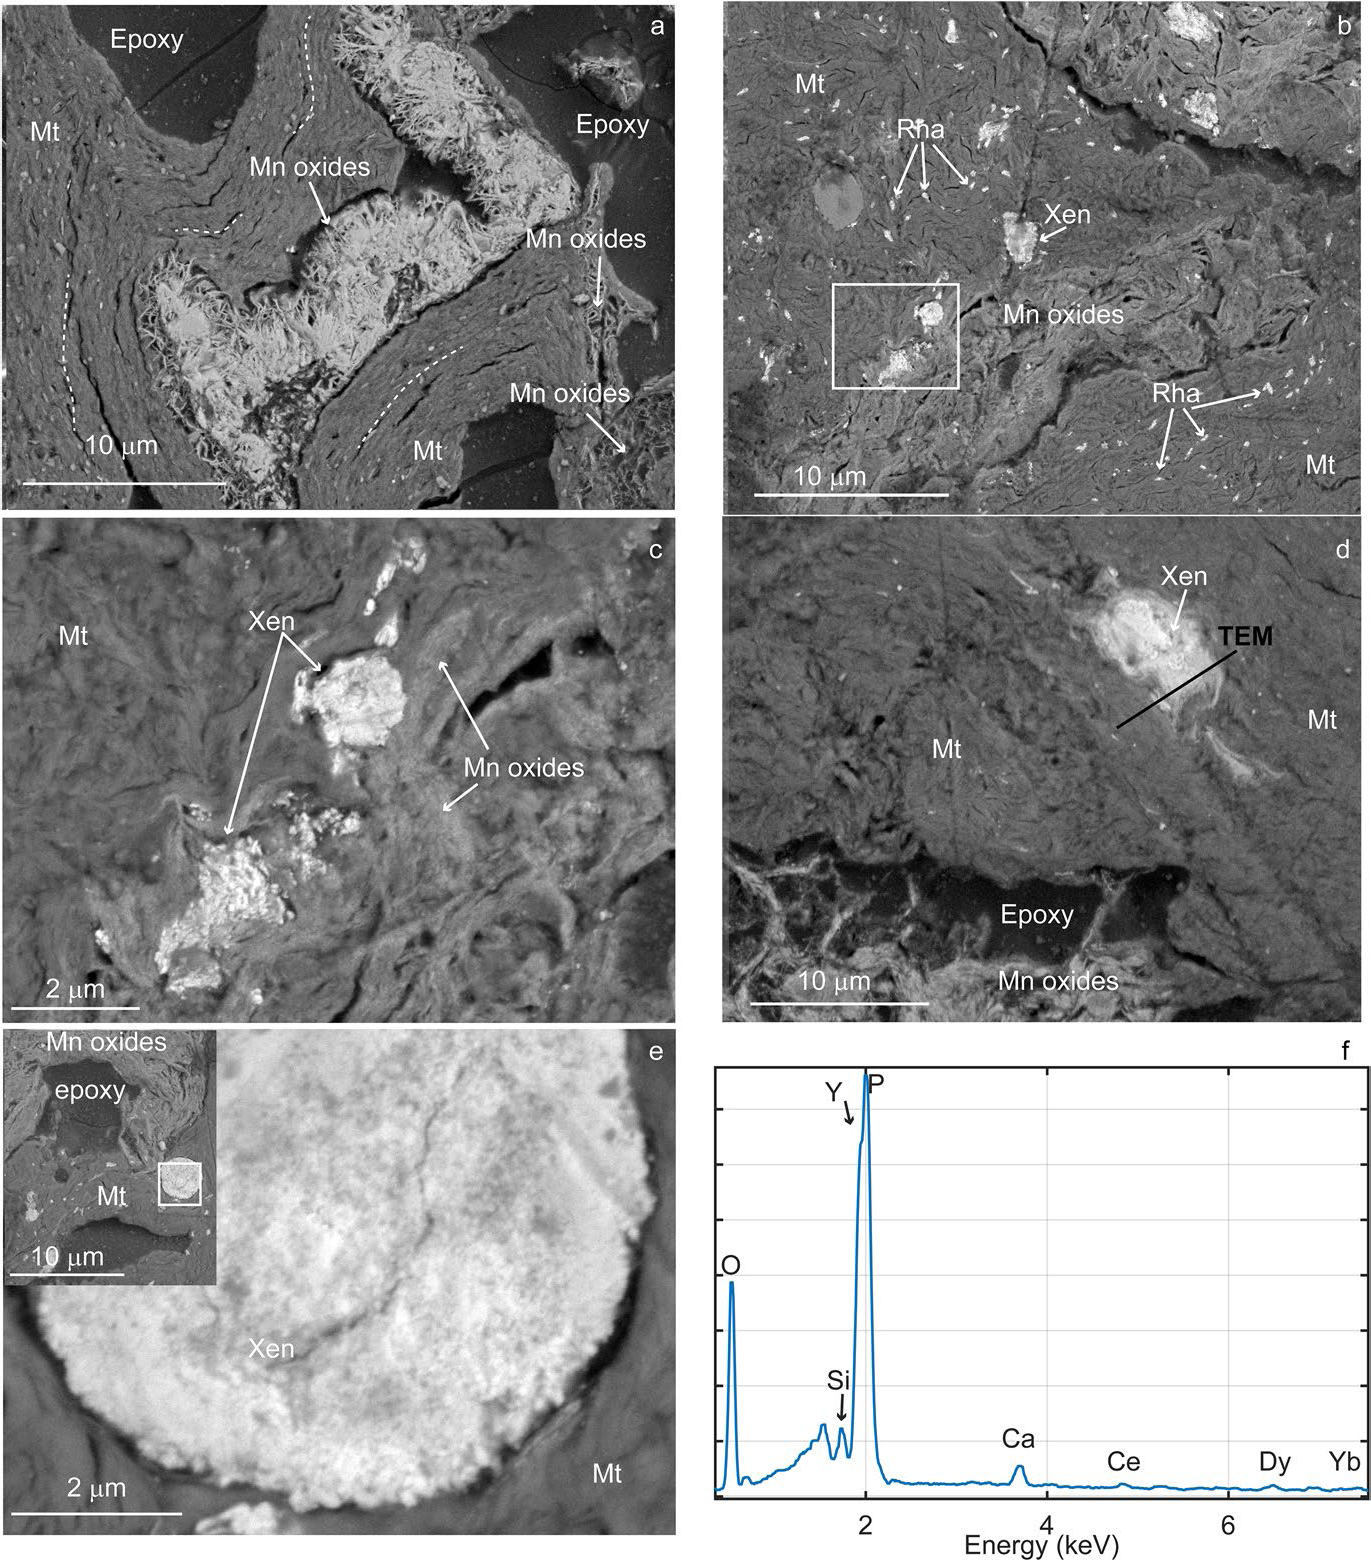
The images reveal a severely disrupted clay fabric in the Mn oxide deposits (Fig. 4, Supplementary Fig. S3). The orientation of tightly-packed montmorillonite clay particles changed direction, following the contour of large voids — of the order of tens to hundreds of microns. The void space was occupied partially by a porous network of Mn oxide lamellae forming a cellular fabric (Fig. 4a) having a variable relative porosity, leading to variable BSE contrast in the images (Supplementary Fig. S3). Sheets of Mn-oxides with ranciéite-birnessite composition also grew in face-to-face contact with the montmorillonite (Fig. 4b), frequently bulging the otherwise tightly packed clay fabric. Clay domains, with oriented and tightly packed fabric, changed in orientation and clearly bent around some Mn oxides. Relics of partially altered sanidine and glass shards were also found, plus rare occurrences of zircon and Fe-coated Ti-oxides, as well as rounded quartz grains, within a heterogeneous fabric (at least at the scale of observation of the SEM).
SEM-BSE images of REEs in Mn pods. a Mn oxides framework within montmorillonite (Mnt) void space; the dotted lines mark the orientation of clays. b Rhabdophane (Rha) and xenotime (Xen) aggregates dispersed in clay matrix. c Region marked by white rectangle in b showing xenotime aggregates next to Mn oxides and clays. d Xenotime aggregate with boundaries fading into bentonite. e Xenotime sub-rounded aggregate in bentonite showing nanoparticle composition; in the inset the lower magnification image shows the location of the aggregate with respect to bentonite and Mn oxides. f EDS spectrum from one of the aggregates shows peaks of Y, P, and O with trace concentrations of Ce, Dy, and Yb

The results of the EDS survey indicated that all the Mn phases contained Ca (the atomic percent ratio of Ca/Mn ranged 0.01–0.2, with a median of 0.05) and Ba (atomic % of Ba/Mn median 0.03; range 0.01–0.07) whereas Fe was detected in only 75% of Mn-phases at low concentrations (atomic % Fe/Mn between 0 and 0.24, median 0.04), in agreement with the bulk analysis findings. Sheet Mn oxides with greater BSE contrast contained Zn (atomic % Zn/Mn of 0–0.15, median 0.04). Less frequently, minor amounts of K, Co, Ni, Cr, Cl, Sr were detected, and, among REEs, Ce was the only element detected in 13% of Mn phases, at low concentrations; however, due to partial overlap with Ba peaks, EDS may underestimate Ce. Other REEs have only been detected as phosphate nanoparticles with two main groups of compositions: one dominated by LREEs, and a second dominated by Y with small amounts of HREEs (see the correlation matrix heatmap in Supplementary Fig. S4).
Irregularly distributed REE nanoparticles were encountered very frequently in the clay matrix (Fig. 4). In particular, the Y-phosphate nanoparticles, composed of xenotime (see TEM section), formed agglomerates ranging between 2 and 7 μm in diameter that are distinctive of these Mn pods (Fig. 4c–e). Some agglomerates show well defined boundaries while others showed halos at the transition to clay or appear smeared (Fig. 4d) or continue into narrow voids linking them to other agglomerates. SEM images acquired at high magnification clearly showed tightly packed nanoparticles composing the agglomerate (Fig. 4e), whereas EDS spectra (Fig. 4f) consistently showed peaks of O, Y, and P, and trace amounts of Ca, Ce, Dy, and Yb, as well as other heavy REE that were not always detected as their peak intensity was near the detection limit of the EDS. Even though Y and P peaks partially overlapped in EDS spectra, their presence was evident from the resultant compounded peak shape with two separate maxima, which was decomposed using the software AZtec®. Analysis by TEM-EDS (see TEM section) further confirmed the presence of the YKα peak at 14.93 keV.
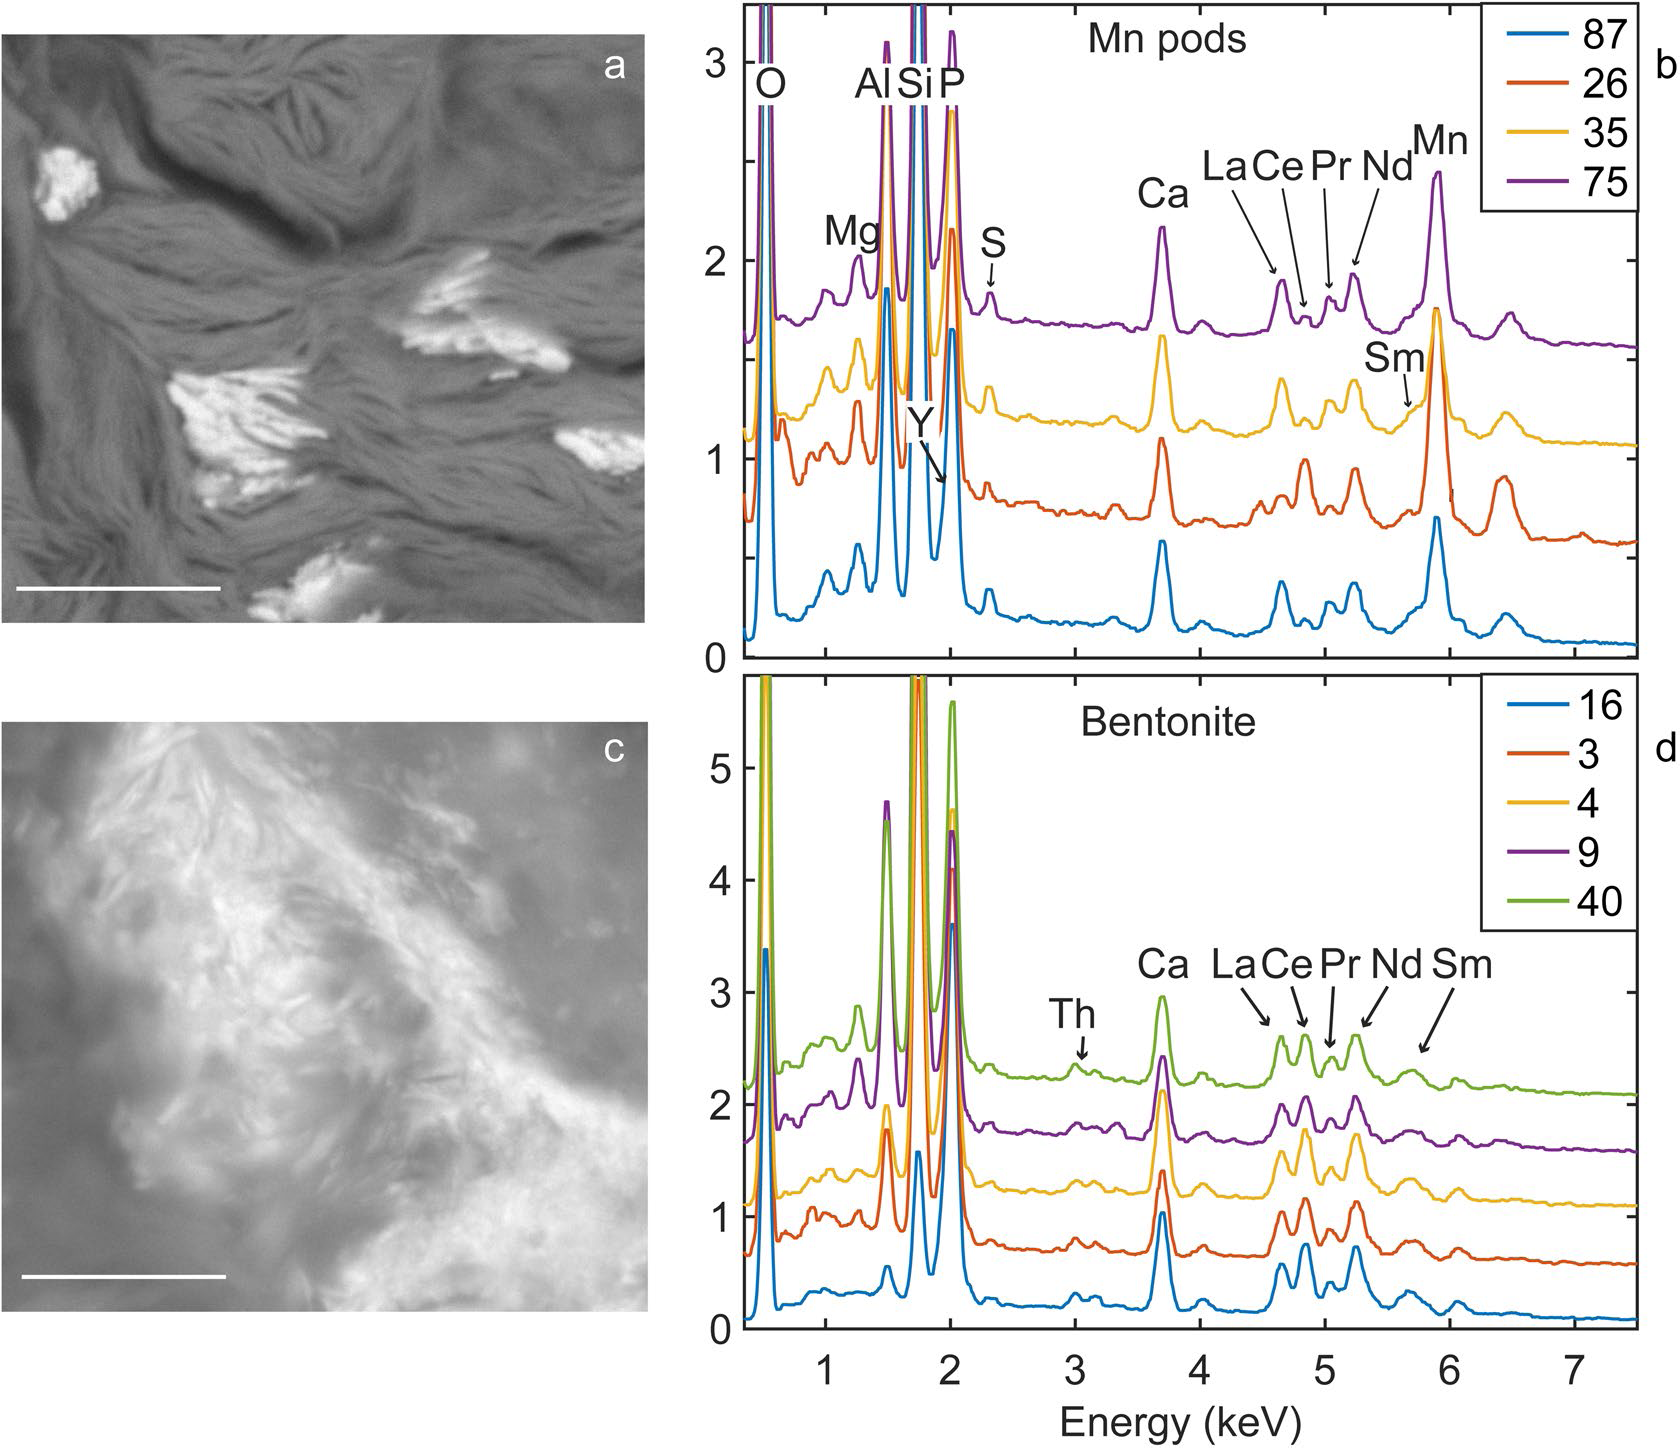
Other nanosize phosphates that hosted mainly light REEs were also frequent in the Mn pods, clustered in small aggregates, and having a larger mean particle size than the xenotime (Fig. 4b, Fig. 5a). The EDS data collected from these LREE-phosphate that were identified as rhabdophane by TEM analysis (see TEM section) indicated changing relative proportions of REEs between aggregates, particularly with respect to Ce (Fig. 5b). For a more quantitative estimate of REE variation in rhabdophane, the wt.% ratio of Ce and Nd with La was calculated (these REEs are usually present in rhabdophane and their peaks are little affected by overlaps) of different aggregates in the Mn pods, which resulted in means with standard deviation values of 0.42 ± 0.3 and 1.13 ± 0.15 for Ce/La and Nd/La, respectively. The large standard deviation confirmed the dramatic variability in the proportion of Ce. Rhabdophane in the Mn pods also hosted Y in sufficient concentration to cause an asymmetry on the left side of the P peak (confirmed by TEM), indicating a mean wt.% Y/La ratio of 0.83 ± 0.19, and trace amounts of S.
Comparison of EDS spectra of LREE-phosphates in Mn pods and ashfall deposit. a BSE Image of rhabdophane particles in Mn pods. b EDS spectra collected from different aggregates in the Mn pods. c BSE image of LREE-phosphate in bentonite interval. d EDS spectra from different aggregates in the bentonite interval. Scale bar in a and b is 1 μm

Such variability is in stark contrast with the uniform composition of LREE-phosphates found in the ashfall deposit sediments where it is uninfluenced by Mn oxides. Though fewer EDS spectra were collected from the bentonite and ash-bentonite mixed intervals, they all showed uniform intensity profiles and minor changes in the proportions of REEs, as indicated by mean Ce/La and Nd/La wt.% ratios of 1.47 ± 0.12 and 0.827 ± 0.06. Yttrium, identified by Lα peak corresponding to 1.92 keV, resulted in a Y/La mean wt.% ratio of 0.54 ± 0.07; Th and U were present at concentrations close to the detection limit (Fig. 5d).
The morphology and texture of LREE-phosphates also differed between the Mn pods and the ashfall deposit. LREE-phosphates in the Mn pods have rod-shaped morphology with edges at 90° angles, whereas in the ashfall deposits LREE-phosphates are smaller and have flaky morphology similar to that of clay particles. In fact, TEM analysis of flaky LREE-phosphates in a white bentonite from the nearby H. W. Johnson pit — which formed by alteration of the same ash layer (Yancey et al., Reference Yancey, Heizler, Miller and Guillemette2018) — were identified as monazite, an anhydrous REE-phosphate mineral (Berti et al., Reference Berti, Slowey, Yancey and Deng2022). These differences suggest that interaction with pore fluid drove dissolution in the ashfall deposit and reprecipitation in the Mn pods.
TEM
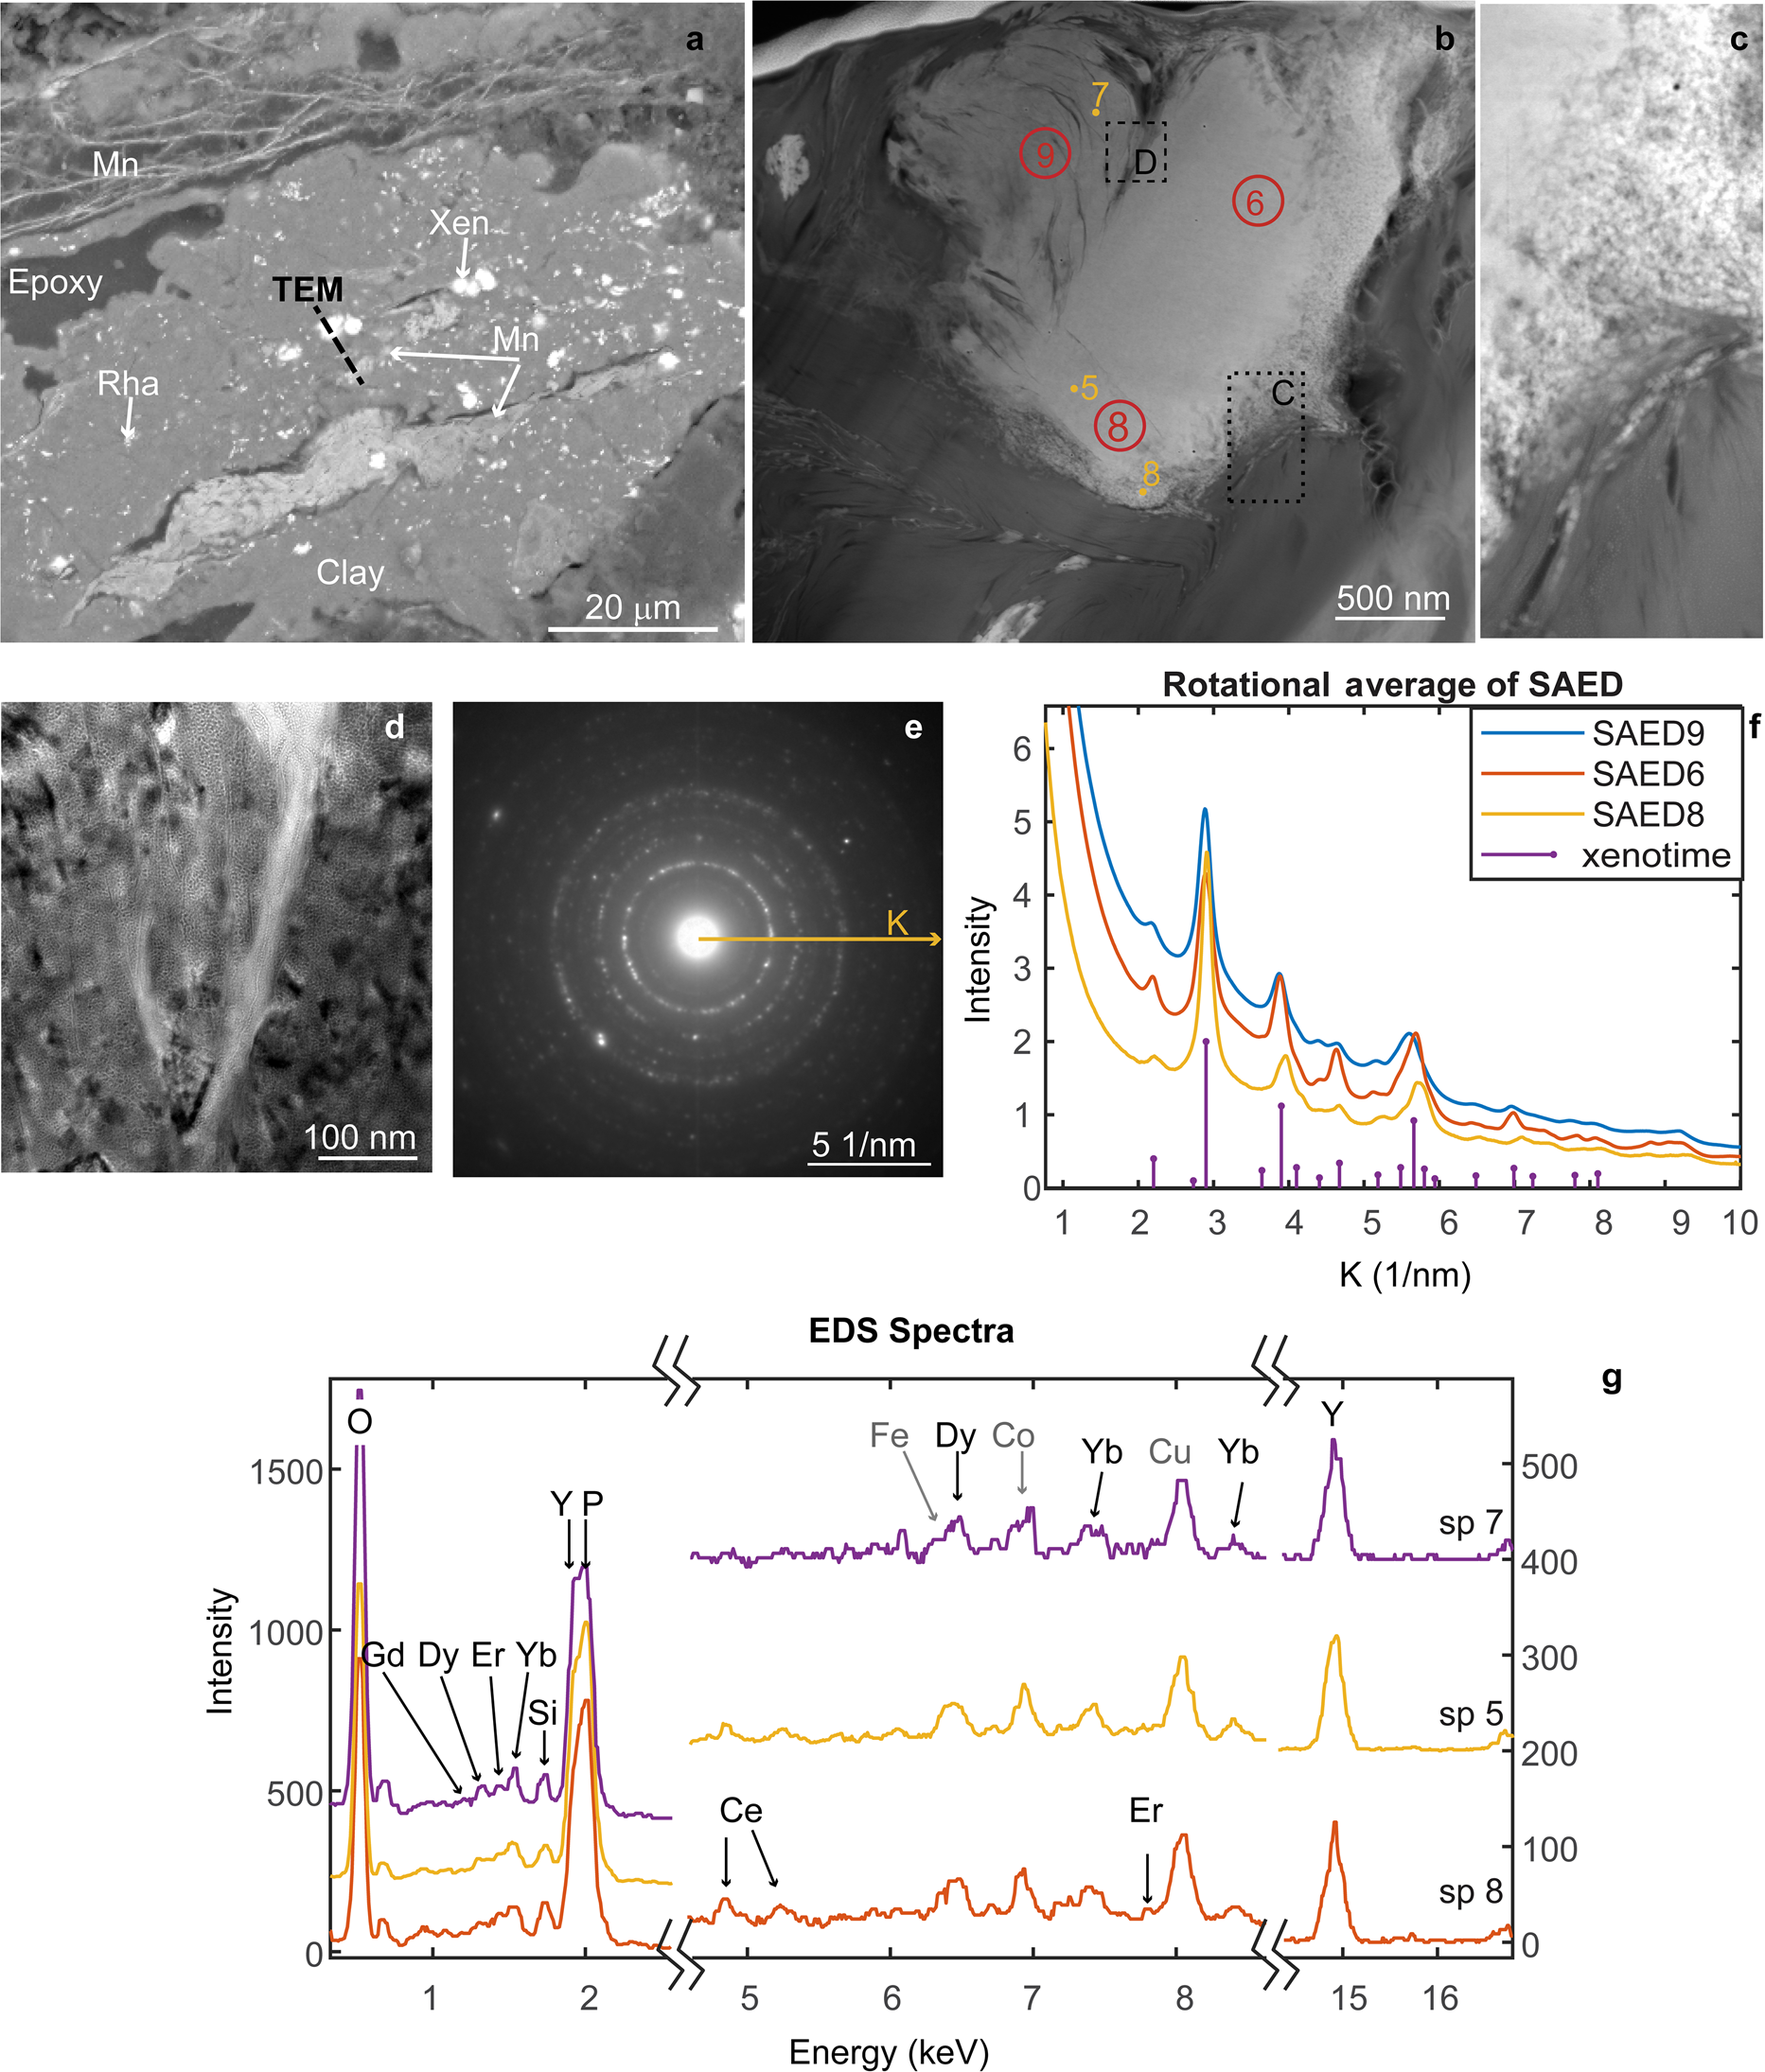
Further details were attained from TEM analysis of a FIB section extracted from a Y-phosphate mass surrounded by clay, which occurred near a vein filled with Mn oxides (Fig. 6a). The TEM-HAADF imagery, where contrast is proportional to atomic number, revealed this mass had a complex texture (Fig. 6b–d) with a band of loosely arranged nanoparticles on the right, a central region with the morphology of a single grain, and a scalloped texture on the left. In spite of its single grain appearance, higher magnification TEM images of the central and left regions showed a mottled texture arising from changes in diffraction contrast (Fig. 6d). Most importantly, SAED patterns (Fig. 6e) collected from ~ 200 nm diameter circular areas at different locations showed clear broad spotty rings that are evidence of diffraction from multiple crystals while the nanosize of the crystals contributed to the broadening of the rings. Comparisons of the SAED intensity profiles of three selected areas (Fig. 6b) are indicated by red circles 6, 8, 9, where the profiles were extracted around a radius vector k, with length of 10 nm–1 (k = 1/d-space), rotationally averaged between 0 and 3600. All the profiles were similar (Fig. 6f), displaying peaks at the same k positions and relative intensities that matched those of xenotime, assuming random orientation and the structure of Ni et al. (Reference Ni, Hughes and Mariano1995).
FIB section from xenotime. a SEM-BSE image with location of the FIB section marked. b TEM-HAADF image of the FIB section where numbered points mark the locations of EDS while the red circles show the SAED patterns. c Higher magnification HAADF from location marked by black dotted rectangle in b. d TEM image of the area marked by the dashed rectangle in b. e Example of SAED pattern from the aggregate showing a ring pattern. f Rotational average intensity profiles calculated from SAED patterns collected from the areas marked 6, 8, 9 in b, and simulated K positions and relative intensities of xenotime according to the structure of Ni et al. (Reference Ni, Hughes and Mariano1995). g Three stacked TEM-EDS spectra of xenotime, collected from locations marked by dots 5, 7, 8 in b. The x-axis of the plot has been split into three regions to show the peaks from the main elements (O, P, and Y), plus elements occurring in trace amount (Ce, Dy, Er, and Yb); Fe, Co, and Cu peaks are from the instrument and TEM grid

The EDS spectra collected by point ID and by mapping the bottom region of the grain (Fig. 6, Supplementary Fig. S5) confirmed the composition of Y phosphate in all regions of the aggregate, with trace amounts of Ca, Ce, Dy, and Yb. Because Dy and Fe peaks partially overlap, broad Fe peaks implied the presence of Dy, and this was verified when the two peaks were resolved by decomposition using AZtec® software. The EDS did not detect changes between regions with different texture, except for lower signal intensity from the scalloped region which was due to greater porosity and lesser section thickness.
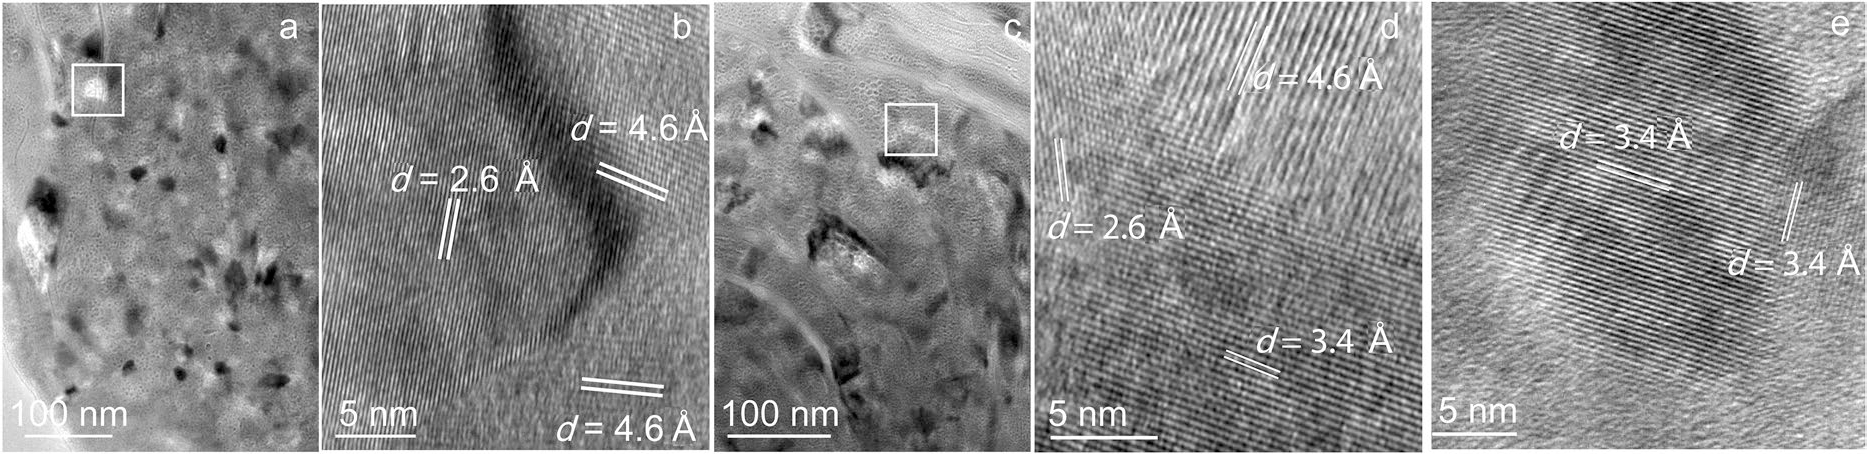
The TEM and HRTEM images collected from the central region, the scalloped region, and the transition between them showed the presence of crystals mainly in the size range between 20 and 60 nm, with fewer crystals in the size range 100–150 nm (Fig. 7). Changes in the direction of lattice planes at crystal boundaries (Fig. 7b, d), as well as crystal strain from misfit from crystal defects, caused the contrast changes that confer a mottled texture to the TEM images.
High-resolution TEM images from the aggregate. a Dense region showing variations in contrast due to multiple crystals; the white square marks the location of the HRTEM in b. b Strain at crystal boundaries due to change in lattice orientation appear dark. c Scalloped texture where bending arises from gradual change in crystal orientation, the white rectangle marks the location of d. d Lattice planes with different orientations at boundaries. e Nanoparticles as small as 20 nm attached by an edge

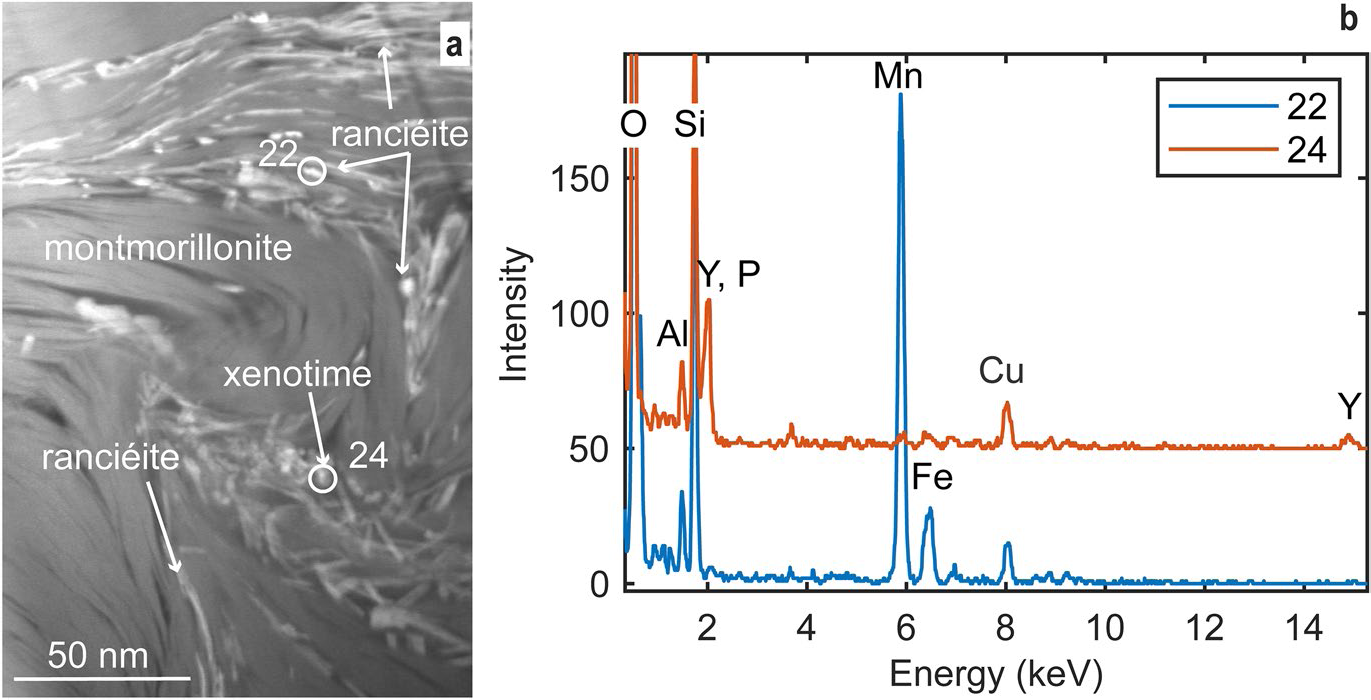
The multi-grain xenotime is enveloped by domains of tightly packed montmorillonite layers in face-to-face contact (visible as lines in Fig. 6a); the domains change orientation so as to follow the contour of the xenotime. In Fig. 8, the HAADF-TEM image shows that sheets of Mn oxide (bright contrast) arranged in face-to-face contact with the clays fill the void space in between clay domains and seem to grow laterally. EDS spectra collected from several bright contrast particles determined that the sheet particles are Mn oxides with Ca and Ba or Ca and Zn. While REEs were not detected by TEM-EDS in the Mn oxide minerals, particles of xenotime and rhabdophane were identified next to them (Fig. 8).
HAADF TEM image and corresponding EDS spectra of Mn oxides and xenotime growing between clays. a Bright contrast platy or prismatic particles of Mn oxides (ranciéite) and rare xenotime nanoparticles. b EDS spectra collected from the numbered circles in a. Note: Cu peak is from the grid

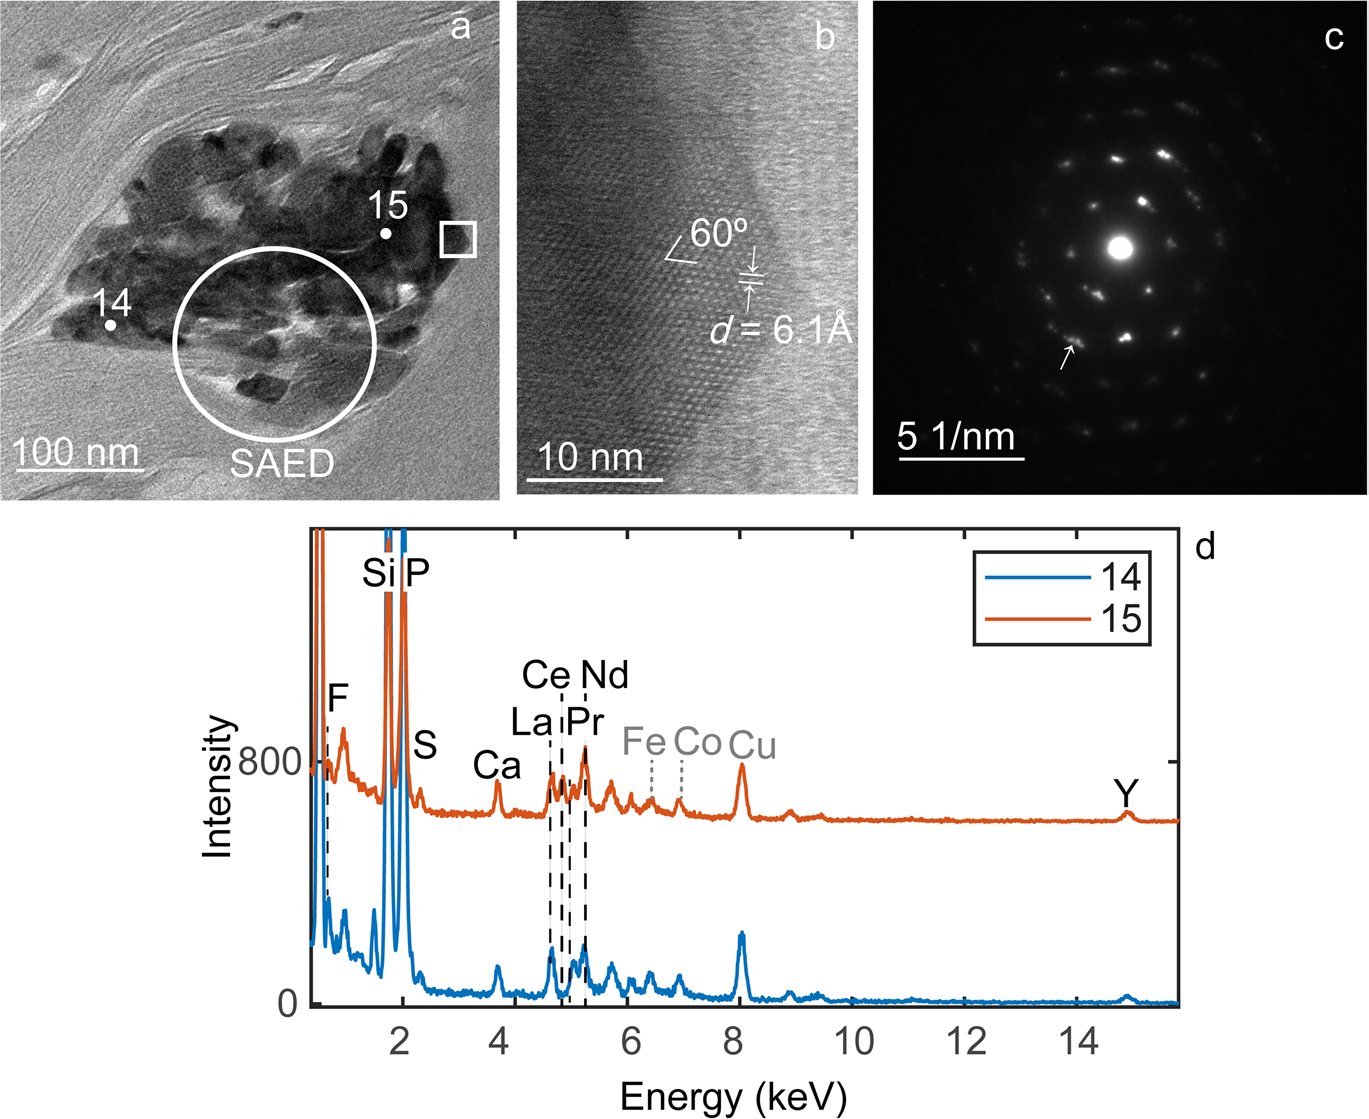
Light REEs were identified in rhabdophane (REEPO4•1.5H2O) nanoparticles that form smaller aggregates than xenotime, their presence bending the surrounding clays (Fig. 9). The HRTEM images and SAED patterns show a lattice with hexagonal symmetry, i.e. lattice planes at 60° angles in the HRTEM image (Fig. 9b) and equidistant reflections at 60° in the SAED. This symmetry combined with a lattice d spacing of 6.1 Å match well with the rhabdophane structure (Mooney, Reference Mooney1948), viewed along [001]. While the TEM image clearly showed multiple particles, the symmetric SAED pattern resembled a single crystal, except for peak broadening, striking, and fragmentation (see arrows in Fig. 9c) that denote an assembly of iso-oriented nanocrystals. The EDS spectra collected from two points in the aggregate (marked 14 and 15 in Fig. 9a) indicate a composition of phosphate with light REEs, Y, and trace amounts of S and F (Fig. 9d). Notably, the proportions of Ce relative to other REEs change within the aggregate, and similar variability was found in other aggregates analyzed by TEM as well. Silicon and Al are from the clay rather than phosphate. Similar results were obtained from TEM analysis of a second FIB liftout section from the location marked in (Fig. 4d).
TEM of rhabdophane. a TEM image of aggregate of rhabdophane nanoparticles (dark contrast) in clays. b HRTEM from square region in a shows a hexagonal lattice with d-spacing of 6.1 Å. c SAED from the circle region in a; the arrows indicate where multiple spots are visible. d EDS spectra from points 14 and 15 in a. Note: Cu, Fe, and Co peaks are from the grid and instrument, not the sample

Discussion
Rhyolitic ash beds provide a source of REEs for the Eocene Texas deposits that can be remobilized by alteration of the ash into bentonite (Badurina & Šegvić, Reference Badurina and Šegvić2022; Berti et al., Reference Berti, Slowey, Yancey and Deng2022; Zielinski, Reference Zielinski1982), but also by successive episodes of fluid migration and invasion. The Helms deposit shows complex changes in the REE trend (normalized to UCC), as the relatively flat REE trend of the ash fraction changed to a LREE enriched trend in the mid-section and top bentonite (Fig. 2), a change that has also been observed in other bentonite deposits in Gonzales, Texas (Michaedilis, 2011; Heintz et al., Reference Heintz, Yancey, Miller and Heizler2015) and elsewhere (Badurina & Šegvić, Reference Badurina and Šegvić2022). In the lower bentonite, however, the UCC-normalized trend shows M, HREE enrichment, as well as a negative Ce/Ce*. Remarkably, in the Mn pods the M, HREE enrichment was amplified with respect to the lower bentonite while the negative Ce anomaly was retained, accompanied by an order of magnitude higher REE enrichment. These variations across the deposit are consistent with the type of fractionation resulting from transport in solution (Bao & Zhao, Reference Bao and Zhao2008; Li et al., Reference Li, Zhou and Williams-Jones2020; Migdisov et al., Reference Migdisov, Williams-Jones, Brugger and Caporuscio2016; Nesbitt, Reference Nesbitt1979;) where fractionation between the light, medium, and heavy REE results from the REE tendency to form different secondary minerals, complexes with different ligands in solutions, or different reactivity with particulate surfaces (Nesbitt, Reference Nesbitt1979; Johannesson et al., Reference Johannesson, Stetzenbach, Hodge and Lyons1996; Censi, Reference Censi, Sprovieri, Larocca, Aricò, Saiano, Mazzola and Ferla2007). Further, the negative Ce/Ce* that developed in the lower bentonite and Mn oxides indicates precipitation from a solution depleted in Ce by oxidative scavenging, possibly catalyzed by adsorption on the surface of Mn oxides.
Alteration of volcanic ash into bentonite is accompanied by a loss of permeability (Galloway, Reference Galloway1978) as bentonite is impermeable; however, at the Helms pit, the development of sets of fractures cutting across bedding allowed for pore water from the overlying sand layer to percolate down. Additionally, the sharp boundaries between sandstone and bentonite function as discontinuities along which pore water can migrate laterally. Excavation exposures at the pit showed that Fe (oxyhydr)oxides deposited preferentially on fracture walls at the top and mid-section of the bentonite, whereas Mn oxide crusts precipitated at layer interfaces and Mn pods formed at the base of the ashfall deposit (Fig. 1). This zonation between Fe and Mn (oxyhydr)oxides indicates oxidizing conditions and downward flow direction of the fluid from which they precipitated because of the faster kinetics of Fe oxidation which requires a less oxidizing environment and lower pH than Mn, due to different reaction pathways (Liu et al., Reference Liu, Chen, Yang, Wei, Laipan, Zhu, He and Hochella2022; Luther, Reference Luther2005). Fractures terminate at the base of the bentonite, in correspondence with the boundary of a cemented sandstone. At the junction between fracture termination and layer boundary, invasion of the bentonite by the percolating fluid is evidenced, at the micro-scale, by the disturbed fabric of the clay, the tremendous expansion of void space, and the presence of authigenic Mn oxides and rare earth phosphates which bent and displaced surrounding clays (Fig. 4). Once precipitation began at one junction, Mn oxides continued to grow for as long as leaching through fractures persisted, thus growing into pod-shaped deposits that eventually bulged the overlying bentonite layers (Fig. 1). Lateral flow at the clay-sandstone boundary, favored by a gentle dip, may have accompanied the growth of the pods, thus contributing to the formation of veins and crusts. At the outcrop scale, this process resulted in a patchy distribution of Mn oxides pods including REEs.
The source of the Fe and Mn dissolved in the water percolating through the fractures is uncertain. In contrast to other major elements (e.g. Si, Al), the behavior of Mn during alteration of volcanic ash is more variable. For instance, Zielinski (Reference Zielinski1982) reported an increase in Mn concentration from volcanic ash to bentonite in the Troublesome Fm (Kremmling, Colorado) that he attributed to either structural incorporation in the clay structure or precipitation of hydrous secondary oxides. Namayandeh et al. (Reference Namayandeh, Modabberi and López-Galindo2020) reported both depletion and enrichment of Mn in Iranian bentonite deposits relative to their parent ash, while Christidis (Reference Christidis1998) reported no change but negligible Mn concentrations between ash and bentonite in deposits of the Aegean islands (Greece). In the Helms deposit, the very low Mn concentration (~ 0.06%) does not change in the mid-section between clay and ash fraction. Although the Mn concentration decreases in the top and bottom bentonite intervals (Table S1) suggesting some removal from the system, the amount released was minimal; additionally, the concentration of Fe is low (~ 1%) and uniform within the deposit (Table S1). Therefore, it was inferred that Fe and Mn were transported in pore fluid that migrated laterally in the sand layer on top of the bentonite or at the boundary in between the two — possibly following the groundwater path for long distances — before reaching the fractured section of the ashfall deposit where fluid percolation through the fracture system drove alteration of glass shards (which released REEs) as well as authigenic REE nanominerals.
The anomalously high concentrations of some metal ions in the pods, compared to UCC, derived from the strong adsorption and incorporation capacity that Mn oxides have for metal ions. Such enrichments are a common feature of ferro-manganese chemical deposits found at the bottoms of oceans, seas, lakes, rivers, and in the sedimentary record; their composition is widely used as a geochemical proxy (e.g. Bau et al., Reference Bau, Schmidt, Koschinsky, Hein, Kuhn and Usui2014; Liu et al., Reference Liu, Chen, Yang, Wei, Laipan, Zhu, He and Hochella2022; McKenzie, Reference McKenzie, Dixon and Weed1989). Marine ferromanganese deposits are classified based on the type of fluid from which they precipitated as hydrogenetic (from seawater), diagenetic (from pore water), and hydrothermal — each type being characterized by a different chemical signature (e.g. Bau et al., Reference Bau, Schmidt, Koschinsky, Hein, Kuhn and Usui2014; Bonatti et al., Reference Bonatti, Kraemer, Rydell and Horn1972; Conrad et al., Reference Conrad, Hein, Paytan and Clague2017). While geological evidence indicates that Mn pod formation is more recent than the deposition of the Helms ash layer and its alteration into bentonite, the data collected in this study were not sufficient to establish whether the formation of the Mn pods occurred in the presence of saline fluids in water where the ash was deposited or in the presence of low salinity water after the sediment was exposed on the coastal plain and subjected to groundwater flow conditions. Keeping in mind such limitation, the Helms Mn pods have a composition consistent with a diagenetic origin, for the lower concentrations of Co, Ni, and Cu than hydrogenetic deposits and higher Mn/Fe than hydrogenetic and hydrothermal deposits (Bonatti et al., Reference Bonatti, Kraemer, Rydell and Horn1972; Conrad et al., Reference Conrad, Hein, Paytan and Clague2017; Sasmaz et al., Reference Sasmaz, Zagnitko and Sasmaz2020, Reference Sasmaz, Sasmaz and Hein2021). Hydrothermal origin is further excluded by the geology of the region. Additionally, the normalized REE trend of marine diagenetic Mn oxides — inherited from seawater — is also similar to that of the Helms Mn oxides, especially the negative Ce/Ce* which in seawater derives from oxidative scavenging catalyzed by particulate surfaces (Bau et al., Reference Bau, Koschinsky, Dulski and Hein1996, Reference Bau, Schmidt, Koschinsky, Hein, Kuhn and Usui2014; Sasmaz et al., Reference Sasmaz, Zagnitko and Sasmaz2020, Reference Sasmaz, Sasmaz and Hein2021). However, the concentration of REEs is higher than what was reported for most other Fe–Mn deposits. For example, from a review of marine Fe–Mn deposits Bau et al., Reference Bau, Schmidt, Koschinsky, Hein, Kuhn and Usui2014 reported maximum total REE concentrations of 2282 ppm, and a median value for diagenetic nodules of 349 ppm; Conrad et al. (Reference Conrad, Hein, Paytan and Clague2017) reported total REE of ~ 2250 ppm from the California continental margin; Sasmaz et al. (Reference Sasmaz, Sasmaz and Hein2021) reported a mean total REE of 199 ppm for the Mn oxides sedimentary deposits of Chiatura, Georgia; and a mean total REE of 108 ppm for those of Nikopol (Sasmaz et al., Reference Sasmaz, Zagnitko and Sasmaz2020). The higher concentration in the Helms Mn pods (> 7000 ppm) supports weathering of the ashfall bed as the main REE source rather than adsorption from seawater.
The investigation by SEM and TEM of the rare earth occurrences added a better understanding of the remobilization processes that shaped these deposits. Whereas rare nanoparticles of xenotime and rhabdophane are found associated with thin sheets of ranciéite in the interlayer space of montmorillonite (Fig. 8), they are far more commonly separated from the Mn oxides in mineralogically segregated aggregates, suggesting a tendency of REE complexes to infiltrate farther into the ultrafine pore space of the montmorillonite than Mn. Nonetheless, the association indicates co-precipitation from the same aqueous solution under oxidizing conditions and that these authigenic minerals did not form by desorption of REEs during reductive dissolution of Mn oxide particulates (e.g. Och et al., Reference Och, Müller, Wichser, Ulrich, Vologina and Sturm2014; Sasmaz et al., Reference Sasmaz, Zagnitko and Sasmaz2020).
The xenotime aggregates of the Helms Mn pods are remarkable for their texture, morphology, and composition (Fig. 4,Fig. 6) which are consistent with rapid, heterogeneous nucleation from a supersaturated, percolating aqueous solution. Formation of xenotime has been reported in a broad range of geologic settings. In sedimentary and especially coastal settings, xenotime is usually found as epitaxial overgrowth on zircon, with which it is isostructural (Drost et al., Reference Drost, Wirth, Košler, Jørgensen and Ntaflos2012; Hay et al., Reference Hay, Dempster, Lee and Brown2009; Rasmussen, Reference Rasmussen2005; Rasmussen et al., Reference Rasmussen, Buick and Taylor1998). Similar overgrowths were observed in the Helms bentonite (current study) and in the nearby bentonite deposit at the H.W. Johnson pit (Berti et al., Reference Berti, Slowey, Yancey and Deng2022) but zircon is not associated with the xenotime aggregates in the Mn pods. Even for aggregates comprising a dense core surrounded by a halo or seemingly overgrowth, high resolution SEM and TEM images showed clearly that both the core and the halo/overgrowth regions are composed of nanoparticles, more and less densely packed, respectively (Fig. 6,Fig. 7), while EDS and SAED showed composition of xenotime; therefore, the different textures of the xenotime indicated different conditions of growth.
It seems unlikely that the xenotime core is a pseudomorph of a zircon grain which served as a substrate for epitaxial growth of the outer xenotime regions, and subsequently underwent complete dissolution and replacement because the concentration of Zr remained unchanged from the ashfall deposit (~ 130 ppm, as measured by ICP-MS). Further, zircon solubility is extremely low, and even in reported cases of (metamict) zircon dissolution by alkaline fluids at ambient temperature, re-precipitation occurs right on the grain rim or within a few microns (Delattre et al., Reference Delattre, Utsunomiya, Ewing, Boeglin, Braun, Balan and Calas2007; Franz et al., Reference Franz, Morteani and Rhede2015; Hay et al., Reference Hay, Dempster, Lee and Brown2009). It is also unlikely that the xenotime nanocrystals replaced a xenotime phenocryst that sourced the Y and P during congruent dissolution, as the solubility of xenotime phenocrysts is very low (Budzyń & Sláma, Reference Budzyń and Sláma2019; Cetiner et al., Reference Cetiner, Wood and Gammons2005), and the ICP-MS data indicated that Y was transported to the pods, along with the other REEs. Hence, it is more plausible that the xenotime aggregates (including their dense core) formed by precipitation from a supersaturated solution via heterogeneous nucleation when the solution flow became restricted by the narrowing of pore sizes, as it invaded the montmorillonite. Like epitaxial growth on zircon, fluid supersaturation would effectively lower the free-energy barrier to nucleation (De Yoreo et al., Reference De Yoreo, Gilbert, Sommerdijk, Penn, Whitelam, Joester, Zhang, Rimer, Navrotsky, Banfield, Wallace, Michel, Meldrum, Cölfen and Dove2015), yielding crystalline nanoparticles as small as 20 nm with poorly defined habit. Within densely packed cores like the one shown in Fig. 6, competing processes of coalescing nanoparticles and crystal growth are suggested by the large number of crystal defects and by some larger crystals (hundreds of nanometer range) with the di-pyramidal habit typical of xenotime, respectively (Fig. 7). A prolonged period of solution percolation along the same pore conduits would support aggregate growth, while also expanding the pore space, thereby modifying the flow path and velocity around the aggregate. Consistent with this interpretation, shadowing from the aggregate in Fig. 6, indicates a region of slower flow that allowed growth of larger crystals, elongated along the flow direction, which merged into a scalloped texture.
The crystal chemistry of xenotime remains rather uniform within the aggregate and between aggregates as demonstrated by the TEM-EDS and SEM–EDS data, respectively. Trace amounts of Dy, Yb, and other MREEs and HREEs in xenotime (Fig. 4,Fig. 6g) are common because their ionic radius — ranging between 0.97 and 1.04 Å (Clavier et al., Reference Clavier, Podor and Dacheux2011) — is similar to that of Y and, thus, favors isomorphous substitutions. Peak overlap and low concentrations limit the applicability of EDS-based quantification; nonetheless, at first approximation, a comparison between wt.% ratios calculated based on TEM-EDS for xenotime and ICP-MS for the same bulk sample showed similar ratios for Dy/Y (0.18 and 0.22), Ho/Y (0.03 and 0.04), and Yb/Y (0.21 and 0.18); other MREEs and HREEs are either at too low concentration or are more affected by peak overlapping to consider. Therefore, in principle, xenotime precipitation has the potential to affect the bulk concentration of MREEs and HREEs in the sample. Nonetheless, additional occurrences of MREEs and HREEs as absorbed ions on Mn oxides, or as exchangeable ions in the clays at concentrations below the EDS detection limit, are possible.
The persistent, small amounts of Ce in the xenotime are less straightforward to explain by isomorphous substitutions given the large difference in ionic radius between Ce3+ and Y. In fact, Ce (like the other LREEs) is commonly below the EDS detection limit in primary xenotime (Clavier et al., Reference Clavier, Podor and Dacheux2011) or even in xenotime overgrowths on zircon found in hydrothermal or diagenetic environments which tend to have a more complex composition (Drost et al., 2013; Franz et al., Reference Franz, Morteani and Rhede2015). One possible explanation is that xenotime is hosting Ce4+ (its ionic radius being similar to that of Y) which implies that Ce oxidation was ongoing during precipitation of xenotime and Ce4+ was scavenged by xenotime. Substitutions of tetravalent cations have been reported in xenotime (and other REE phosphates); in fact, Zr, which is also tetravalent, was also detected in the xenotime. Charge balance was restored by coupled substitutions with divalent cations, in this case Ca2+ (Clavier et al., Reference Clavier, Podor and Dacheux2011). Accordingly, an approximate formula for xenotime can be estimated from quantification of the TEM-EDS data using the Cliff-Lorimer method (Cliff & Lorimer, Reference Cliff and Lorimer1975): Y0.67Ca0.07Zr0.02Ce0.04Gd0.02Dy0.06Ho0.01Er0.03Yb0.07U0.01PO4.
Some adsorption of Ce on Mn oxides is indicated by the EDS data; however, the rarity of Ce detection in Mn oxides and the negative Ce/Ce* detected in the Mn pods indicate that this process is minor in the pods. Rather, the Ce/Ce* trend within the ashfall deposit (Table 1, Fig. 2) suggests that Ce precipitated shortly after remobilization and perhaps is present in larger concentrations than other LREEs in Mn oxide veins closer to the mid-section of the ashfall deposit or in Fe (oxyhydr)oxides crusts that coat fractures across the lower bentonite.
It is noteworthy that Ce is decoupled from other light REEs also in the rhabdophane — the main phase hosting LREEs in the Mn pods. TEM-EDS analysis demonstrated dramatic changes in Ce concentrations even within the same nanoparticle aggregate. This compositional variation corroborates rapid precipitation of rhabdophane from a supersaturated solution and is also consistent with experimental studies on crystallization of rhabdophane (Poitrasson et al., Reference Poitrasson, Oelkers, Schott and Montel2004; Shelyug et al., Reference Shelyug, Mesbah, Szenknect, Clavier, Dacheux and Navrotsky2018). Further, the compositional variability supports the notion that Ce oxidation is ongoing during formation of these secondary phases.
The results suggest other additional interesting aspects of LREE-phosphate formation. The porosity of the rhabdophane oriented aggregates identified by TEM (Fig. 9) may facilitate continuation of the interaction with circulating pore fluid, resulting in more compositional changes as they develop. Also, the stark changes that were identified between the LREE-phosphates in the Mn pods and those in the bentonite and ash intervals (Fig. 5) suggest different kinetics between the REE phosphates that crystallize during the alteration of volcanic ash into bentonite and the rhabdophane nanominerals that precipitate from the fluid percolating through fractures.
Conclusions
This study utilized SEM and TEM, in combination with EDS, to investigate the modes of occurrence of REEs in Mn oxide-rich pods located at the base of a 4 m bentonite-altered ash deposit, exposed at the Helms pit in Gonzales (Texas, USA), that is partially altered into bentonite. Enrichment of REEs in the deposit ranges between 300 and 730 ppm but increases sharply in the Mn-pods to a maximum of 7800 ppm. This change is accompanied by an increase in proportions of MREEs and HREEs relative to LREEs.
The SEM and TEM results show that nanoparticle aggregates of xenotime and rhabdophane are the main hosts of REEs in the Mn pods. The characteristics of the xenotime and rhabdophane indicate that they formed in a low temperature, weathering environment by rapid precipitation from oxidizing pore fluids within the altered ash deposit. Spatial changes in REE abundances are consistent with downward fluid flow through fractures in the deposit. While Mn also precipitated from these oxidizing fluids, the results suggest a more distal source for the Mn. At the base of the bentonite-altered ash, cemented sandstone prevented further downward flow, prompting lateral invasion of fluids from fractures into the surrounding bentonite, at the sandstone interface, creating conditions for precipitation of both Mn oxides and REE-phosphates. The conditions that induced remobilization in the Helms bentonite deposit are likely to occur in other similar deposits of the Eocene Texas coastal plains and elsewhere, with possibly even greater enrichment. Therefore, the potential of bentonite deposits as a low environmental impact REE alternative source should be explored further.
Supplementary Information
The online version contains supplementary material available at https://doi.org/10.1007/s42860-023-00230-y.
Acknowledgements
The authors thank the editor, associate editor, and two anonymous reviewers for their insightful and constructive comments. This research made use of the Materials Characterization Core Facility (RRID:SCR_022202) and of the Microscopy and Imaging Center Core Facility (RRID: SCR_022128) at Texas A&M University. In particular, the authors thank Hansoo Kim and Andrew Mott for their valuable advice and assistance. The authors thank Charles Smith at BYK US, Inc. for facilitating sample collection.
Data Availability
Data generated during this study are available from the corresponding author upon reasonable request.
Declarations
Conflict of Interest
On behalf of all authors, the corresponding author states that there is no conflict of interest.