





1. Introduction
Breaking waves can have severe impacts on coastal structures such as wind turbine foundations, seawalls, breakwaters and bottom-fixed oscillating water column wave energy converters. As waves propagate on sloped seabeds towards the shoreline, they undergo shoaling where the wave length decreases and the wave height increases. At a certain depth (depending on the wave characteristics and the slope of the beach), the crest velocity will exceed the celerity of wave propagation and the waves will become unstable and break. Once wave breaking occurs, a large amount of wave energy will dissipate in the form of turbulence. The load exerted on coastal structures by breaking waves differs from non-breaking waves in that it is superposed with an additional, strong and transient force over a short time (Irschik, Sparboom & Oumeraci Reference Irschik, Sparboom and Oumeraci2004). The commonly used Morison equation (Morison, Johnson & Schaaf Reference Morison, Johnson and Schaaf1950) for determining non-breaking wave forces acting on a structure can therefore underpredict such breaking wave-induced forces. Thereby, an extra empirical term is usually needed if breaking-induced forces are calculated with the Morison equation (Wienke & Oumeraci Reference Wienke and Oumeraci2005).
The extensive use of vertical piles as basic components of coastal structures, e.g. monopile wind turbine foundations and pile-supported jetties, has made the study of wave impact on piles in the breaking zone of major practical importance. To investigate the breaking wave forces on a vertical pile located on a sloped bed, many earlier studies have adopted experimental approaches since no theory was available for predicting such breaking wave force (Apelt & Piorewicz Reference Apelt and Piorewicz1987). Since the 1950s, experimental studies have been conducted with focus on the peak force induced by breaking waves on a vertical pile and the controlling factors to the maximum force. For example, Hall (Reference Hall1958) measured the maximum breaking wave forces on a vertical pile located on a beach slope of  $1\,{:}\,10$. He noticed that the maximum force is very sensitive to the position of the pile with respect to the breaking point. Honda & Mitsuyasu (Reference Honda and Mitsuyasu1974) later conducted a similar experiment on a
 $1\,{:}\,15$ sloping beach. Their measured wave forces were compared with the analytical values from the Morison equation, and it was found that the measured maximum wave forces were approximately five times larger. They also compared their measurements with those from Hall (Reference Hall1958) and analysed the effect of the bed slope on the peak force. Apelt & Piorewicz (Reference Apelt and Piorewicz1987) conducted similar experiments on a
 $1\,{:}\,15$ sloping beach. They found that the maximum breaking wave force on a vertical pile is not only influenced by the bottom slope and wave steepness, but also by the cylinder diameter to wave height ratio. Based on experimental data, Wiegel (Reference Wiegel1982) proposed an empirical approach to predict forces exerted by breaking waves, which requires the magnitude of a curling factor, though its accuracy has not yet been fully proved. Kyte & Tørum (Reference Kyte and Tørum1996) conducted experimental studies on plunging breaking wave forces on a vertical pile both in regular and irregular wave conditions. They have also measured the duration of the resulting impact forces and proposed engineering formulae to estimate the wave forces. A recent experiment conducted by Irschik et al. (Reference Irschik, Sparboom and Oumeraci2004) measured the breaking wave forces on a slender pile located at the end of a
 $1\,{:}\,10$ sloping beach. Their experiments are seemingly the most often modelled in recent computational fluid dynamics (CFD) studies involving progressive waves breaking on a vertical pile, e.g. Choi, Lee & Gudmestad (Reference Choi, Lee and Gudmestad2015), Jose et al. (Reference Jose, Choi, Giljarhus and Gudmestad2017), Kamath et al. (Reference Kamath, Chella, Bihs and Arntsen2016), Bihs et al. (Reference Bihs, Kamath, Chella and Arntsen2016), Liu et al. (Reference Liu, Jose, Ong and Gudmestad2019) and Qu, Liu & Ong (Reference Qu, Liu and Ong2021). The experimental data of Irschik et al. (Reference Irschik, Sparboom and Oumeraci2004) have been analysed and for the first time been presented in the work of Choi et al. (Reference Choi, Lee and Gudmestad2015), where the effect of dynamic amplification due to the structural vibration was filtered such that the net breaking wave force could be used to validate CFD models utilizing a fixed structure.
In most recent CFD studies involving breaking waves on a vertical pile, Reynolds-averaged Navier–Stokes (RANS) equations based turbulence models have been used as closure, e.g. Jose et al. (Reference Jose, Choi, Giljarhus and Gudmestad2017), Bihs et al. (Reference Bihs, Kamath, Chella and Arntsen2016), Liu et al. (Reference Liu, Jose, Ong and Gudmestad2019), Qu et al. (Reference Qu, Liu and Ong2021) and Ghadirian & Bredmose (Reference Ghadirian and Bredmose2020). For such a three-dimensional (3-D) CFD problem involving two-phase fluids (water and air) interacting with a structure, direct numerical simulation (DNS) is unrealistic due to its large computational costs. Large eddy simulation (LES) is less expensive than DNS, but still requires much higher computational cost than RANS models (see, e.g. § 9.6 of Sumer & Fuhrman Reference Sumer and Fuhrman2020). The numerical study of Choi et al. (Reference Choi, Lee and Gudmestad2015) used LES with a Smagorinsky (Reference Smagorinsky1963) sub-grid scale model based on the finite difference method (FDM). Free surface tracking was based on the volume-of-fluid (VOF) method. Jose et al. (Reference Jose, Choi, Giljarhus and Gudmestad2017) compared the FDM-based LES model used in Choi et al. (Reference Choi, Lee and Gudmestad2015) to the finite volume method based RANS two-equation model, i.e. the standard  $k$–
 $\omega$ shear stress transport (SST) model (Menter Reference Menter1994) (where
 $k$ is the turbulent kinetic energy density and
 $\omega$ is the specific dissipation rate). They concluded that the results are more or less the same: both models reasonably predicted the peak force, but yielded a delayed prediction of the secondary load cycle (SLC), while the model used in Choi et al. (Reference Choi, Lee and Gudmestad2015) required a much larger number of cells and computational cost. Kamath et al. (Reference Kamath, Chella, Bihs and Arntsen2016) and Bihs et al. (Reference Bihs, Kamath, Chella and Arntsen2016) modelled the experiment conducted by Irschik et al. (Reference Irschik, Sparboom and Oumeraci2004) using the standard
 $k$–
 $\omega$ model as turbulence closure. They incorporated an empirical relationship for the specific turbulence dissipation at the free surface region (Naot & Rodi Reference Naot and Rodi1982). This modification is similar to the buoyancy-modified
 $k$–
 $\omega$ model proposed in Devolder, Troch & Rauwoens (Reference Devolder, Troch and Rauwoens2018) that aimed to remove the turbulence pollution from the air phase to the water phase. Kamath et al. (Reference Kamath, Chella, Bihs and Arntsen2016) calculated wave forces on the vertical cylinder with waves breaking before, on and behind the cylinder. It was shown that when the overturning wave crest hits the cylinder just below the wave crest level, the force will be the largest among these scenarios. Liu et al. (Reference Liu, Jose, Ong and Gudmestad2019) modelled the Irschik et al. (Reference Irschik, Sparboom and Oumeraci2004) experiment using the standard
 $k$–
 $\omega$ SST turbulence closure model, though their cylinder was located half a diameter downstream relative to that in, for example, Choi et al. (Reference Choi, Lee and Gudmestad2015), Kamath et al. (Reference Kamath, Chella, Bihs and Arntsen2016), Bihs et al. (Reference Bihs, Kamath, Chella and Arntsen2016) and Qu et al. (Reference Qu, Liu and Ong2021).
Recently, Qu et al. (Reference Qu, Liu and Ong2021) evaluated different RANS-based two-equation turbulence models for simulating the experiment of Irschik et al. (Reference Irschik, Sparboom and Oumeraci2004), in which waves are again breaking on a vertical cylinder with its centre located at the end of the  $1\,{:}\,10$ slope. They compared the numerical CFD results using (a) no turbulence model (assuming laminar flow), (b) the standard
 $k$–
 $\omega$ SST model (Menter Reference Menter1994) with and without a buoyancy production term, (c) the stabilized
 $k$–
 $\omega$ SST model (Larsen & Fuhrman Reference Larsen and Fuhrman2018) with and without a buoyancy production term, and (d) the standard realizable
 $k$–
 $\varepsilon$ model (Shih et al. Reference Shih, Liou, Shabbir, Yang and Zhu1995) (where
 $\varepsilon$ is the turbulence dissipation rate). First, it was shown that both the standard
 $k$–
 $\omega$ SST model and the standard realizable
 $k$–
 $\varepsilon$ model predicted large turbulence kinetic energy
 $k$ in the potential flow region before wave breaking (which is very likely unphysical). This is consistent with the analysis in the recent studies of Larsen & Fuhrman (Reference Larsen and Fuhrman2018) and Fuhrman & Li (Reference Fuhrman and Li2020). They proved that these (in fact, seemingly all) two-equation models in their standard forms are unstable in the potential flow region beneath surface waves, which can lead to unphysical turbulence over-production (exponential growth) in the pre-breaking zones. This may artificially decay the waves and, hence, lead to delayed breaking. Moreover, as shown by Fuhrman & Li (Reference Fuhrman and Li2020), the standard realizable
 $k$–
 $\varepsilon$ model can have an exponential growth rate of turbulence that is three times larger than other models when the initial conditions fall into the unstable zone (as shown by Fuhrman & Li (Reference Fuhrman and Li2020), this model is conditionally unstable, in contrast to other standard two-equation models analysed thus far that are unconditionally unstable). The realizable
 $k$–
 $\varepsilon$ model may hence be extremely unstable for simulating progressive waves. The results in Qu et al. (Reference Qu, Liu and Ong2021) are generally consistent with this analysis, in that the standard realizable
 $k$–
 $\varepsilon$ model resulted in the highest pre-breaking turbulence levels, and with the breaking point delayed to behind the cylinder, in contrast to their other models. To eliminate turbulence over-production prior to the breaking region, Larsen & Fuhrman (Reference Larsen and Fuhrman2018) and Fuhrman & Li (Reference Fuhrman and Li2020) formally stabilized such two-equation turbulence models with a simple reformulation of the eddy viscosity. Consistent with these expectations, Qu et al. (Reference Qu, Liu and Ong2021) also showed that the stabilized
 $k$–
 $\omega$ SST model of Larsen & Fuhrman (Reference Larsen and Fuhrman2018) does not produce unphysical turbulence in the pre-breaking region. It is worthwhile to mention that the buoyancy production term should also seemingly be incorporated in turbulence models when simulating breaking waves (Devolder et al. Reference Devolder, Troch and Rauwoens2018; Larsen & Fuhrman Reference Larsen and Fuhrman2018; Fuhrman & Li Reference Fuhrman and Li2020) to avoid potential turbulence pollution from the air phase to the water phase. It is emphasized that while the buoyancy production term combats this problem, it does nothing to prevent turbulence over-production in the bulk potential flow region; see the discussion of Fuhrman & Larsen (Reference Fuhrman and Larsen2020). Although Larsen & Fuhrman (Reference Larsen and Fuhrman2018) and Fuhrman & Li (Reference Fuhrman and Li2020) have demonstrated that stabilized two-equation turbulence models can accurately predict the breaking point, the results of Qu et al. (Reference Qu, Liu and Ong2021) suggest that the stabilized
 $k$–
 $\omega$ SST model fails to predict the breaking point accurately. Their results likewise suggest that the breaking location is influenced by the choice of turbulence model, a point that will be thoroughly addressed in the present work. Moreover, none of the turbulence models employed by Qu et al. (Reference Qu, Liu and Ong2021) were able to provide consistent accuracy in terms of the free surface elevation, the breaking point, the induced breaking wave force and the turbulence characteristics. Their findings could possibly be due to the large Courant number (
 $Co = \bar {u}_i \Delta t/ \Delta x_i$, where
 $\bar {u}_i$ is the mean flow velocity,
 $\Delta t$ and
 $\Delta x_i$ are the time and grid length intervals, respectively) used in their simulations (with
 $Co=0.5$), which will also be specifically investigated in the present work. It is noted that Larsen, Fuhrman & Roenby (Reference Larsen, Fuhrman and Roenby2019) performed a detailed study on CFD modelling of non-breaking progressive waves using the VOF method in OpenFOAM. It was shown that a sufficiently small Courant number is required (
 $Co \leq 0.1$) to ensure good numerical accuracy in both free surface elevations and velocity kinematics, indicating that many previous simulations have likely not been converged.
Besides the peak force that has been extensively investigated in prior experimental and numerical studies, the SLC, which is sometimes linked to ‘ringing’, i.e. vibrations that appear at natural frequencies of the structures (Chaplin, Rainey & Yemm Reference Chaplin, Rainey and Yemm1997; Grue & Huseby Reference Grue and Huseby2002), has also been a focus in several recent studies, e.g. Kristiansen & Faltinsen (Reference Kristiansen and Faltinsen2017), Ghadirian & Bredmose (Reference Ghadirian and Bredmose2020), Antolloni et al. (Reference Antolloni, Jensen, Grue, Riise and Brocchini2020) and Xu & Wang (Reference Xu and Wang2021). The SLC (first reported by Grue, Bjørshol & Strand Reference Grue, Bjørshol and Strand1993) is a high-order nonlinear wave force that occurs at a frequency above the third harmonic (Antolloni et al. Reference Antolloni, Jensen, Grue, Riise and Brocchini2020). It can be close to the natural frequency of coastal or offshore structures, hence, causing so-called ‘ringing’ that contributes to structural fatigue. To date, the physical cause driving the SLC is still debated. Several explanations have been made in previous studies. For example, recent numerical simulations by Paulsen et al. (Reference Paulsen, Bredmose, Bingham and Jacobsen2014) and Kristiansen & Faltinsen (Reference Kristiansen and Faltinsen2017) have investigated the role of vortex generation on the SLC. Simulations of Paulsen et al. (Reference Paulsen, Bredmose, Bingham and Jacobsen2014) showed that the occurrence of the SLC is related to the downstream vortex formation. Kristiansen & Faltinsen (Reference Kristiansen and Faltinsen2017) conducted both an experimental study and a two-dimensional (2-D) cross-flow CFD simulation on the higher harmonic wave loads on a vertical pile. They suggested that the local rear run-up, which is caused by the pressure due to flow separation, is responsible for the SLC. This is in contrast to the earlier study of Grue et al. (Reference Grue, Bjørshol and Strand1993), who reported no flow separation while observing the SLC. A recent study of Antolloni et al. (Reference Antolloni, Jensen, Grue, Riise and Brocchini2020) examined the connection between vortex generation and the SLC. They found that the vortex formation has a significant contribution to the SLC when the vertical pile is exposed to long waves. However, in short waves where no lee-side vortex is formed, SLC still persists. They concluded that the SLC may be mainly driven by gravity wave effects rather than vortex formation.
Inspired by recent CFD studies, the present work will perform novel investigations involving advanced turbulence modelling of waves breaking incipiently on a vertical pile. We will adopt a Reynolds stress model, namely the Wilcox (Reference Wilcox2006) stress– $\omega$ model, as our primary turbulence closure model. The stress–
 $\omega$ model breaks free from the Boussinesq approximation that is the foundation of two-equation models, and instead solves for the six components of the Reynolds stress tensor directly. The stress–
 $\omega$ model is chosen because it has been analysed in the recent work of Li, Larsen & Fuhrman (Reference Li, Larsen and Fuhrman2022) and proven to be neutrally stable in the potential flow region beneath surface waves, thus, it naturally avoids any unphysical turbulence over-production in the pre-breaking zone. It has also shown very good accuracy in predicting surf zone breaking waves in Li et al. (Reference Li, Larsen and Fuhrman2022) and deep-water breaking waves in Li & Fuhrman (Reference Li and Fuhrman2021). Additionally, the standard Wilcox (Reference Wilcox2006)
 $k$–
 $\omega$ model and the stabilized variant of Larsen & Fuhrman (Reference Larsen and Fuhrman2018, hereafter called the LF18
 $k$–
 $\omega$ model), will also be applied for comparison. For completeness, we will likewise compare with simulations utilizing no turbulence model.
The remainder of the present paper is organized as follows: § 2 presents the turbulence closure models utilized in the present study; § 3 provides the details of the numerical set-up and boundary conditions of the simulations; § 4 demonstrates the influences of turbulence closure models and the Courant number on the predicted wave breaking point; § 5 investigates and discusses the predicted breaking wave forces in terms of the peak force and the SLC in a detailed manner; and § 6 provides the conclusions.
2. Turbulence closure models
The present simulations involving breaking waves and their interaction with a vertical pile are based on unsteady RANS equations, coupled with various turbulence closure models. In what follows we present governing equations for the various turbulence closure models utilized in the present work.
2.1. The Wilcox (Reference Wilcox2006)  $k$–$\omega$ model


The widely used two-equation Wilcox (Reference Wilcox2006)  $k$–
 $\omega$ turbulence model in its standard form with a buoyancy production term are expressed as
 \begin{gather} \frac{\partial \bar{\rho} k }{\partial t} + \bar{u}_j\frac{\partial \bar{\rho} k }{\partial x_j} = \bar{\rho} P_k - \bar{\rho} P_b - \bar{\rho} \beta^* k \omega + \frac{\partial }{\partial x_j} \left[ \left( \mu + \bar{\rho} \sigma^* \frac{k}{\omega} \right) \frac{\partial k}{\partial x_j} \right], \end{gather}
 \begin{gather} \frac{\partial \bar{\rho} \omega }{\partial t} + \bar{u}_j\frac{\partial \bar{\rho} \omega } {\partial x_j} ={-} \bar{\rho}P_{\omega} - \bar{\rho} \beta \omega^2 + \bar{\rho} \frac{\sigma_d}{\omega}\frac{\partial k}{\partial x_j}\frac{\partial \omega}{\partial x_j}+\frac{\partial}{\partial x_j}\left[ \left(\mu + \bar{\rho}\sigma \frac{k}{\omega} \right) \frac{\partial \omega} {\partial x_j} \right], \end{gather}
where  $x_j$ are the Cartesian coordinates,
 $\mu$ is the dynamic fluid viscosity,
 $\nu =\mu /\bar {\rho }$ is the kinematic fluid viscosity,
 $\bar {\rho }$ is the density of the fluid and
 $t$ is the time. The specific Reynolds stress tensor is defined as
 \begin{equation} \tau_{ij} ={-} \overline{u_{i}' u_{j}'}, \end{equation}
where the overbar denotes Reynolds (ensemble) averaging and the prime superscript denotes turbulent fluctuations. In the  $k$–
 $\omega$ model this is formulated via the Boussinesq approximation
 \begin{equation} \tau_{ij} = 2\nu_t S_{ij} - \frac{2}{3}k\delta_{ij}, \end{equation}
where  $\nu _t$ is the eddy viscosity,
 $\delta _{ij}$ is the Kronecker delta and
 \begin{equation} S_{ij}=\frac{1}{2}\left(\frac{\partial \bar{u}_i}{\partial x_j} + \frac{\partial \bar{u}_j}{\partial x_i} \right) \end{equation}
is the mean strain rate tensor. In (2.1) the shear production term
 \begin{equation} P_k = \tau_{ij}\frac{\partial \bar{u}_i}{\partial x_j} \end{equation}
is formulated in the form of eddy viscosity (again via the Boussinesq approximation), i.e.
 \begin{equation} P_k = p_0 \nu_t, \quad p_0 = 2S_{ij}S_{ij}. \end{equation}
The buoyancy production term is formulated as
 \begin{equation} P_b= p_b \nu_t, \quad p_b= \alpha_b^{*} N^2, \quad N^2=\frac{g_i}{\rho_0}\frac{\partial \bar{\rho}}{\partial x_i}, \end{equation}
where  $N^2=0.5 N_{ii}$ is half the trace of the Brunt–Väisälä frequency tensor expressed as
 \begin{equation} N_{ij}= \frac{1}{\rho_0} \left( g_i\frac{\partial \bar{\rho}}{\partial x_j} + g_j\frac{\partial \bar{\rho}}{\partial x_i}\right), \end{equation}
where  $\rho _0$ is the constant reference density of the fluid and
 $g_j$ is the gravitational acceleration. The eddy viscosity is calculated by
 \begin{equation} \nu_t=\frac{k}{\tilde{\omega}}. \end{equation}
In the Wilcox (Reference Wilcox2006)  $k$–
 $\omega$ model
 $\tilde {\omega }=\tilde {\tilde {\omega }}$, where
 \begin{equation} \tilde{\tilde{\omega}} = \max\left[\omega, \lambda_1\sqrt{\frac{p_0-p_b}{\beta^*}} \right], \end{equation}
which includes a so-called stress limiter via the second argument in the max function. Note that compared with the original Wilcox (Reference Wilcox2006) stress limiter, a buoyancy production  $p_b$ is included for the two-phase (air and water) flow applications, in consistency with (2.1). Here, we have also introduced
 $\tilde {\tilde {\omega }}$ for later use in § 2.2. In (2.2) the production term for
 $\omega$ is expressed as
 \begin{equation} P_{\omega}= \alpha \frac{\omega}{k}\frac{\tilde{\omega}}{\tilde{\tilde{\omega}}}P_k = \alpha \frac{\omega}{\tilde{\tilde{\omega}}}p_0. \end{equation}
The closure coefficients are (Wilcox Reference Wilcox2006, Reference Wilcox2008)
 \begin{gather} \begin{aligned} \alpha & =0.52, \quad \beta^*=0.09, \quad \beta_0=0.0708, \quad \beta=\beta_0 f_{\beta}, \\ \sigma & =0.5,\quad \sigma^*=0.6,\quad \sigma_{d0}=0.125, \end{aligned} \end{gather}
 \begin{gather} \sigma_d= \begin{cases} 0, & \displaystyle \frac{\partial k}{\partial x_j}\frac{\partial \omega}{\partial x_j} \leq 0,\\ \sigma_{d0}, & \displaystyle \frac{\partial k}{\partial x_j}\frac{\partial \omega}{\partial x_j} > 0, \end{cases} \end{gather}
 \begin{gather} f_{\beta}=\frac{1+85 \chi_{\omega}}{1+100 \chi_{\omega}},\quad \chi_{\omega}=\left\vert\frac{\varOmega_{ij}\varOmega_{jk}\hat{S}_{ki}}{(\beta^* \omega)^3} \right\vert, \quad \hat{S}_{ki}=S_{ki}-\frac{1}{2}\frac{\partial \bar{u}_m}{\partial x_m} \delta_{ki}. \end{gather}
In the present work,  $\lambda _1=0.2$ and
 $\alpha _b^*=1.36$, following Larsen & Fuhrman (Reference Larsen and Fuhrman2018).
2.2. The stabilized Larsen & Fuhrman (Reference Larsen and Fuhrman2018) $k$–$\omega$ turbulence model


Previous CFD works on modelling progressive waves breaking on a sloped beach using two-equation models (e.g. the Wilcox (Reference Wilcox2006)  $k$–
 $\omega$ model in § 2.1) have shown a persistent problem of over-production of turbulence in the potential flow region beneath surface waves; see, e.g. Lin & Liu (Reference Lin and Liu1998), Hsu, Sakakiyama & Liu (Reference Hsu, Sakakiyama and Liu2002), Brown et al. (Reference Brown, Greaves, Magar and Conley2016), Derakhti et al. (Reference Derakhti, Kirby, Shi and Ma2016), Devolder et al. (Reference Devolder, Troch and Rauwoens2018) and Qu et al. (Reference Qu, Liu and Ong2021). This over-production of turbulence has caused progressive waves to decay during long-time simulation even before reaching the breaking point. Larsen & Fuhrman (Reference Larsen and Fuhrman2018) have analysed several two-equation models and found that they are unconditionally unstable in the potential flow region beneath surface waves. They have then formally stabilized the two-equation models by reformulating the eddy viscosity. The stabilization approach involves a modification to
 $\tilde {\omega }$,
 \begin{equation} \tilde{\omega}=\max\left[ \tilde{\tilde{\omega}}, \lambda_2 \frac{\beta}{\beta^* \alpha } \frac{p_0}{p_{\varOmega}}\omega \right], \end{equation}
where
 \begin{equation} p_{\varOmega}=2 \varOmega_{ij} \varOmega_{ij}, \quad \varOmega_{ij} =\frac{1}{2}\left(\frac{\partial \bar{u}_i}{\partial x_j} - \frac{\partial \bar{u}_j}{\partial x_i} \right) \end{equation}
and  $\tilde {\tilde {\omega }}$ is as defined in (2.11). To limit the over-production of turbulence in the potential flow region,
 $\lambda _2=0.05$ was used in breaking wave simulations of Larsen & Fuhrman (Reference Larsen and Fuhrman2018), and is maintained in the present work. This model will be called the LF18
 $k$–
 $\omega$ model in what follows. Note that with
 $\lambda _2=0$, then
 $\tilde {\omega }=\tilde {\tilde {\omega }}$ and this model essentially reverts back to the Wilcox (Reference Wilcox2006)
 $k$–
 $\omega$ model.
2.3. The Wilcox (Reference Wilcox2006) Reynolds stress–$\omega$ model

As found in the recent study of Li et al. (Reference Li, Larsen and Fuhrman2022), the Boussinesq approximation used in all two-equation models is the fundamental reason for their instability in the potential flow regions beneath non-breaking surface waves. In contrast to two-equation RANS models, Reynolds stress turbulence models (both  $\omega$ and
 $\varepsilon$ types), e.g. the Launder–Reece–Rodistress–
 $\varepsilon$ model (Launder, Reece & Rodi Reference Launder, Reece and Rodi1975) or the stress–
 $\omega$ model (Wilcox Reference Wilcox2006), break free from the Boussinesq approximation. They were proved by Li et al. (Reference Li, Larsen and Fuhrman2022) to be neutrally stable for simulating non-breaking progressive wave trains, i.e. without having the problem of over-production of turbulence in the potential flow region beneath surface waves. Li et al. (Reference Li, Larsen and Fuhrman2022) then applied the Wilcox (Reference Wilcox2006) stress–
 $\omega$ model for simulating breaking waves on a sloped bed and achieved excellent accuracy, especially in the undertow velocity in the complicated inner surf zone, which even the best two-equation model in Larsen & Fuhrman (Reference Larsen and Fuhrman2018) (the LF18
 $k$–
 $\omega$ model) failed to accurately simulate. The stress–
 $\omega$ model consists of six equations for the Reynolds stress components,
 $$\begin{align} \frac{ \partial
\bar{\rho} \tau_{ij}}{\partial t} + \bar{u}_k
\frac{\partial \bar{\rho} \tau_{ij}}{\partial x_k}
&={-}\bar{\rho} P_{ij} + \frac{2}{3} \bar{\rho} \beta^*
\omega k \delta_{ij} -\bar{\rho} \varPi_{ij}\nonumber\\ &\quad +\,
\frac{\partial}{\partial x_k}\left[\bar{\rho} \left(\nu +
\sigma^*\frac{k}{\omega}\right)\frac{\partial
\tau_{ij}}{\partial x_k} \right] + \bar{\rho} \alpha_b^*
\frac{k}{\omega} N_{ij}
\end{align}$$
and one equation for the specific dissipation rate  $\omega$, as given in (2.2). The shear production term for
 $\omega$ is
 \begin{equation} P_{\omega}=\alpha \frac{\omega}{k} P_k = \alpha \frac{\omega}{k} \tau_{ij}\frac{\partial \bar{u}_i}{\partial x_j}. \end{equation}
The pressure–strain correlation is
 $$\begin{align} \varPi_{ij} &= \beta^*
C_1 \omega\left(\tau_{ij}+\frac{2}{3}k\delta_{ij}\right)
-\hat{\alpha}\left(P_{ij}-\frac{2}{3}P\delta_{ij}\right) \nonumber\\
&\quad -\hat{\beta}\left(D_{ij}-\frac{2}{3}P\delta_{ij}\right)
-\hat{\gamma}k\left(S_{ij}-\frac{1}{3}S_{kk}\delta_{ij}\right),
\end{align}$$
where
 \begin{gather} P_{ij}=\tau_{im}\frac{\partial \bar{u}_j}{\partial x_m}+\tau_{jm} \frac{\partial \bar{u}_i}{\partial x_m}, \end{gather}
 \begin{gather} D_{ij}=\tau_{im}\frac{\partial \bar{u}_m}{\partial x_j}+\tau_{jm}\frac{\partial \bar{u}_m}{\partial x_i}, \end{gather}
 \begin{gather} P=\frac{1}{2}P_{kk}, \end{gather}
 \begin{gather} k ={-} \frac{1}{2} \tau_{kk}. \end{gather}
The last term in (2.18) is the buoyancy production term as derived in Li et al. (Reference Li, Larsen and Fuhrman2022), which is proportional to  $N_{ij}$ from (2.9). The closure coefficients are (Wilcox Reference Wilcox2006)
 \begin{gather} \begin{gathered} C_1=1.8, \quad C_2=10/19, \quad \hat{\alpha}=(8+C_2)/11, \\ \hat{\beta}=(8C_2-2)/11, \quad \hat{\gamma}=(60C_2-4)/55,\quad \alpha=0.52, \\ \beta^*=0.09, \quad \beta_0=0.0708, \quad \beta=\beta_0 f_{\beta},\\ \sigma=0.5,\quad \sigma^*=0.6,\quad \sigma_{d0}=0.125,\end{gathered} \end{gather}
 \begin{gather} \sigma_d= \begin{cases} 0, & \displaystyle \frac{\partial k}{\partial x_j}\frac{\partial \omega}{\partial x_j} \leq 0,\\ \sigma_{d0}, & \displaystyle \frac{\partial k}{\partial x_j}\frac{\partial \omega}{\partial x_j} \geq 0, \end{cases} \end{gather}
 \begin{gather} f_{\beta} =\frac{1+85 \chi_{\omega}}{1+100 \chi_{\omega}},\quad \chi_{\omega} =\left\vert\frac{\varOmega_{ij}\varOmega_{jk}\hat{S}_{ki}}{(\beta^* \omega)^3} \right\vert,\quad \hat{S}_{ki} =S_{ki}-\frac{1}{2}\frac{\partial \bar{u}_m}{\partial x_m} \delta_{ki} \end{gather}
and  $\alpha _b^*=1.36$ as derived in Li et al. (Reference Li, Larsen and Fuhrman2022) (see their appendix A).
3. Numerical set-up and boundary conditions
The present study focuses on the experiment of Irschik et al. (Reference Irschik, Sparboom and Oumeraci2004), where waves propagate on a  $1\,{:}\,10$ sloped bed and break on the frontline of a vertical pile with its centre located at the end of the slope. The circular pile has diameter
 $D=0.7$ m. The layout of the numerical set-up, following the experimental study of Irschik et al. (Reference Irschik, Sparboom and Oumeraci2004), is presented in figure 1. The origin of the coordinate system is set at the centre of the pile at the undisturbed free surface. Waves are generated at the left end of the tank and propagate in the
 $x$ direction. The
 $y$ axis points in the transverse direction. The width of the flume is 5 m with the pile installed in the middle between the two sides. Following the experiment of Irschik et al. (Reference Irschik, Sparboom and Oumeraci2004), the wave period is
 $T=4.0$ s and the incident wave height is
 $H=1.3$ m. For the given wave conditions, the surf similarity parameter is calculated as
 \begin{equation} \xi_0=\frac{\tan\beta}{\sqrt{H_0/L_0}}, \end{equation}
where  $\tan \beta =1/10$ is the slope,
 $L_0=gT^2/(2{\rm \pi} )$ is the deep-water wavelength and
 \begin{equation} H_0 = H\sqrt{\tanh(k_wh)\left(1+\frac{2k_wh}{\sinh(2k_wh)}\right)} \end{equation}
is the deep-water wave height calculated according to linear wave theory, and  $k_w$ is the wavenumber at the paddle depth
 $h=3.8$ m. This yields
 $\xi _0=0.42$, corresponding to an expected strong spilling breaking scenario (
 $\xi _0<0.5$).
The layout of the present numerical set-up.

Based on our preliminary grid convergence study, the number of cells used per incident wave height is  $H/\Delta z=30$, combined with
 $\Delta x=\Delta y=1.5 \Delta z$, corresponding to approximately 322 grid cells per wavelength at the paddle depth. For the numerical schemes, a second-order interpolation scheme is used for divergence terms, e.g. the convection terms. The maximum Courant number is set as
 $Co=0.05$ to ensure that the simulation is stable and with accurate velocity fields, in accordance with the discussion in Larsen et al. (Reference Larsen, Fuhrman and Roenby2019).
The boundary conditions are set as follows: (1) At the inlet a wave generation zone is utilized, where waves are specified with a numerically exact streamfunction solution (Fenton Reference Fenton1988), utilizing the waves2foam toolbox (Jacobsen, Fuhrman & Fredsøe Reference Jacobsen, Fuhrman and Fredsøe2012). (2) At the outlet a wave absorption relaxation zone is utilized to minimize reflection. (3) The pile surface, tank bottom and two tank sides are set as non-permeable smooth walls with zero velocity (i.e. no slip condition) and zero normal gradient of the pressure. A standard smooth wall function for  $\omega$ is applied. (4) The top of the domain is the air. The interface between the air and the water is the free surface that is tracked with a volume fraction coefficient
 $\alpha$ (
 $\alpha =1$ for water,
 $\alpha =0$ for air and any value in between indicates a fluid mixture).
4. Prediction of the breaking point
4.1. Influence of the turbulence closure models
The study of Qu et al. (Reference Qu, Liu and Ong2021) suggests that the choice of turbulence model will affect the breaking point relative to the pile. In this section we will therefore reinvestigate the influence of the turbulence model on the breaking point using a small Courant number (i.e.  $Co=0.05$) and second-order accuracy of discretisation schemes. This again ensures good numerical accuracy in both free surface elevations and velocity kinematics, following Larsen et al. (Reference Larsen, Fuhrman and Roenby2019). In the next subsection we will discuss the effect of the Courant number on the breaking point. To investigate the influence of turbulence models on the breaking point in a cost-effective manner, we first remove the monopile at the end of the slope. Four 2-D simulations involving waves propagating up the
 $1\,{:}\,10$ slope are performed with (1) no turbulence model, (2) the Wilcox (Reference Wilcox2006)
 $k$–
 $\omega$ model, (3) the LF18
 $k$–
 $\omega$ model and (4) the Wilcox (Reference Wilcox2006) stress–
 $\omega$ model.
Figure 2 presents the wave profiles and turbulence levels when the waves just begin to break at the location of the pile frontline (the pile location is added merely as a reference). The time instant is at  $t/T=4.25$ when the waves have reached repeatable (periodic) status. It is interesting to see that using
 $Co=0.05$ and second-order schemes, the progressive waves break at the same location regardless of the turbulence model (indeed, even with no turbulence model). This contradicts Qu et al. (Reference Qu, Liu and Ong2021), but is in line with our own physical expectations: before wave breaking, there should be no significant turbulence production beneath the free surface, apart from the very thin boundary layer region near the bed (also evident in figure 2). Therefore, a laminar model (i.e. no turbulence model) should be able to accurately predict the wave profiles up to the onset of breaking. In the meantime, it should be expected that from wave shoaling on the slope to breaking on the cylinder front, the simulation with using an accurate (and stable, L18
 $k$–
 $\omega$) turbulence model should behave very similar to that without a turbulence model. In short, the breaking point should not be altered by the choice of turbulence model if a stable turbulence model is properly applied and the simulation is converged. This is clearly demonstrated in figure 2.
Wave profiles and turbulence levels when the waves are breaking right at the location where the frontline of the monopile is located with (a) no turbulence model, (b) Wilcox (Reference Wilcox2006)  $k$–
 $\omega$ model, (c) LF18
 $k$–
 $\omega$ model, (d) Wilcox (Reference Wilcox2006) stress–
 $\omega$ model. The time instant is
 $t/T=4.25$ when the waves reached repeatable status. (Note that (d) is plotted with
 $k/(\omega \nu )$ as the stress–
 $\omega$ model does not utilize the eddy-viscosity assumption; this expression is comparable to
 $\nu _t/\nu$ for two-equation models.) (a) No turbulence model,
 $Co=0.05$. (b) Wilcox (Reference Wilcox2006)
 $k$–
 $\omega$ model,
 $Co=0.05$. (c) The LF18
 $k$–
 $\omega$ model,
 $Co=0.05$. (d) Wilcox (Reference Wilcox2006) stress–
 $\omega$ model,
 $Co=0.05$.

Note that figure 2 is at an early time instant after waves reach a repeatable status. At this early time, the turbulence over-production with the Wilcox (Reference Wilcox2006)  $k$–
 $\omega$ model (figure 2b) has not yet grown to a significant level. If we further run the simulations to over 50 wave periods, an obvious instability of the Wilcox (Reference Wilcox2006)
 $k$–
 $\omega$ model can be seen. Figure 3(a) further presents results at a time instant
 $t/T=50.25$, computed with the Wilcox (Reference Wilcox2006)
 $k$–
 $\omega$ model. It is shown that turbulence level has now largely increased in the pre-breaking region. This over-production of turbulence extracts energy from the propagating waves and decays the wave amplitude, thus causing the waves to gradually break later than in figure 2. As indicated by the dashed line in figure 3(a), the wave breaking point is behind the location of the pile frontline. This problem does not exist with the LF18
 $k$–
 $\omega$ model (because of the stabilization), as shown in figure 3(b), where the turbulence at the pre-breaking region is kept small and the breaking point remains accurately on the pile frontline even after 50 wave periods. Similar results as in figure 3(b) have been achieved with the stress–
 $\omega$ model (because the model is neutrally stable), as well as with the no turbulence model; they are not shown here for the sake of brevity. A similar comparison and discussion can also be found in Larsen & Fuhrman (Reference Larsen and Fuhrman2018) and Li et al. (Reference Li, Larsen and Fuhrman2022).
Wave profiles and turbulence levels with (a) the Wilcox (Reference Wilcox2006)  $k$–
 $\omega$ model and (b) the LF18
 $k$–
 $\omega$ model at the time instant
 $t/T=50.25$. In (a) the vertical dashed line indicates the breaking point. (a) Wilcox (Reference Wilcox2006)
 $k$–
 $\omega$ model,
 $Co=0.05$. (b) The LF18
 $k$–
 $\omega$ model,
 $Co=0.05$.

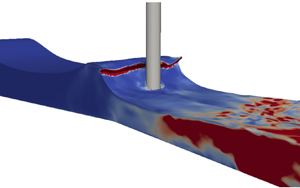
If we place the vertical pile in the tank, the same results can be reached, i.e. we find that the presence of the pile does not significantly alter the incipient breaking point. Figure 4 presents a screen shot for the 3-D simulation including the pile with waves initially breaking on the front surface of the pile. The simulation in figure 4 is performed with the stress– $\omega$ model at
 $t/T=8.25$ after waves reach a repeatable state. The fluid domain is coloured with the turbulent kinetic energy
 $k$. The red zone after breaking indicates high turbulent kinetic energy, while the blue zone prior to breaking indicates low turbulent kinetic energy. Similar scenarios have been observed using the LF18
 $k$–
 $\omega$ model and other models, which are not shown here for brevity.
Screenshots of the 3-D simulation of waves breaking exactly on the vertical pile frontline at  $t/T=8.25$, simulated with the Wilcox (Reference Wilcox2006) stress–
 $\omega$ model. (a) A 3-D view at the breaking instant. (b) Centre section (
 $y=0$) view at the breaking instant.

4.2. Effect of the Courant number
In this section we will further investigate the effect of the Courant number on the predicted breaking point. Figure 5 presents the 2-D breaking wave simulations (again, without the presence of the vertical pile) with the stress– $\omega$ model and with
 $Co$ ranging from 0.025 to 0.3. Figure 5(a,b) shows that with
 $Co=0.025$ and 0.05, the breaking point is on the frontline of the vertical pile, which is the same as that observed in the experiment (Irschik et al. Reference Irschik, Sparboom and Oumeraci2004) with the same wave condition and slope. This indicates that the breaking point is reasonably converged with
 $Co\leq 0.05$. However, as
 $Co$ is increased to 0.1 and larger, as shown in figure 5(c–e), the waves break earlier and earlier. Larsen et al. (Reference Larsen, Fuhrman and Roenby2019) demonstrated that for non-breaking wave simulations in OpenFOAM with the VOF method and PIMPLE algorithm (a combination of PISO – pressure implicit with splitting of operator – and SIMPLE – semi implicit method for pressure-linked equations), there is a tendency for surface elevations to increase and crest velocities to become severely overestimated, even over relatively short times. They found that a relatively small
 $Co$ is required to mitigate this problem. This implies that many past simulations may not have converged velocity kinematics, especially near the crest. The present study on breaking waves has demonstrated a similar phenomenon as the study on non-breaking progressive waves in Larsen et al. (Reference Larsen, Fuhrman and Roenby2019). It is hence found that a large
 $Co$ can alter the breaking point due to inaccurate flow kinematics, whereas maintaining
 $Co \leq 0.05$ can ensure reasonable convergence in the breaking position.
Computed wave profiles and turbulence levels at incipient breaking utilizing the Wilcox (Reference Wilcox2006) stress– $\omega$ model with various
 $Co$. Note that the case with
 $Co=0.05$ is a repeat of that shown in figure 2(d). Results are shown for (a)
 $Co=0.025$, (b)
 $Co=0.05$, (c)
 $Co=0.1$, (d)
 $Co=0.2$, (e)
 $Co=0.3$.

Interestingly, if a large  $Co$ is used together with a two-equation turbulence model that is unstable in the potential flow region beneath waves (e.g. the standard
 $k$–
 $\omega$ model, the standard realizable
 $k$–
 $\varepsilon$ model, which has a tendency of turbulence over-production), the two errors could cancel each other, i.e. early breaking due to a large
 $Co$ may be delayed due to decreasing wave heights caused by the turbulence over-production and associated unphysical energy dissipation. In this way the waves may coincidentally break on the pile, but the waves would expectedly have both a polluted turbulence field and inaccurate velocity kinematics. This is what we believe occurred in the simulation of Qu et al. (Reference Qu, Liu and Ong2021): their simulation with
 $Co=0.5$ and the standard
 $k$–
 $\omega$ SST model showed that their waves broke right on the pile frontline after 40 wave periods, but their domain was clearly polluted by turbulence over-production prior to breaking (see their figure 11d).
5. Prediction of breaking wave forces on the pile
Section 4 shows that a proper use of the turbulence model (either a stabilized two-equation model such as the LF18  $k$–
 $\omega$ model or a neutrally stable Reynolds stress model such as the stress–
 $\omega$ model) and a small Courant number can lead to an accurate prediction of the breaking point. In this section we will proceed specifically with these two models (and with no turbulence model as a reference) to perform quantitative investigations on the hydrodynamic forces exerted on the vertical pile by the breaking waves. The peak force and the SLC will be investigated and compared between the selected models. As we showed earlier (figure 3), standard two-equation models, e.g. the Wilcox (Reference Wilcox2006)
 $k$–
 $\omega$ model, have the inherent instability problem (unphysical exponential growth of the turbulent kinetic energy) beneath progressive waves, thus, they are excluded from the present section. The present 3-D simulations are performed for 12 wave periods. The surface elevation and forces computed with the selected turbulence models in the presence of the structure reach a periodic state from approximately the seventh wave period, as shown in figure 6. (In what follows, we define
 $t/T=0$ at the beginning of the seventh wave period.) Note that the 3-D simulations with a pile reach the periodic state slightly later than the 2-D simulations without a pile in § 4 where waves are repeatable from the fourth wave period. With the presence of the structure, the grid cells near the pile surface are further refined with the distance from the first cell centre to the cylinder surface of
 $0.011D$, which is equivalent to
 $0.12\Delta x$, i.e. around ten times smaller than the cell size along the wavelength in the 2-D simulations. This cell size is maintained in the area within a distance
 $D$ to the pile surface. The 3-D simulation with the stress–
 $\omega$ model required approximately one month to run in parallel on 64 processors on the supercomputing cluster at the Technical University of Denmark. The total computational time using the
 $k$–
 $\omega$ model is approximately 15 % less than with the stress–
 $\omega$ model.
The time series of the total horizontal in line force predicted with the Wilcox (Reference Wilcox2006) stress– $\omega$ model.

5.1. Peak load cycle
Before comparing the forces, the time series of the surface elevation near the vertical pile are presented in figure 7 to validate the simulated waves. The surface elevation at  $(x,y)=(-0.7\,\textrm {m},\ 1.9\,\textrm {m})$ was measured in Irschik et al. (Reference Irschik, Sparboom and Oumeraci2004) and presented in Choi et al. (Reference Choi, Lee and Gudmestad2015). Figure 7 shows the numerically predicted (i.e. with the Wilcox (Reference Wilcox2006) stress–
 $\omega$ model, the LF18
 $k$–
 $\omega$ model and no turbulence model) and the experimentally measured surface elevation
 $\eta$. A good match is observed between all three numerical predictions and the experimental data. As no turbulence is produced before wave breaking, the results with the turbulence models are essentially the same as without. This further confirms that the choice of turbulence model should not affect the accuracy of wave-induced surface elevations before wave breaking.
Comparison of computed and measured (Irschik et al. Reference Irschik, Sparboom and Oumeraci2004) surface elevations at  $(x,y)=(-0.7\,\textrm {m},\ 1.9\,\textrm {m})$. Here
 $t/T=0$ is defined at the seventh wave cycle when the simulation reaches a repeatable state (similarly on several forthcoming figures). In the legend, TM stands for turbulence model.

The peak force  $F$ (i.e. the total horizontal force in the
 $x$ direction) induced by breaking waves on the vertical pile is presented in figure 8. Numerical predictions with the Wilcox (Reference Wilcox2006) stress–
 $\omega$ model, the LF18
 $k$–
 $\omega$ model and no turbulence model are compared with the processed experimental data presented in Choi et al. (Reference Choi, Lee and Gudmestad2015). It is noted that the forces measured in the original experiments of Irschik et al. (Reference Irschik, Sparboom and Oumeraci2004) were recorded synchronously with a sampling rate of 200 Hz. In order to eliminate the amplified force component due to the structural vibration that was recorded in the experiment, Choi et al. (Reference Choi, Lee and Gudmestad2015) applied a low-pass filter of 20 Hz to cutoff the signal at the structural natural frequency and used the empirical mode decomposition (EMD, by taking the mean of the upper and lower signal envelope) to separate the net breaking wave force from the measured data. Figure 8 compares the processed (with both the low-pass filter and EMD) experimental data presented by Choi et al. (Reference Choi, Lee and Gudmestad2015) with the present numerical results. In figure 8,
 $t_D \approx 0.02 T$ is the duration of the sharp peak (or slamming force). It is seen that all three numerical simulations can predict the slamming duration reasonably in line with the measurement. However, it is noted that the numerical predictions of the peak force are generally higher than the processed experimental data. This might be due to the EMD applied in Choi et al. (Reference Choi, Lee and Gudmestad2015) to process the experimental data that significantly reduced the peak value. Figure 9(a) alternatively compares the computed force results from all three models with the low-pass filtered experimental force from Choi et al. (Reference Choi, Lee and Gudmestad2015), without EMD. It can therefore be seen that the peak experimental force (approximately
 $1.8\times 10^4$ N) matches quite well with those computed (e.g.
 $1.6\times 10^4$ N, as predicted with the stress–
 $\omega$ model). Both of these values are above the experimental peak (1.2
 $\times 10^4$ N) when both low-pass filtering and EMD are applied. In figure 9(b) we additionally compare the numerical results from the stress–
 $\omega$ model (black line) with both the unfiltered (raw) force signal (digitized from Choi et al. (Reference Choi, Lee and Gudmestad2015), green dotted line) and the same signal after application of low-pass filtering and EMD (red dotted line, as in figure 8). It can be seen in figure 9(b) that the peak force computed with the stress–
 $\omega$ model is in between the raw (unfiltered) and the processed (low-pass filter and EMD) peaks. Based on the comparisons in figure 9, and the differences in the model (fixed monopile) versus that used in the experiment, the computed peak force appears reasonable. It is likewise clearly seen from figure 9 that during the rise leading up to the peak (
 $t/T<0.25$), and also during the SLC (
 $t/T> 0.4$), neither the low-pass filter or EMD affect the force amplitude significantly. Therefore, in the discussion of SLC that follows, we adopt the processed (i.e. both low-pass filtered and EMD) experimental force signal for comparison. Note that this processed experimental data are available for a longer time duration during the SLC, as presented in Jose et al. (Reference Jose, Choi, Giljarhus and Gudmestad2017).
Instantaneous peak force from the present numerical predictions and the measured data processed in Choi et al. (Reference Choi, Lee and Gudmestad2015) with a low-pass filter and empirical mode decomposition (EMD).

Comparison of forces among selected numerical predictions and (a) the filtered experimental force without EMD and (b) the raw experimental force and after application of both filter and EMD. All experimental data are from Choi et al. (Reference Choi, Lee and Gudmestad2015).

Another common feature that can be noted for all three numerical results is that they predict an almost identical rise leading up to the peak force and more or less the same peak value. This is again because the peak force is measured right at the onset of wave breaking. From pre-breaking up to the breaking onset, we expect that even with no turbulence model, the peak force should be accurately predicted, as argued above. Our numerical results are in line with this expectation. This draws an unsurprising, but apparently new, conclusion, that a proper application of turbulence models should not alter the numerical prediction of the peak force when waves incipiently break right on the frontline of a vertical cylinder. Indeed, no previous studies have shown this result (likely due to the large Courant number and/or unstable turbulence models utilized). However, it is emphasized that this conclusion is only valid for cases where waves initially break right on the structure. If a wave breaks prior to reaching the structure, a turbulence model must be used to predict the wave force on the structure, as this becomes a post-breaking problem and breaking-induced turbulence will have been produced. It is also worthwhile to mention that to reach convergence,  $Co=0.05$ is applicable for wave simulations using the VOF method, ensuring good accuracy in the velocity field beneath the surface. This may not be a universal criterion for all kinds of RANS-based simulations, however.
5.2. Secondary load cycle
Following the peak force, a SLC occurs for the present case. The predicted SLC is compared with the experimental data in figure 10. It is seen that the numerical predictions in each subfigure reasonably capture the duration of the SLC, defined according to Chaplin et al. (Reference Chaplin, Rainey and Yemm1997) as the horizontal time span from points A to B in each subfigure, corresponding to approximately 11 % of the wave period. The amplitude of the SLC is defined as the vertical force difference between points C and D. The numerical predictions of the so-called SLC ratio, i.e. the SLC load divided by the numerical peak force, are around 3 % for all the numerical predictions. Previous experimental studies, e.g. Grue et al. (Reference Grue, Bjørshol and Strand1993), have reported amplitudes of the SLC up to 11 % of the peak force. The present numerical predictions are below this value.
Secondary load cycle by numerical predictions and the experimental measurement.

Although the numerical predictions with all three models seem to be able to reasonably capture the SLC load and duration, figure 10(b) shows an obvious magnitude difference of the force during the SLC between the LF18  $k$–
 $\omega$ prediction and the experimental data (almost double in the minimum force). The no turbulence model prediction of the force magnitude during the SLC in figure 10(c) is somewhere in between the numerical results in figure 10(a,b). Figure 10(a) presents a good match between the stress–
 $\omega$ model prediction and the measurement of the force magnitude during the SLC.
To provide an in-depth look of each simulation on the SLC, turbulence characteristics around the pile are investigated as follows. We have concluded earlier that the accurate peak force prediction is essentially independent of the turbulence model utilized. However, as the SLC is generated after wave breaking and is associated with the flow around the cylindrical body, turbulence models are expected to have a more significant effect on the SLC predictions. Figure 11 shows the vorticity field at  $z=-D/2$ at
 $t/T=0.49$, when the SLC reaches its local peak (see figure 10). It is seen that with the stress–
 $\omega$ model in figure 11(a), a strong vortex pair is formed in the lee-wake of the pile. Vortex shedding does not occur for this condition, as the Keulegan–Carpenter number (
 $KC=U_m T/D$, where
 $U_m$ is the amplitude of the flow velocity oscillation) is small with
 $KC\approx 6$ at
 $z=-D/2$, such that the flow changes direction prior to vortices being shed. A detailed discussion of
 $KC$ and the vortex shedding can be found in Li et al. (Reference Li, Ong, Fuhrman and Larsen2020). The prediction with the LF18
 $k$–
 $\omega$ model in figure 11(b) shows a weaker vortex pair attached to the pile. However, when predicting with no turbulence model, as shown in figure 11(c), the flow separation and vortex field are completely different. We expect this result is wrong as it would be necessary to refine the computational mesh and the time step to a DNS simulation level to ensure the turbulence is resolved, which is not practical for the present 3-D wave–structure interaction case. The simulation with no turbulence model in the present study utilizes the same mesh as with turbulence models on. Therefore, in the turbulent region, the turbulence is not solved in a physically correct manner. Thereby, the simulation with no turbulence model is dropped in the following analysis. When comparing figures 11(a) and 11(b), a stronger vorticity field is predicted with the stress–
 $\omega$ model, which in turn causes larger magnitude negative pressure on the lee side during the flow reversal. This generates a stronger suction force on the lee side and raises the total horizontal force up in figure 10(a), which matches much better with the measurement.
Vorticity field with (a) the Wilcox (Reference Wilcox2006) stress– $\omega$ model, (b) the LF18
 $k$–
 $\omega$ model and (c) no turbulence model at
 $z=-D/2$ and time instant of
 $t/T$=0.49, i.e. the local peak of the SLC.

Figure 12 further presents the 3-D coherent vortical structures identified by the  $Q$ criterion simulated with the stress–
 $\omega$ model and the LF18
 $k$–
 $\omega$ model. The
 $Q$ criterion (Dubief & Delcayre Reference Dubief and Delcayre2000) is the second invariant of the velocity gradient tensor, which is defined as
 \begin{equation} Q=\frac{1}{2}\left( S_{ij}^2-\varOmega_{ij}^2 \right). \end{equation}
Instantaneous isosurfaces corresponding to  $Q=200\,\textrm {s}^{-2}$ in the water phase are shown in figure 12 at two time instants, i.e. when the waves are just breaking on the pile front (
 $t/T= 0.28$) and when the SLC reaches its local maximum (
 $t/T = 0.49$). The isosurfaces shown in figure 12(a) with the Wilcox (Reference Wilcox2006) stress–
 $\omega$ model and 12(c) with the LF18
 $k$–
 $\omega$ model are similar at the wave breaking instant. The slight temporal difference is due to minor model differences. However, comparing figures 12(b) and 12(d) at the SLC local peak, obviously different structures are observed in the lee wake of the pile. Figure 12(b) with the stress–
 $\omega$ model predicts the pair of lee-wake vortices that were also shown in the DNS study of Jang et al. (Reference Jang, Ozdemir, Liang and Tyagi2021) at
 $KC=6$ (though in that study waves were simplified to oscillatory flows without considering the free surface). It is also noted that the formed vortex pair are tilting toward the bottom because of the boundary layer effect near the bottom wall. However, the isosurfaces simulated with the LF18
 $k$–
 $\omega$ model do not demonstrate this feature; the lee-wake vortices were not clearly formed.
Instantaneous  $Q=200\,\textrm {s}^{-2}$ isocontours in the vicinity of the vertical pile at the wave breaking instant and the local peak of SLC. Results are shown for (a)
 $t/T=0.28$, Wilcox (Reference Wilcox2006) stress–
 $\omega$ model; (b)
 $t/T=0.49$, Wilcox (Reference Wilcox2006) stress–
 $\omega$ model; (c)
 $t/T=0.28$, LF18
 $k$–
 $\omega$ model; (d)
 $t/T=0.49$, LF18
 $k$–
 $\omega$ model.

The differences in the vorticity field and the vortex formation are strongly linked to the flow separation. Figure 13 presents the horizontal velocity field  $\bar {u}$ and compares the separation points for the Wilcox (Reference Wilcox2006) stress–
 $\omega$ model and the LF18
 $k$–
 $\omega$ model. The separation point is defined as the point where the wall shear stress becomes zero, i.e.
 $(\partial u/\partial n)|_{wall}=0$. In each subfigure the red dots indicate the separation points from the stress–
 $\omega$ model and green squares from the LF18
 $k$–
 $\omega$ model. It is observed that the flow separates further downstream with the LF18
 $k$–
 $\omega$ model. This indicates that the simulated flow is more turbulent with the LF18
 $k$–
 $\omega$ model than with the Wilcox (Reference Wilcox2006) stress–
 $\omega$ model. A simple explanation for this is that the more turbulent boundary layer has greater mixing of momentum with the outer flow, thus delaying the separation. A closer look at the turbulence field near the boundary of the pile is presented in figure 14 at
 $z=-D/2$. It is seen that as flow travels from the upstream point along the pile surface, the turbulent kinetic energy
 $k$ around the pile is indeed higher when predicted with the LF18
 $k$–
 $\omega$ model than with the stress–
 $\omega$ model. Well-known shortcomings associated with the two-equation model, e.g. that the turbulence field near the curved surface is not accurately predicted, lead to later separation points and further underestimated vortex strength on the lee side.
Horizontal velocity field with (a) the Wilcox (Reference Wilcox2006) stress– $\omega$ model and (b) the LF18
 $k$–
 $\omega$ model at
 $z=-D/2$ and the time instant of
 $t/T$=0.49, i.e. the peak of the SLC. In each subfigure red dots indicate the separation points from the Wilcox (Reference Wilcox2006) stress–
 $\omega$ model and green squares from the LF18
 $k$–
 $\omega$ model. The red dashed lines in (b) indicate the locations of separation points projected from (a).

Turbulent kinetic energy around the pile at  $z=-D/2$ and the time instant of
 $t/T=0.49$, simulated with (a) the Wilcox (Reference Wilcox2006) stress–
 $\omega$ model and (b) the LF18
 $k$–
 $\omega$ model.

It can be seen from the discussion above that as the SLC is generated after wave breaking, it is closely associated with the flow around the cylindrical body. Thus, accurate turbulence modelling has a significant effect on the SLC predictions. Although some existing studies have claimed that the SLC is not necessarily linked to the flow separation (e.g. Grue et al. Reference Grue, Bjørshol and Strand1993; Ghadirian & Bredmose Reference Ghadirian and Bredmose2020), the flow separation point does affect the SLC amplitude when it occurs. Therefore, accurate turbulence modelling is seemingly required to predict the SLC. The present study demonstrates the advantage of using the stress– $\omega$ model, which breaks free from the traditional Boussinesq approximation for this purpose. Therefore, this model is able to predict both the peak and SLCs accurately.
6. Conclusions
The present work has focused on the turbulence modelling of incipient wave breaking on a vertical circular pile on a sloped bed. In the present study we have first investigated the effects of the turbulence model and the Courant number ( $Co$) on the breaking point. We showed that the breaking point is not affected by turbulence modelling, as long as the turbulence model is stable in the potential flow region (e.g. the LF18
 $k$–
 $\omega$ model (Larsen & Fuhrman Reference Larsen and Fuhrman2018) and the Wilcox (Reference Wilcox2006) stress–
 $\omega$ model) and the simulations are converged (with sufficiently small
 $Co$). We showed that simulations with
 $Co \leq 0.05$ can reach a converged breaking point, while
 $Co \geq 0.1$ can cause an obviously early breaking due to inaccurate velocity kinematics. Additionally, due to their instability (Larsen & Fuhrman Reference Larsen and Fuhrman2018; Fuhrman & Li Reference Fuhrman and Li2020), two-equation models in their standard forms (e.g. the Wilcox (Reference Wilcox2006)
 $k$–
 $\omega$ model, the
 $k$–
 $\omega$ SST model, the realizable
 $k$–
 $\varepsilon$ model) may lead to turbulence over-production and associated wave decay, thus delaying breaking. It it noted that if a large
 $Co$ is used together with a standard two-equation turbulence model, these two errors may cancel each other, and waves may break at a desired location, but polluted with a non-physical turbulence field. We believe this is what has occurred in the study of Qu et al. (Reference Qu, Liu and Ong2021), who showed that the standard
 $k$–
 $\omega$ SST model with
 $Co=0.5$ leads to an ‘accurate’ breaking location, but clearly coupled with such an unphysical turbulence field. Their work also showed that the stabilized
 $k$–
 $\omega$ SST model leads to early breaking, which in light of the present study seems clearly due to the large
 $Co=0.5$ used in their simulations.
The present study has then investigated breaking wave forces on a vertical cylinder based on the experiment of Irschik et al. (Reference Irschik, Sparboom and Oumeraci2004) with the Wilcox (Reference Wilcox2006) stress– $\omega$ model (as used previously in breaking wave simulations of Li et al. Reference Li, Larsen and Fuhrman2022), the stabilized LF18
 $k$–
 $\omega$ model and no turbulence model, all with low
 $Co=0.05$ and second-order discretization schemes. It has been shown that the peak force on the vertical cylinder is not affected by the choice of turbulence model (again, as long as the turbulence model is stable and the simulations are converged). Specifically, up to the onset of breaking where the incipient peak force occurs, accurate predictions can be achieved even without a turbulence model.
However, the prediction of the SLC requires proper turbulence modelling, as the process is post-breaking and involves turbulence production and lee-side flow separation. Compared with the LF18  $k$–
 $\omega$ model, the Wilcox (Reference Wilcox2006) stress–
 $\omega$ model has shown a more accurate prediction of the SLC, as the flow separation points and the vortical field in the lee wake are predicted with better accuracy. Although some existing studies indicated that the generation of the SLC does not require flow separation, but is rather mainly due to the pressure-induced suction force, it has been shown in the present work that the flow separation point significantly affects the pressure field in the lee wake and can hence further affect the suction force and the SLC magnitude. For waves breaking on a vertical pile, accurate turbulence modelling is thus essential for the SLC predictions. Overall, the Wilcox (Reference Wilcox2006) stress–
 $\omega$ model has been proved capable of providing good accuracy for the full processes, i.e. during wave propagation on the sloped bed, to breaking on the vertical pile and the induced peak force, and all the way to the flow separation, lee-wake vortex formation and the SLC.
Funding
The first author gratefully acknowledges financial support from the European Union's Horizon 2020 research and innovation program, Marie Sklodowska-Curie grant no. 713683 (COFUNDfellowsDTU, H.C. Ørsted Postdoc project SUBSEA: SimUlating Breaking waves and SEdiment trAnsport with stabilized turbulence models). The second author gratefully acknowledges financial support from the Independent Research Fund Denmark (projects SWASH – simulating wave surfzone hydrodynamics – and sea bed morphology, grant no. 8022-00137B and STORM – statistics and forces on structures from extreme – water waves in finite depth, grant ID: 10.46540/2035-00064B). This support is greatly appreciated.
Declaration of interests
The authors report no conflict of interest.



