Introduction
Measuring minorities in the general population, be it their numbers, contribution toward economic and social development, or cultural footprint, has always been a complex problem, further complicated by its political implications. The very act of studying a minority can be perceived as perpetuating existing social and ethnic tensions (Ahmad and Sheldon Reference Ahmad and Sheldon2009: 125). This endeavor becomes even more difficult when we try to approach historical minorities such as the migrants, with their baggage of preconceptions and the relative lack of quantitative data. Even in contemporary times, the scale and composition of migrant movements has sparked a public debate. The “Accession 8” migrants, who arrived in the United Kingdom following the 2004 Treaty of Accession, gave rise to new social tensions and sustained a presence in the national press in which the effective scale and composition of the movement figured prominently (on contemporary Polish migration, see Burrell Reference Burrell2009). The initial figures from the Home Office underestimated the significance of the phenomenon, and the migrant movement patterns proved to have quite a complex nature that challenged existing assumptions (for a quantitative estimate, see Pollard et al. 2008).
While some migrants quickly lose their distinctiveness in the new environment, others retain their social, cultural, and linguistic customs for quite a long time, forming smaller, ethnically based communities that are very difficult to precisely define, measure, and study. When does a migrant, or a descendant of a migrant, cease to be associated with migration?
Current concern about the number of migrants to Britain is nothing new. Finney and Simpson have reminded us that “numbers have been a part of race debates since those debates began” (2009: 2). More than a century ago, in 1903, the Royal Commission for Alien Migrants was obliged to admit that the real number of migrants was “unquantifiable” (Evans-Gordon Reference Evans-Gordon1903). Then, too, there was a sense that the actual number of immigrants was higher than those that the official census figures revealed (Holmes Reference Holmes1988: 21–33).
Based on a comprehensive analysis of Scottish census data, the objective of this research was to recalculate the number of people with a migrant background in Edinburgh, through a direct connection to another country or through a connection with people who still self-ascribe as foreign nationals. This study has reviewed the complete 1911 census for Edinburgh and, using methodologies developed specifically for this research, all the immigrants living in the town at the time of the census were identified. Instead of the old, limited definition of migrant simply as somebody born abroad and, therefore, identified solely from their birthplace, which “excluded the locally-born children of immigrant parents, whose numbers were known to be growing very rapidly” (Ballard Reference Ballard1996: 8), this project implemented a more open and complex definition. The familial links were reconstructed; those second- and third-generation family members alongside the naturalized subjects were identified and included in the analysis. This methodology is consistent with the Fourth National Survey of Ethnic Minorities (1993–94) where family origin was considered “a better basis for demographic analysis” while birthplace “was never reliable” (Berthoud et al. Reference Berthoud, Moodod and Smith1997: 13–14). The 1981 census, the last census that did not include a question about ethnic origin, addressed this problem in a similar way by aggregating the data for the residents of households whose heads were born in Pakistan (Anwar Reference Anwar1991: 3). Moreover, not just their families, but also their households were reconstructed. This included lodgers, boarders, and visitors, giving an insight into the types of people who lived under the same roof and into the often-underestimated network of relations that connected the migrants to the rest of society.
As the original data used by the registrar to create the official census report was blocked from public scrutiny for 100 years, it has only recently been possible to access it. Data from the Census Enumerators’ Books (CEBs) surpasses both in depth and scope the official census report and is, therefore, increasingly being used in historical demography studies. Specifically, the 1911 census contained, for the first time, a question about “nationality” that gives us an insight into official attitudes toward the migrants while shedding light on the mind-set and self-perception of the migrants. Interestingly, the data from the nationality question is entirely self-ascribed because the declarations of nationality made by the householders were the only source on the matter. This makes this data considerably more significant, as “[e]thnicity emerges and is made relevant through social situations and encounters” (Eriksen Reference Eriksen2002: 1).
Edinburgh has been chosen for this analysis because, given its overall size,Footnote 1 it offers a means to develop and test this methodology. The results show that migration to Scotland was far more significant than previously thought, the actual number being between two or three times the official return. This has far-reaching implications both for our understanding of the immigrant situation in Scotland before World War I and for an assessment of the magnitude of migration to the United Kingdom as a whole. There is no reason to believe that the methodology developed here could not be applied also to England and Wales.
Moreover, the results paint migration as a very much more complex and fluid phenomenon. The birthplace data highlight how a significant percentage of the migrants settled first in a different town, and in some cases in a different country, before moving to Edinburgh. While return migration has been extensively studied, this aspect of the mechanisms of settlement is quite novel.
This article is divided into six sections. The first reviews the historiography of migration into the United Kingdom and the second presents the census as a historical source and details the problems that it presents. The third section details the methodology, while the fourth presents the results and analyzes them. The fifth section illustrates the problems posed by some of the second-generation migrants and proposes a possible solution. The final section considers the implications on a local and a national level.
Historiography
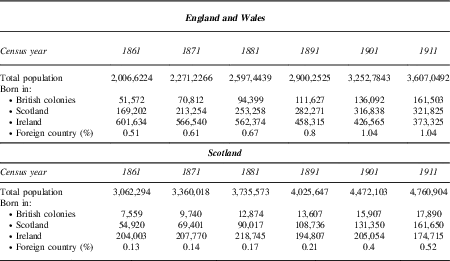
The first attempt, and for a considerable time the only one, at measuring migration in the United Kingdom had been the decennial population census. Starting from 1851 and becoming consecutively more detailed, the official census return used just one indicator to measure migration: the birthplace. Those who declared that they were born in a foreign country were considered migrants. This data, a summary of which is presented in tables 1 and 2, has been the basis for all discourse about migration for the last century.
In 1911, when treating foreign minorities, only those who were born abroad were considered by the census authorities while their British-born descendants, as well as the individuals who became British citizens through naturalization, were not investigated. This was because in the early twentieth century the United Kingdom still operated under the original form of the ius soli, formalized for the first time in England in 1608 to address the question of the newly integrated Scottish people. The ius soli is a concept of citizenship under which the place of birth determines citizenship, set against the opposing concept of ius sanguinis, where descent is the most important factor (see also Hansen Reference Hansen2005). This meant that any person born in Britain and in the related overseas territories was automatically a British subject. In this regard, the national origins of both parents were irrelevant.
A change occurred in the last few decades of the nineteenth century in response to the rising number of immigrants: Where previously the logic of the empire dictated the assimilation of entire populations, now some native-born elements in the rapidly urbanizing Britain perceived the migrants as a threat to their living standards. Eventually, in 1905, the British government promulgated the Alien Act, which introduced weak controls on immigration but nonetheless had a profound echo in the country. It was not until 1948 that the Nationality Act and the subsequent legislation were passed that distinguished commonwealth citizens from those of the United Kingdom (Hansen Reference Hansen1999).Footnote 2

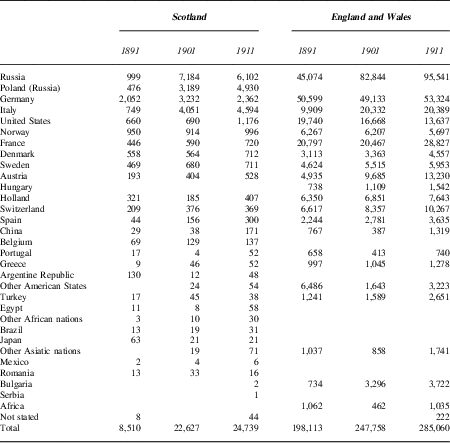
Foreign nationals living in the United Kingdom

Source: General Register Office (Great Britain) 1913; General Register Office (Scotland) 1913.
Note: The registrar for Scotland and the one for England and Wales enumerated foreigners in different ways. For example, London counted Polish and Russians together while Edinburgh did not distinguish between Austria and Hungary.
During the nineteenth century there was a marked increase in migration to the United Kingdom with different migratory movements impacting various areas of the nation with different strengths. Even before the Great Famine of the 1840s, there was a significant Irish presence in the United Kingdom, and this increased greatly during the second part of the century. For example, the Irish presence in England and Wales almost doubled in the 1840s, and at its peak the Irish constituted 6.2 percent of the total Scottish population and 2.6 percent of England and Wales. Although technically a form of internal migration (at the time the whole of Ireland was still a part of the United Kingdom), the influx of the Irish to British towns and cities constituted a crisis for British society: It required ad hoc relief payments by the British government, demonstrated the need for reform of the poor laws, and posed a labor market problem for residents in Liverpool, London, and the Lanarkshire burghs. The Irish poor were invariably stigmatized when social ills were considered (Reference BelchemBelchem 2014) and were vilified in official reports, as in the case of the Chadwick Report in 1843 (Poor Law Commission 1843). Subsequent waves of immigrants to Britain included the “Polish Jews” fleeing the pogroms of the Russian Empire in the 1880s. The most influential estimate of their number, only for England and Wales, is a starting point of 51,250 for 1875, 82,844 for 1901, and 95,941 for 1911. Of these, 53,537 were living in London in 1901 and 68,420 in 1911 (Holmes Reference Holmes1988: 25–29). This led to the passage of the Alien Act of 1905, designed specifically to stop paupers and criminals from immigrating.
Sandwiched between the Irish and Jewish influxes were a plethora of different migratory movements. Chief among these continentals, and comparable numerically to the Jewish migrants, were the German and Italian nationals. They, too, attracted their share of publicity and public consternation (ibid.: 22–24, 30–31, 51–52). In particular, the number of German clerks attracted so much attention that in England and Wales they were recorded separately as “foreign clerks” (Anderson Reference Anderson1980). In Scotland, Italian ice cream vendors gained an unenviable reputation both because of the allegedly unhygienic conditions in which their products were made and the fact that they were open on Sundays. Strict Sabbatarians easily found further sources of complaint about their supposed immoral practices (Davidson Reference Davidson2000).
A further influx of immigrants resulted from the Polish Resettlement Act 1947 and from the Displaced Persons and European Voluntary Workers scheme designed to address the problems of post-1945 stateless Europeans (Kay and Miles Reference Kay and Miles1988; Maslen Reference Maslen2013). Public interest in migration remained dormant until the arrival of Caribbean and other Commonwealth immigrants in the 1950s and 1960s, each still entitled to full citizenship due to birth in the British dominions, and so accorded unrestricted entry to Britain until this was amended in a series of immigrations acts. Fears concerning immigration were fueled by Enoch Powell’s famous “Rivers of Blood” speech in which “race” became a major issue (Hillman Reference Hillman2008). Despite these momentous developments, as Burrell and Panayi (Reference Burrell and Panayi2006: 16) noted, “Immigration has been, and remains, neglected in both national history and public memory.” In particular, the European element of immigration patterns has been neglected, and such studies of immigration as have been conducted tend to focus unduly on London. Moreover, Panayi (Reference Panayi2011) argues that “[m]ulticultural Britain has existed since the early 19th century.”
The Census
As Wrigley (Reference Wrigley1972: 1) has noted, modern states have collected so much data about their subjects that for practical reasons most of it could not be published. This is certainly the case with the British census. In 1854, the registration of births, deaths, and marriages in Scotland was divided into appropriate registration districts whose boundaries initially followed those of the civil parishes because ministers of the Established Church depended on certification fees as part of their sustenance. As urbanization advanced, this arrangement proved unsatisfactory and registration districts were consequently administered by the burghs. For the census, these districts were divided into enumeration districts and a temporary enumerator, who had to undertake the local collection of information, was assigned to each district.
The idea was to create a snapshot of British society every ten years. Every person sleeping in the household on a specific night, including servants, boarders, and lodgers, were included while anyone temporarily absent was to be recorded in the place where they spent the night. The date of the census was usually in March or April to avoid seasonal summer movements.
The process involved the delivery of blank forms or “schedules” by the enumerator to each household before the census night. Householders were expected to compile and return them to the enumerator the following morning. Otherwise, the enumerator had to fill them in on the spot through a direct enquiry. After collecting all the schedules, the enumerator had to copy all these schedules into the CEBs that were then revised by the district registrar who checked that they were correct and consistent with the schedules. In Scotland,Footnote 3 the majority of the household schedules have not been preserved, but the CEBs are still available.Footnote 4
The census is the most accurate source at our disposal,Footnote 5 considering that in the United Kingdom there is no population register system or a migration record (Jackson and Moch Reference Jackson and Moch1996: 54). As for the general public, there were few reasons to mislead the enumerators; although in some cases there was genuine uncertainty. For example, many did not know their precise age, and there were instances of individuals describing themselves as “naturalized British subject” without having gone through the necessary procedure (Taylor Reference Taylor1951: 718). Only “criminal aliens” risked expulsion and doing so was an offense punishable with a five-pound fine.
Methodology
There is no agreement on a precise definition of migrant. They can be defined by their birthplace, citizenship, or family origin (Anderson and Blinder Reference Anderson and Blinder2012: 3). All these definitions consider different kinds of data sources and offer diverse advantages and limitations (see also Bulmer Reference Bulmer1996: 37–44). Moreover, when studying European immigrants, we need to consider that “the dividing line between white people with UK and other origins is not easy to establish rigorously” (Berthoud et al. Reference Berthoud, Fumagalli, Lynn and Platt2009: 8) and that there was always the “realistic option of adopting forms of behaviour which would render them virtually indistinguishable from the native English” (Ballard Reference Ballard1996: 3).
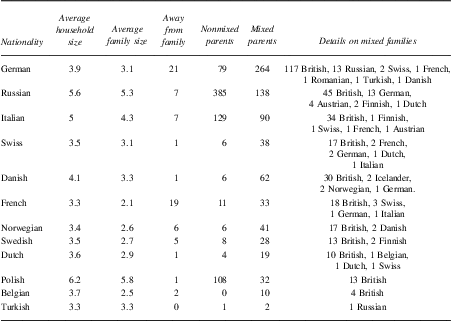
In this article migrants will be addressed based on their “ethnicity,” which is defined as “self-adopted identity based on a mixture of physical attributes, birthplace, legal status (Nationality), but also and in particular on family origins” (Finney and Simpson Reference Finney and Ludi2009: 15). This kind of definition, which has been adopted in many studies of minorities, has “the merit of combining the self- with popular ascription, and so is inclusive rather than exclusive” (Alderman Reference Alderman1998: 1). So, alongside the people born abroad, this article will count their descendants who still lived in their households and the naturalized British subjects.Footnote 6 This methodology is particularly suited to this subject because the number of migrants living in households without any other members of their families was extremely limited as it is possible to see in table 4.
Reviewing the census, the column “Nationality if born in a foreign country,” added in 1911 and so absent from preceding censuses, is of fundamental help in identifying migrants. The possible values for that column included “Naturalised British subject,” “British subject by parentage,” and foreign national (in which case the specific foreign nationality was indicated). When the column was left empty, it meant that the person was a British subject. Those who indicated that they were naturalized British subjects often had a note added in brackets with their original nationality, also deducible from the birthplace. Whether they were formally naturalized is difficult to determine (Tabili Reference Tabili2005), but this remains inconsequential for the purposes of this study.
“British subject by parentage” referred to those who were born abroad but kept a British nationality through their parents. This is significant because it makes this investigation more robust than a simple analysis by birthplace where the child of British parents born abroad could be mistaken for a foreigner when coming back to the United Kingdom.
More complications arise with the second-generation migrants: the offspring of those who moved to the United Kingdom. They possessed British subject status because the authorities had no interest in recording their ethnic and cultural background. The ius soli meant also that second-generation migrants were recorded as subjects of the nation in which their parents were living at the time of their birth. This created many instances of aberrant data. For example, second-generation Italians recorded as French nationals because their parents stopped briefly in France on their way to Scotland. For the purposes of this article second generation will be defined as people of migrant origin who grew up in the United Kingdom even if some of them will be born abroad during the first stage of their parents’ migratory movement.
The CEBs are structured around household units. Each household is separated from the next by a line, and all second and subsequent generations who still lived with their family of origin are listed in that household with the familial links reported through the variable “Relationship to the head of the family.” These households were “an administrative artefact.… The household in census terms was defined as those people present in a house on census night that a householder placed on his or her household schedule” (Higgs Reference Higgs2005: 71). The households included people such as lodgers, boarders, servants, and visitors. Families were not measured in the census. In this study households have the same definition as the census while family units comprise only people living in the same house and related by common ancestry, as reconstructed through the “Relationship to the head of the family.”
Some cases require a separate explanation. Firstly, the remarriage of the head of household complicates the reconstruction of the familial links because it is very hard to distinguish between the children of the first marriage and those of the subsequent marriage(s). In some instances, this is solved by the CEBs that label the children from a previous marriage of the wife of the head of household as “step-children.” It is, however, impossible to tell the exact biological relationship with the mother if it is the head of household who remarried. Luckily, other data from the 1911 census can help in this instance. When a married woman was present the census included some specific data with the intention of doing a fertility study (Garrett et al. Reference Garrett, Reid, Schürer and Szreter2001: 5–6). The data recorded included “Duration of marriage” and “Children still living.” By comparing the ages of the second generation with the duration of the marriage,Footnote 7 we can quickly determine if some of the children are from previous marriage(s). Comparing the number recorded under “Children still living” with the number of children present in the household gives us a second test and an increased certainty in this regard.Footnote 8 Moreover, while trying to assess the impact of migration beyond the original people who were born abroad, it is important to consider the transmission of culture that can be seen as more significant than the direct blood relationship. For the purposes of this study, all children of migrant households were assigned to the nationality of the migrant parent.
Secondly, children whose parents were from different ethnocultural backgrounds were assigned in full to the ethnicities of both parents (so they appear once under the father’s ethnicity and once under the mother’s), while being counted only once when tallying the total number of migrants. This methodology has been chosen to ease the analysis and to keep the results consistent with the census so the subsequent analytical tables are intended as tables of migrants who share a common background. Data on migrant intermarriages is available in table 4.
Lastly, there are the second-generation migrants who moved out of their parents’ houses. Differing behavior among the various migrant groups means that the age and status of those who are leaving their parents’ houses can differ substantially. Therefore, what follows will be an analysis of the numerical strength and composition of the households that still had one of the original migrants living there, so enjoying a direct connection with a foreign culture while, in the last part of the article, an attempt will be made to estimate those who moved out.
Apart from the families, the census officials enumerated all the visitors present in the household during the night, arguing that the totals would even out between the various localities.Footnote 9 In this research, to make the results comparable to the official numbers, the visitors were counted.
Familial links in the CEBs can be complex; households of more than ten people were not uncommon in 1911. In some instances, a migrant (re)married into another household therefore being listed as an “in-law,” be it son, daughter, brother, or sister, while members of the second generation are listed as grandchildren or nephews and nieces. Offspring from previous marriages are clearly indicated and easy to separate: The values used in the CEBs are “stepson,” “stepdaughter,” “step-grandson,” and “step-granddaughter.” More distant relationships, like “cousin,” and undefined ones, like “relative,” are also present. These by themselves do not give a clear indication of ethnicity and so had to be analyzed in conjunction with other indicators present in the CEBs, such as birthplace and the nationality of the other members of their family. Every such instance has been successfully resolved.
Households also included migrants as servants (the values used in the CEBs are “assistant,” “helper,” “housekeeper,” “lady help,” “maid servant,” “servitor,” and “shop assistant”) and lodgers and boarders (the values being “boarder,” “head boarder,” “daughter boarder,” “head lodger,” “husband boarder,” “lodger,” “son boarder,” and “wife boarder”). This provides an indication of how many of the general populace lived side by side with foreigners. Normally, there are no familial ties to reconstruct with the servants, but lodgers and boarders often came with their own family units residing within the household that provided them with work and shelter. In some instances, the CEBs provide the familial structure, but more often than not it had to be reconstructed using the surnames and the relative ages as a guideline.
Many migrants lived in workplaces and institutions. The overwhelming majority of those resident in workplaces were living in small family-run shops such as confectioners and fish restaurants, mostly managed by Italians, with a small number of assistants. As for institutions, the “Relationship with the head of the family” assumes a different meaning because that person now is the manager of the institution and the “relationship” is the role covered by that person, be it “inmate,” “official,” or even “nun.” Very large institutions were obliged to use a separate form, and, in such establishments, migrants were often separated from their families.
Although the term Polish Jews was used and reflected contemporary concerns about the number of Jews from Russian territories, for the most part census officials understandably used only the independent national states of the time. Thus, specific communities that left their mark on Scottish society, such as the Lithuanians, left no trace in the official census record (Holmes Reference Holmes1988: 29–30, 49–50; White Reference White1975). Conversely, there were several specific communities recorded that did not correspond to nation-states, yet the enumerator either ignored the instruction to confine nationality to sovereign state status or was ambivalent about such status. For example, Bavaria, the Grand Duchy of Finland, and Iceland, which had only limited de jure sovereignty, and others, such as Alsatia and Bretagne, which by 1911 had long since disappeared, were nonetheless recorded in the CEBs as though they were distinct countries. Notwithstanding the rhetoric of the time, this is also an indication of how the meaning of nationality among the migrant communities was still very much in flux. Whenever possible, these instances were standardized to the nearest modern equivalent, although in a limited number of cases—“Alsatian,” “African,” “Moor,” “West Indian Negro,” and “Mohamadian Indian”—this was not possible. Standardization of migrants from the far-flung Russian and Ottoman empires was kept to a minimum, given ambiguities associated with the terms Polish Jew, Assyrian, Syrian, Armenian, Ottoman, and Turkish. For example, in the returns some were recorded as “Turkish Ottoman,” some simply as “Turkish” and “Ottoman.” Moreover, the Jews quite often identified themselves as such, frequently in conjunction with the “official” nationality, for example “Polish Jew” and “Russian Jew.”
The Migrants in Edinburgh
The total population with a migrant background in Edinburgh, thus including second-generation and naturalized people, comprises 5,666 people—more than double the official number, which is 2,720. As a percentage of the total population, this means moving from 0.84 percent to 1.76 percent. The “naturalised British subject” numbered 348, many of whom were Germans.Footnote 10
To obtain this result, 320,318 census entries from Edinburgh, the entire population, were analyzed. This is roughly 7.5 percent of the total Scottish population. Of the total, 6,621 were entered in the database, representing all the migrants living in Edinburgh at the time as well as every person of Scottish origin who lived in their households (955 people in total, divided between spouses, in-laws, servants, lodgers, and boarders). This does not include big institutions such as hospitals and hospices where the migrants were transiently in contact with an even wider variety of people (Tabili Reference Tabili2011: 75).
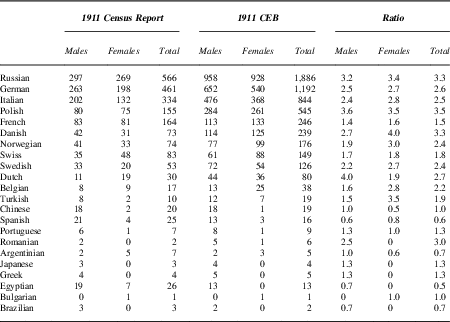
Table 3 gives a full comparison of the official totals from the census report and the much higher totals resulting from this study.Footnote 11 The people with a migrant background were on average more than double the totals from the census report, and in the case of the Russians, Polish, and Danish, it was more than thrice the commonly accepted estimates. This highlights the importance of second-generation family members and naturalized British subjects. Some communities, for example 250 people born in the United States, were not incorporated in the census report and so are absent from the comparative table. The average male-to-female ratio appears to be consistent with both the census report and the CEBs, with some exceptions in the smaller communities (on the gender ratio in mass migration, see Hatton and Williamson Reference Hatton and Williamson1994: 534).
Comparison of nationality data from the census report with data from the CEB

Sources: General Register Office (1911); “Census Enumerators' Books” (1911).
Note: The census report includes all foreign nationals. The CEB include all foreign nationals, naturalized British subjects born in a foreign country, and all their family members. Some of the smaller communities display totals numbers from this project that are less than those recorded in the official census report. This may be the result of the naval census, a lesser-known section of the British census, where, like their counterparts on land, a schedule was delivered to the captain to complete for all personnel and passengers on board. Curiously, the totals from ships in domestic waters were combined with those from the mainland registration districts corresponding to the ship’s position. Thus, all the passengers and crew aboard a ship in the port of Leith, including migrants, were not entered into the Leith enumerator books but were added to the Edinburgh totals, irrespective of their residential address or place of birth as noted in the census report (General Register Office (Scotland) 1913: xii): “That number includes a considerable population enumerated on board ships.”
The migrant groups in Edinburgh were highly heterogeneous, varying not only in size but also in internal composition. Their family composition, sex ratios, age, and marriage practices display high variance among them, clearly showing that these groups arrived at different times, arrived for different reasons, and integrated in different ways. The subsequent analysis will detail the profiles of the various migrant groups and show the overall trends.Footnote 12
Of fundamental importance for any discourse about integration and essential when addressing the composition of the various migrant groups are the intermarriages and the people with mixed ethnicities. As can be seen in table 4, among the large migrant groups the most integrated were the Germans, with the vast majority of the second generation being born in mixed households, while the Polish sit at the opposite end of the spectrum with a somewhat paltry amount for such a numerous community. Interesting to see is the variety of connections between the different groups, how often the Nordic people relate with each other, and how the Jews from Russia manage to connect with Jews from across Europe while those from Poland remain quite isolated. Another interesting aspect of their family composition is the extremely low number of migrants living outside family units. Except for the Germans and the French, another sign of their good level of integration, the “solitary” migrants in the other large groups are so minimal in number as to be virtually absent.
Average household and family size, number of people living away from family, number of people with parents from the same migrant group (nonmixed) and with diverse background (mixed), and number of mixed marriages

Source: “Census Enumerators' Books” (1911).
Note: Family size here is intended as total number of people related by a common ancestry living in the same household. Household size is the total number of people living in the same household. A specific migrant group household/family is identified as one containing at least one member of that migrant group. The table includes only the principal migrants groups.
Assessing the average household and family size of the various migrant groups in table 4, and comparing it to the Scottish data from the Scotland Census Report (1913), where the average size of a household was 4.7 for the whole of Scotland and 4.6 for Edinburgh, down from 5.05 in 1881, 4.92 in 1891, and 4.82 in 1901, we can see how, notwithstanding the classical view of all the migrants being demographically very active, only the Russian, Polish, and Italian households were on average more densely inhabited while the German and many others were more sparsely inhabited.
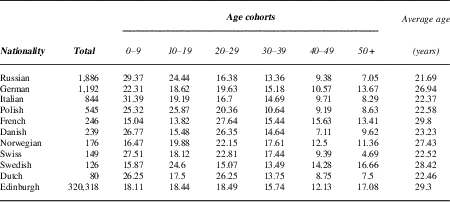
A comparison with the average age of the overall Scottish (26.9) and Edinburgh (29.3) populationFootnote 13 is possible, with revealing results.Footnote 14 Some migrant groups, again the Russians, Italians, and Polish, had a markedly different demographic outlook and weighted much more toward the younger age cohorts, while others, such as the Germans, were more in line with Scottish population patterns and exhibit an older population structure. A third type of migrant group, exemplified by the French, Norwegian, and Swedish communities, was radically different, showing an aging population and a very small younger cohort, only half as numerous compared to the Italian as shown in Table 5.
Age distribution of the migrants and of the population of Edinburgh

Source: “Census Enumerators' Books” (1911).
Note: This table includes only the principal migrant groups. Migrants here include foreign nationals, naturalized British subjects born in a foreign country, and their family members. The population of Edinburgh includes the migrants.
This is clearly another indication of the various migrant communities being at a different point in their development. The “new” groups are highly skewed toward a younger demographic footprint because the majority of the new generations did not have the time to establish new homes for themselves, while the “old,” more established ones are at least partially dispersed into the wider Scottish society.
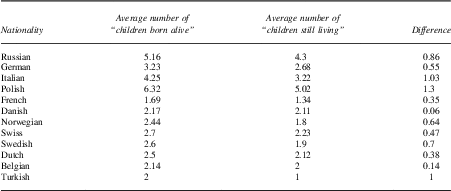
These results are confirmed in table 6 where the number of children is tabulated. This data comes from the number of children “born alive” and the corresponding number who were “still living” to surviving mothers, as recorded in the census study of the population’s fertility (for more on this, see Szreter Reference Tabili1993), which would eventually become the fundamental work for all research on the British demographic transition (Stevenson Reference Stevenson1923), and so does not cover the entire migrant population, but only the families where the mother was still alive and currently married. Adopted children, nephews, nieces, and grandchildren, all whom were an important part of migrant households, are also excluded, and so the average number of younger people and household size is understated as a result. Yet, this data by its very nature concentrates on the family units, giving an insight into what was arguably the nucleus of the settling immigrant population.
Average fertility of the mothers

Source: “Census Enumerators' Books” (1911).
Note: The table includes only the migrant groups with relevant data.
This data highlights how the demographic behavior varied among the migrant communities, which in this regard can again be divided into three groups. The first group, again composed of Italian, Russian, and Polish families, displayed an average number of children “born alive” higher than the Scottish average of 4.01 (General Register Office 1913), while the number of children “still living” is dramatically lower. The second group, whose most significant member was the German community, displayed an average number of children “born alive” lower than the corresponding Scottish value, but a relatively high number of children “still living” kept their family size still quite large. Other communities, like the French, constitute the third group, which displays an even lower average number of children.
One exception to this is the Danish community, with just one child death reported in the census. Further research is needed to confirm if this was due to different child-rearing practices, general social factors or the small sample size (for more on Danish mortality see Johansen Reference Johansen2002).
Due to the high infant mortality rate, very young children were often seen as transient and so went underreported. Wrigley and Schofield (Reference Wrigley and Schofield1989: 589–90) estimated for the 1871 census a ratio of 4.5 percent between the numbers reported in the census and the actual numbers, while Taylor (Reference Taylor1951: 718) estimated for 1911 that 6 percent of children under two years of age were not reported. Moving on to more general underreporting, Drake (Reference Drake1972: 21), referring to correspondence appearing in The Times, also noted the possibility of incorrect returns to avoid eviction proceedings for overcrowding. Others have suggested that some individuals, specifically refugees, pretended to be British subjects to avoid prosecution even though there was no such risk considering that census data was kept private (Higgs Reference Higgs1996: 87). Taken together these possibilities would only affect the totals by a very small percentage.
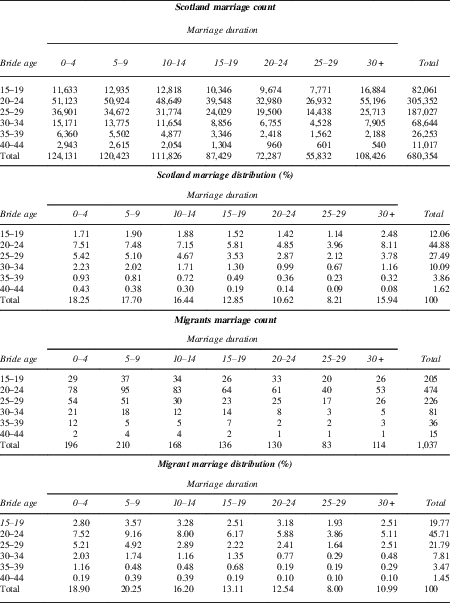
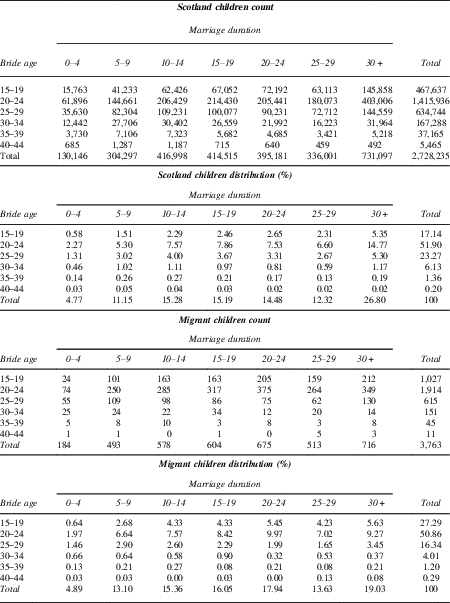
Cultural and economic factors play a significant role in the demographic behavior that we are observing. Marrying early does not only mean more time to have children, it also means a much higher fertility in those crucial years. All else being equal, the longer the marriage and the younger the bride, the higher the number of children. Thanks to the 1911 fertility census, we can compare the distribution of marriage and of children between the migrantsFootnote 15 and the general Scottish population (as shown in tables 7 and 8).


Interestingly, at least when considering the migrants in general, the differences in the distribution are very slight and probably connected to the selection effect from the migratory act. There are much lower percentages of very long marriages, because this is a population that settled only recently, and a lower age of the bride at marriage. This leads to a concentration of fertility on a specific profile, in particular when the age of the bride is between 15 and 19 (for more on the migrants’ cultural attitudes, see Gabaccia Reference Gabaccia2000).
The length of the marriage should also influence the child mortality data,Footnote 16 if only because there has been more time for it to happen, but surprisingly this is not always the case in these communities.
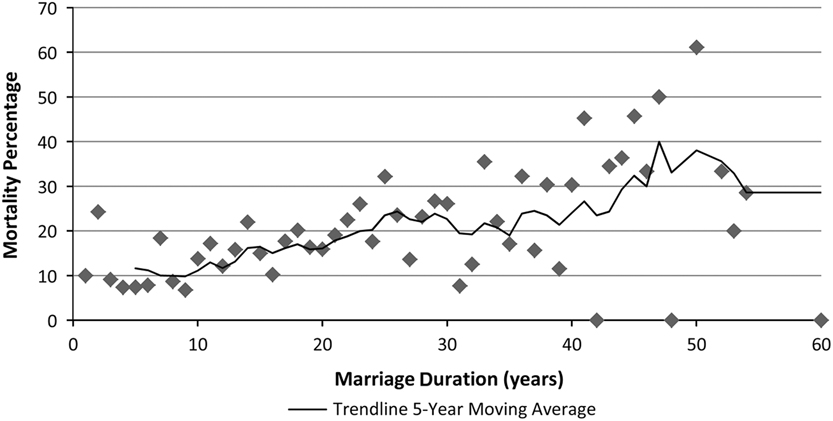
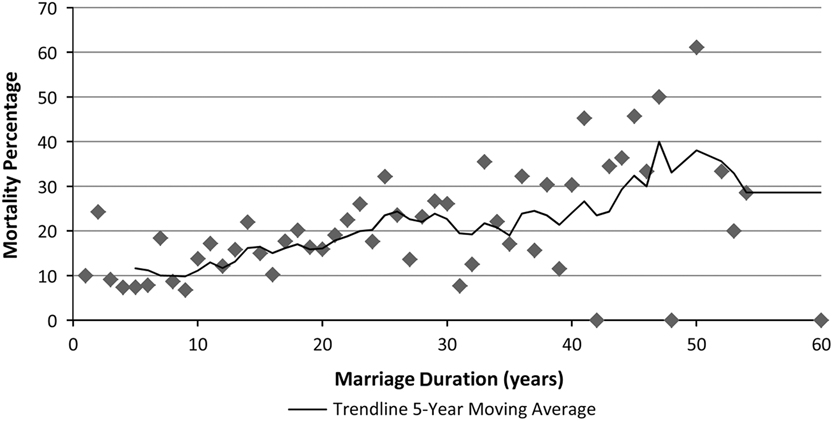
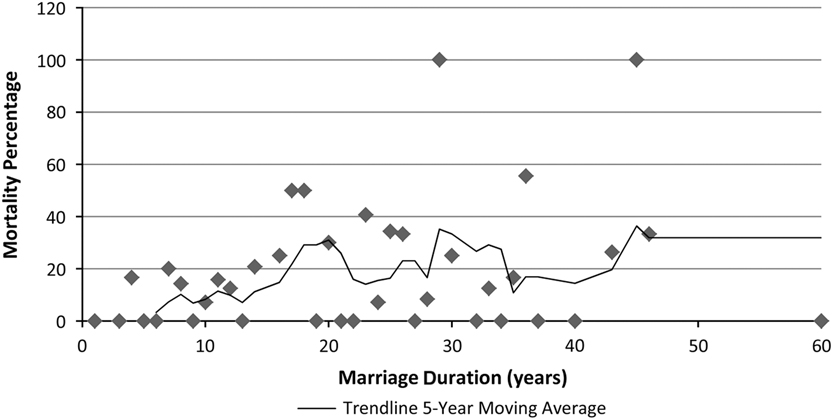
First, we examine the general migrant population in figure 1, where we can see how this trend holds true. Interestingly, the data indicates two boosts in child mortality, one around 25 years of marriage and another after the 40-year mark. This could be due to different migratory waves with different living standards.Footnote 17
Migrant’s children mortality by marriage duration. Note: In this and the other figures the mortality percentage is the difference between “number of children born alive” and “number of children still living” as a percentage of the “number of children born alive.”
When we move to test the most numerous individual migrant communities, we encounter different trends that relate to differing socioeconomic conditions and may be different cultural practices. It is important to specify that the subsequent graphs have been obtained by considering only the nationality of the mother.
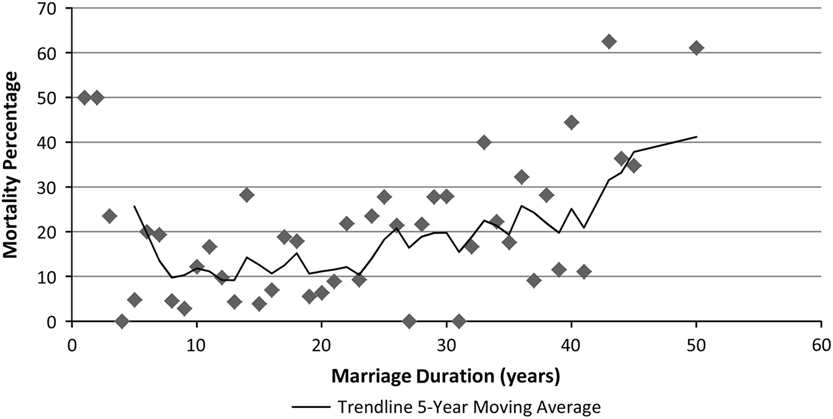
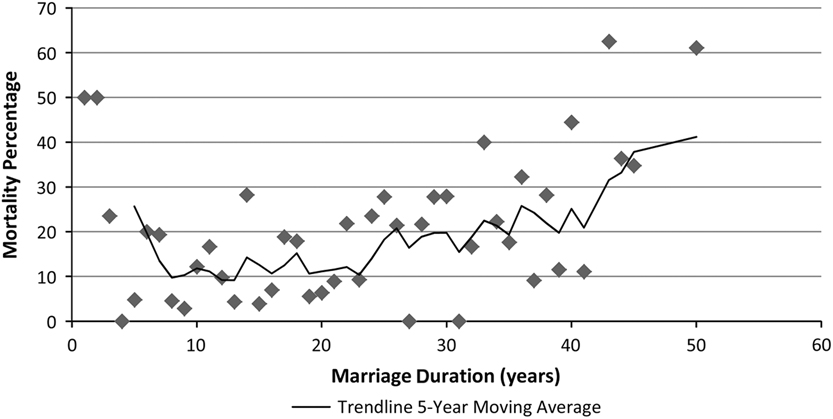
The Jewish migrants from the Russian Empire, the most numerous of the migrant groups, display an even stronger trend. While they retain the two “bumps” at around the 25- and 40-year mark, the main difference seems to be a “bump” at the beginning, where the length of the marriage is extremely short, probably related to the very difficult living conditions of the recently migrated cohorts (see figure 2).
Russian child mortality.
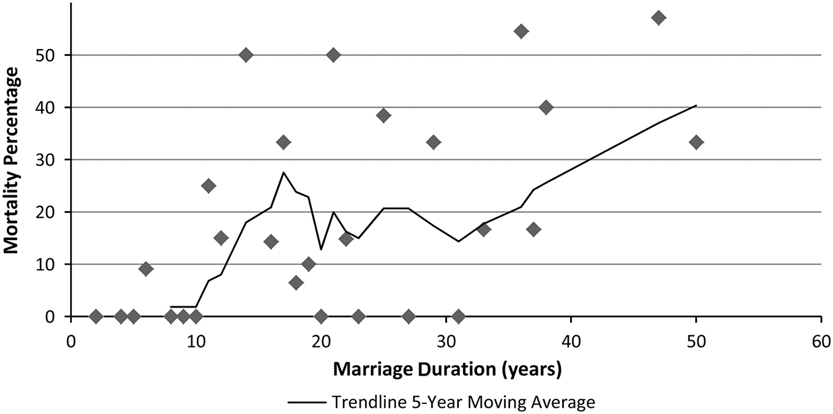
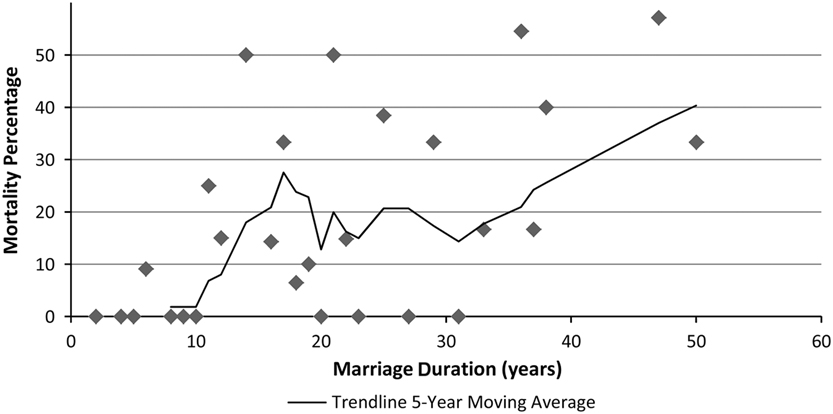
Interestingly, this does not hold true for the migrants who defined themselves directly as Jewish. As can be seen in figure 3, in their case the initial “bump” is completely missing, possibly implying an association between this kind of overt self-identification and better living standards.
Jewish children mortality.
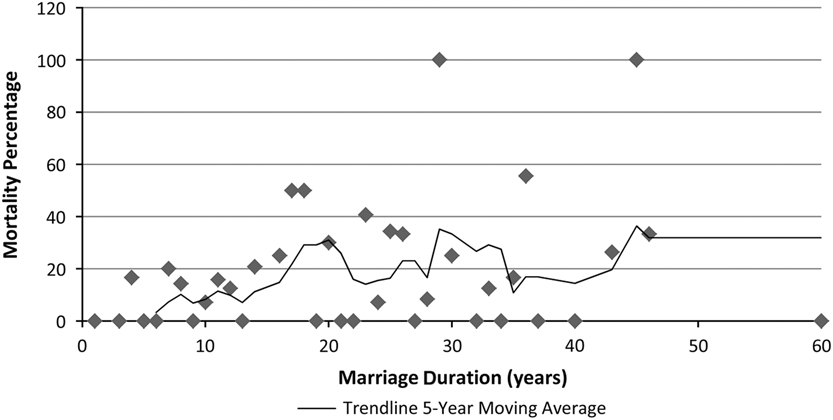
Moving on to the German migrants, we see a strikingly different story in figure 4. One where the mortality rises faster but then peters out at a lower level than the Russian and the general migrant population. The percentage of missing children even declines twice with marriage lengths in the 20s and the 30s. This is probably related to the excellent living conditions enjoyed by the German community in these years (for more on this, see Panayi Reference Panayi1995).
German children mortality.
Second Generation
The preceding analysis gives an accurate description of the migrant households but there are still some issues when considering the entire population. These are mainly connected with those second-generation migrants who left their parents’ households. Tracking these individuals down is a challenge. When a migrant moves out, the direct census connection with the original foreign national is lost. Moreover, in the case of the female second generation, these individuals generally acquire their husbands’ surnames through marriage, in effect severing even the nominal connection with the first generation. Moreover, geographical mobility within the United Kingdom, let alone further international migration, makes a large-scale record-linkage study very difficult. Therefore, a possible estimation technique is proposed: to use the birthplace of the second-generation migrants as a proxy for the movements of their parents and then reapply it to the second generation to estimate the number of them moving to Edinburgh.
Using this method will not give us precise numbers, but it could give us an idea of what those numbers could be. It gives us an awareness of the range of a phenomenon, the movement of second-generation migrants, up till now completely undefined in the relevant literature and hopefully provide a stepping stone for future more precise estimates. Moreover, it gives an insight into how the process of settling in town is a much complex and nuanced process.
The birthplace of second-generation migrants constitutes a good proxy for the movement of their parents, as it misses the short-term moves, but it clearly captures any long-term development. This is thanks to a combination between the high-fertility regime prevalent at the time (which meant children at regular intervals for married couples) and the practices of the census. (The CEBs distinguish between England and Wales on a nationwide level and detail the single parishes if the birthplace was in Scotland.) For example, in Edinburgh it is quite common to see families of migrants whose first children were born in the country of origin, the middle ones in another country or in another British town (a middle stage of their migratory movement), and only the youngest in Edinburgh. This means that from these birthplaces we can extrapolate an estimate of the mobility of a specific subset of migrant: those married with children.
To ensure that the family migration profiles that we are creating are as precise as possible, the base sample for this exercise has been created using only families where the number of children recorded under the special fertility census question, which is available only for 1911, corresponds to the number of children noted in the CEBs.
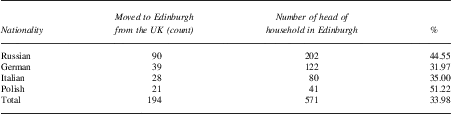
From this sample, the families with children born outside Edinburgh has been extracted, thus giving a total sample of 571 families (30 percent of the total migrant households) out of which 194 families migrated first to other parts of the United Kingdom before moving to Edinburgh. It is not possible to categorically exclude the possibility that the second-generation movement was influenced by some factor that is not possible to account for here (e.g., different patterns of leaving home and access to the job market through their established community), but the data suggests that time is the most significant factor.
Some interesting patterns emerge from table 9, which accounts for the total number of migrants and for the four most numerous groups. Approximately one migrant out of every three moved to Edinburgh only after a sojourn to another part of the United Kingdom. When focusing on the migrants from Eastern Europe, who were mainly Jews, their spatial mobility is even higher; almost half of them are two-stage migrants. This is significant. Instead of the classical view of the migrant moving and settling immediately as a relatively straightforward act, what can be observed is that the act of migration was often a very long and drawn-out process, sometimes taking literally years before the migrants put down roots in one place.
Foreign heads of households with children relocating to Edinburgh after first migrating to other areas of the United Kingdom as absolute numbers and as percent of the total number of heads of household with children from that nationality living in Edinburgh

Source: “Census Enumerators' Books” (1911).
Note: Only head of households whose number of children recorded in the census corresponds to what is recorded in the fertility question. This includes naturalized British subjects. The table includes details only on the four most numerous groups because the others are too limited in numbers to be significant.
Positing that the same forces that caused the movements of these first-generation migrants could also influence the rest of the migrant population, this gives an idea of the movements that were occurring at the time and of the amount of “hidden” migrants (second generation who left their parental households) present. If Edinburgh attracted a certain percentage of first-generation migrants from other UK towns (for every two migrants present in town from the start there is one who came from somewhere else), it stands as a clear possibility that a similar percentage of the second generation has been attracted to the town during the same period.
Although only an estimate and by no means authoritative, it doesn’t account for the second-generation migrants moving away from Edinburgh and it is all geared on estimating the impact of the latest cohort of migrants, it clearly suggests that these movements were not small.
Conclusion
The migrant community in Edinburgh was much bigger than was estimated by official reports. The city provides a large enough sample to make the results significant for the rest of the country. Even without considering the question of the mobility of the second-generation migrant, it is clear that the quantitative, and so also the qualitative, contribution that they made has been underestimated. Broadening the picture to Scotland and the rest of the United Kingdom, it is clear that the role played by the migrants needs to be more broadly reappraised.
Therefore, although the results of these observations on Edinburgh should not be applied tout court to the rest of the country (rural areas could attract migrants with a different social profile), the trends that are clearly visible should be at the forefront when considering the impact of migration on a more general level. This includes, above all, the high mobility between towns and the vibrant demographic profiles (for more on the effects of migration on population structure in England and Wales see Murphy Reference Murphy2016), and although the ratio between the various cities would be slightly different, a similar proportionate presence of migrants could be found in the largest British cities (Great Register Office 1915). Relying only on crude birthplace information derived from the UK census is bound to hide the richness of a much more complex situation, where the effects of the migratory movement do not stop with the act but instead reverberate through time and space. How much this echo keeps going should be the object of a broader discussion, clearly a migrant does not suddenly stop being a migrant merely with the passage of a certain number of generations or years, but slowly puts down roots in the new country in a long-run transformative process that sometimes never really ends, as with the Jewish migrants who never lost their distinctive identity. Migration leaves long-lasting memories of its passage as in Edinburgh where areas such as Grassmarket are still associated with the Italian migrants after all these years.
Another point that should be the focus of a broader discussion is the plethora of factors that influence the migrant settlement in the new country. Each migrant group displays quite distinctive behavior, probably due to its arriving in different periods, some married and some not, some already with children, all interacting with the job market and the wider society in a different way. All these factors related to their arrival must play a role in their long-run settlement.
The importance of immigration to Britain before World War I, although acknowledged in migration history, has been downplayed in mainstream history. There are many reasons for this, including the supposed lack of numerical strength. This has been taken to signify that the migrants could not have contributed to British society in a significant way and that their impact was at best modest. This idea was consolidated in the mind of the general public with the wave of migration from the ex-dependencies of the Commonwealth in the 1950s (Spencer Reference Spencer1997), seen as the first foreign presence in a pure British society (on the construction of the British identity and the concept of “heritage,” see Wright Reference Wright2009).
Where the experience of immigrants has generally been acknowledged, disproportionate attention has been directed to London, where there was the highest concentration of migrants in the country. What this article illustrates is that the indigenous population throughout the country had also experienced migrant communities. This is in part caused by “scholars’ bias towards studying visible migrant communities” (Tabili Reference Tabili2011: 54) and contemporary attitudes (Wilson Reference Wilson1965: xiv). Moreover, much of the writing is framed by conflictual relations between migrant and indigenous communities, whereas this research shows how the presence of non-British elements in local society, and therefore the interactions, were more numerous and diverse than previously acknowledged. The media paid greater attention to news of friction because, apart from the fact that it is considered more “interesting” than news of peaceful cohabitation, in an age of unionized workers the migrants were often perceived as a factor driving down the living standards of their fellow general laborers (see, e.g., Lunn Reference Lunn1980).
All these factors often lead contemporary understanding of historical migration to a self-affirming bias. Reading about the migrants only when there is conflict, the absence of friction leads to the impression that their number must have been insignificant and their contribution to society inconsequential while, although these conflicts certainly existed, “the history of immigrant groups is more complex than simply the negative reactions of British society towards them” (Panayi Reference Panayi1994: 2). Instead, what this study is showing is great mobility, significant intermarriages (with a growing population with mixed parents), and high fertility. Moreover, by examining all the migrants in the town, instead of focusing on a single migrant strand, significant differences between the various migrant groups start to emerge, differences that make sense only within the broader context of the general migration and within the local population. All this leads to the fact that instead of the footnote to which they are normally delegated, their impact on the evolution of UK towns must be running much deeper and must be considerably more complex.