INTRODUCTION
Bambara groundnut (Vigna subterranea), also known as ‘Nyimo Bean’ in Zimbabwe and ‘Jugo Bean’ in South Africa, is the third most important legume in sub-Saharan Africa after cowpea (Vigna unguiculata) and groundnut (Arachis hypogaea) (Linnemann and Azam-Ali, Reference Linnemann, Azam-Ali and Williams1993). Its centre of origin is thought to be Bambara, near Timbuktu in Central Mali, West Africa (hence its name). It is popular as a snack or food supplement but not as a lucrative cash crop. It is traditionally grown by women for the subsistence of their families, attracting less value and less priority in the allocation of land than cash crops such as groundnut. Seeds are rarely purchased, and women are responsible for passing them down through the generations, saving seed yearly and putting dried seeds away. The crop is cultivated from local landraces and there are no true varieties of the species bred for specific traits. Bambara groundnut is a relatively adaptable plant and tolerates harsh conditions being suited to hot, dry regions compared to other pulses in the region.
The unpredictable and variable climates, especially with erratic distribution of annual rainfall in sub-Saharan Africa, routinely causes severe yield losses in most crops including bambara groundnut. The undoubted importance of water conditions for crop growth and development has been identified on many occasions for major crops but evidence for underutilized crops such as bambara groundnut is fragmentary and often anecdotal. Therefore to explore the potential growth and development of bambara groundnut in various agro-ecological regions under variable rainfall patterns it is vital to quantify the effect of environmental factors through suitable modelling approaches (Karunaratne et al., Reference Karunaratne, Azam-Ali, Al-Shareef, Sesay, Jørgensen and Crout2010). The PARCH (Predicting Arable Resource Capture in Hostile Environment) (Bradley and Crout, Reference Bradley and Crout1993) model initiated the concept of modelling bambara groundnut and developed towards the most recent dynamic crop model, BAMGRO (Karunaratne, Reference Karunaratne2009; Karunaratne et al., Reference Karunaratne, Azam-Ali, Al-Shareef, Sesay, Jørgensen and Crout2010) that focuses on major abiotic stress factors. However, the limited nature of information from experimental sites across sub-Saharan Africa where bambara groundnut is traditionally grown signifies the importance of a simple model with minimum parameters. In many areas of the natural sciences, of which crop modelling is typical, the use of mechanistic or process-based models is ubiquitous. Generally, such models attempt to represent the details of the processes at work within a system, encoding a wide range of discipline-specific understanding. A feature of this type of model is that they generally have a large number of components which are inter-dependent, complex and problem-specific. While mechanistic models tend to be detailed, they are less detailed than the real systems they seek to describe, so judgements are being made about the appropriate level of detail within the process of model development. These judgements are difficult to test. Consequently it is easy for models to become over-parameterized, potentially increasing uncertainty in predictions (Crout et al., Reference Crout, Tarsitano and Wood2009). The FAO AquaCrop model maintains a balance between robustness and output accuracy as a generic crop water productivity (WP) model and can be applied to a wide range of crops with minimum input parameters (Steduto et al., Reference Steduto, Hsiao, Raes and Fereres2009; Raes et al., Reference Raes, Steduto, Hsiao and Fereres2009).
This paper presents the calibration procedure and validation results of the AquaCrop model simulations using four bambara groundnut landraces originating in three zones in semi-arid Africa (Uniswa Red-Swaziland, S19–3-Namibia, DipC and OM1-Botswana) for (1) canopy cover development (CC), (2) biomass (B) and (3) pod yield (Y) in glasshouses and in fields under different temperature regimes and moisture limited and non-limited situations.
MATERIALS AND METHODS
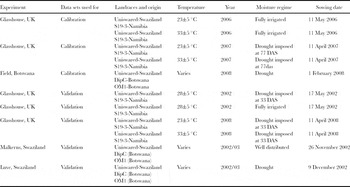
Simulations were performed with the AquaCrop model as described by Steduto et al. (Reference Steduto, Hsiao, Raes and Fereres2009) and Raes et al. (Reference Raes, Steduto, Hsiao and Fereres2009). To calibrate and validate AquaCrop, glasshouse experiments in Nottingham, UK, and field experiments in Swaziland and Botswana were conducted (Table 1). The details of experimental design, plant sampling procedures, irrigation treatments and standard measurements have been previously explained in Karunaratne et al. (Reference Karunaratne, Azam-Ali, Al-Shareef, Sesay, Jørgensen and Crout2010), so only outline details are presented here.
Summary of experiments used for model data sets in AquaCrop calibration and validation.

Study site descriptions and experimental procedures
Nottingham glasshouse experiments. Five glasshouses of the Tropical Crops Research Unit (TCRU) at the University of Nottingham, School of Biosciences, Sutton Bonington Campus, UK (52°50′N, 1°15′W; 45 m asl) were used to grow two contrasting bambara groundnut landraces (Uniswa Red, from Swaziland, and S19–3, from Namibia) during the summer months of 2002, 2006, 2007 and 2008 (April to September). The treatments consisted of irrigated and drought (33 days after sowing (DAS)) while all the glasshouses maintained the temperature of 28 ± 5° during 2002. In the other years (2006–2008), two temperatures; 23 ± 5 °C (LT) and 33 ± 5 °C (HT) were imposed in the five glasshouses. Soil moisture in each house was non-limiting in 2006 (total irrigation 381 mm for LT and 437 for HT) for the main calibration experiment for non-moisture limited condition. The irrigation was stopped at 77 DAS (total irrigation 260 mm for LT and 305 mm for HT) and 33 DAS (total irrigation 107 mm for LT and 160 mm for HT) in 2007 and 2008 respectively. TCRU 2007 was used as the main calibration experiments for drought while AquaCrop was validated against the 2008 experiment (Table 1). The average solar radiation varied from 9 to 12 MJ d−1 within the glasshouses. Gravelly/stony sand subsoil was overlaid by 0.3 m of sandy loam soil. The soil pH was monitored at the beginning of each season and remained at a mean of 6.7 ± 0.2 (Karunaratne et al., Reference Karunaratne, Azam-Ali, Al-Shareef, Sesay, Jørgensen and Crout2010).
Botswana field experiments. The experiments were carried out at the University Farm, Botswana College of Agriculture, Notwane, Botswana (240°33′S, 250°54′E, 994 m asl). The climate is semi-arid with an average annual rainfall (30-year mean) of 538 mm. Most rain falls in summer, which generally starts in late October and continues to March/April. Prolonged dry spells during the rainy season are common. Severe drought is experienced during the winter months starting from June and extents up to September with average rainfall less than 10 mm. The evaporation measured at the grass-covered area at the experimental site from October to February ranges between 200 and 249 mm and fluctuates around 100 mm in winter. The average minimum and maximum temperatures in Notwane, Botswana, are 12 °C and 29 °C respectively. However the winter usually experiences temperatures below 5 °C at night. The average solar radiation in the experimental site varies between 22 and 26 MJ d−1 while the day length ranges from 10 h to 13 h during January to April. The soils are shallow, ferruginous tropical soils, mainly consisting of medium to coarse grain sands and sandy loams with a low water-holding capacity and subject to crusting after heavy rains. They are deficient in phosphorus, have low levels of mineral nitrogen and low organic matter content.
The field experiments were performed for set of landraces (Uniswa Red, DipC and OM1) at three sowing dates (December 21, January 18 and February 1 in the 2006/2007 growing season), when a range of environmental conditions was considered. The experiment was replicated four times in a single split plot with three sowing dates in main plots and the landraces in sub plots.
Swaziland field experiments. A set of Swaziland (Uniswa Red, Nayakeni C1, Nyakeni C2) and Botswana (DipC, GabC, OM1) landraces were grown in field sites in Swaziland (Malkerns: 26°30′S; 31°13′E, 700 m asl and 850–1000 mm average rainfall; Luve; 26°20′S, 31°14′E, 580 m asl and 700–850 mm average rainfall) from December 2002 to May 2003 (Cornelissen, Reference Cornelissen2005). On average the experimental sites reported a daylength variation from 10 h to 13 h. During the experimental period Malkerns reported well-distributed rainfall, thus suggesting no drought stress for the crop during the cropping season whereas at the Luve field site the crop experienced severe drought stress.
The experiments at each field site comprised four replicate blocks of nine plots (landraces) giving a total of 36 plots. Each individual plot was 6 × 6 m, i.e. 36 m2. The inter- and intra-row spacing was 50 cm and 30 cm, respectively, giving a plant population of 7 plants m−2 (252 plants per plot). Two seeds were sown per hill and half intra-row spacing at a depth of 5 cm, and thinned down to one per hill and appropriate spacing 21 days after sowing.
Measurements
Nottingham glasshouse experiments. Daily weather data (minimum and maximum air temperature, solar radiation, relative humidity, saturation deficit) were recorded within each glasshouse. Solar radiation readings were recorded every 30 s on a data logger (Campbell Scientific CR 10) and averaged for every hour. Daily ET0 was estimated using FAO-ET0 calculator. Sequential growth analyses of ten randomly selected plants from each plot were done at regular two weeks intervals from sowing to harvesting. For each treatment, the fresh and oven-dry weights of the above-ground B and oven-dry Y were determined. Along with the growth analysis the total leaf area of individual plants was recorded using leaf area meter-model LI-3100 (LI-COR, inc. Lincoln, Nebraska, USA) that enable the calculation of leaf area index (LAI); the conversion from LAI to CC, the parameter used in AquaCrop, was done using Eq. (1) as explained in Garcia-Vila et al., (Reference Garcia-Vila, Fereres, Mateos, Orgaz and Steduto2009).
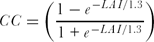
Eq. (1) was derived from a general relationship between intercepted solar radiation at midday and LAI, using a value for the extinction coefficient of 0.60 as reported in Karunaratne (Reference Karunaratne2009).
Phenological development was recorded in randomly selected tagged plants as details in Karunaratne et al. (Reference Karunaratne, Azam-Ali, Al-Shareef, Sesay, Jørgensen and Crout2010).
During the TCRU experiments in the 2007 and 2008 growing seasons, soil moisture content in the soil profile was monitored in all plots using a PR2 probe (Delta-T Devices, UK), which estimates the soil moisture at 10, 20, 30, 40, 60 and 100 cm. Each plot has four access tubes, and the average reading for the tubes represent the mean amount of water in the soil for each plot. Soil physical characteristics (soil depth, soil texture, bulk density, soil water capacity at saturation, field capacity, permanent wilting point) had been previously determined for the TCRU glasshouses (Mwale, Reference Mwale2005).
Botswana and Swaziland field experiments. Daily weather data that consisted of minimum and maximum temperatures, rainfall, sunshine hours, wind speed and relative humidity were obtained from the nearest meteorological station for each individual experimental site. As described in Karunaratne et al. (Reference Karunaratne, Azam-Ali, Al-Shareef, Sesay, Jørgensen and Crout2010), in both Botswana and Swaziland field trials, leaf area measurements were estimated from leaf length and width (Cornelissen et al., Reference Cornelissen, Deaswarte and Azam-Ali2002) measurements taken at regular two weeks intervals during the growing period. Sequential growth analysis recorded the total B and Y together with leaf area. Biomass samples were collected at two-weekly intervals throughout the growing season to assess the changes in B. There are records for the soil physical characteristics for the sites in Botswana and Swaziland. Neutron probe (Type 3, Didcot Instrument, UK) was used to determine the soil moisture content in the profile up to 100 cm depth of Botswana field experiments (2008).
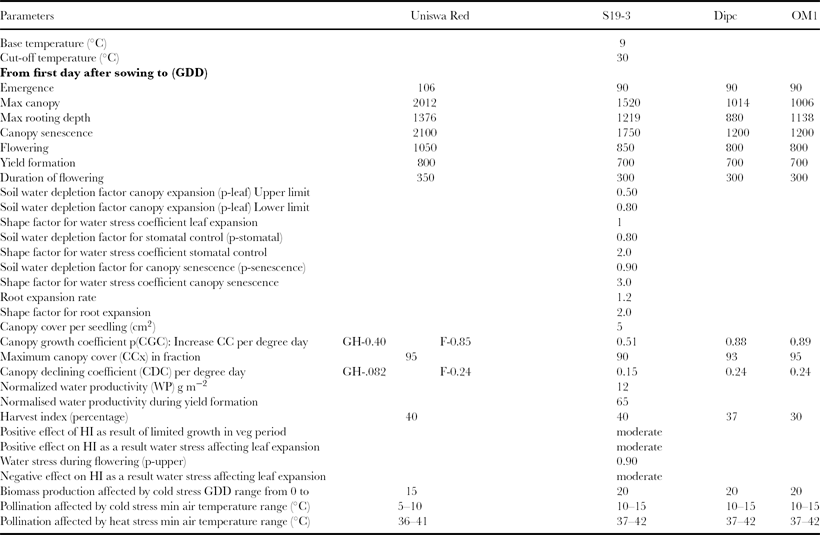
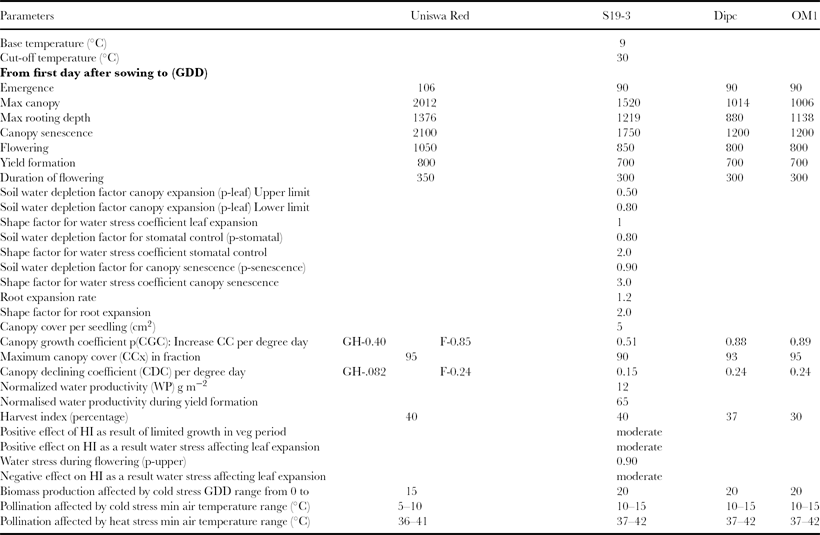
The phenology of the crop was monitored throughout both in glasshouse and field experiments as: the timing and duration of flowering, yield formation, the time to senescence and the time to harvest. The time to germination was observed in the range of 90–106 growing degree days (GDD) based on the landrace (Table 2). In general slower growth and development were found for the Swaziland landrace Uniswa Red than S19–3 (Namibia), DipC and OM1 (Botswana).
Preliminary results for bambara groundnut calibration.
AQUACROP MODEL
The calculation steps and the model equations of AquaCrop used in this study have been described by Steduto et al. (Reference Steduto, Hsiao, Raes and Fereres2009) and Raes et al. (Reference Raes, Steduto, Hsiao and Fereres2009). However, summarized information on the AquaCrop model is presented. AquaCrop is a water-driven model for yield estimation of several herbaceous crops, and is particularly suited to address conditions where water is a key limiting factor in crop production. The crop growth is simulated by developing a green canopy cover (CC) that transpires water, taken up through the deepening root system. The transpired water is in exchange for biomass produced (via the assimilation of carbon dioxide, not directly simulated). Accumulation of user-defined growing degree days/calendar days simulates a particular pheneological stage (i.e. pod filling in bambara groundnut) and a part of the biomass (B) is partitioned to the yield (Y) component as determined by the user-defined harvest index (HI). Throughout the crop cycle the amount of water stored in the root zone is simulated as the balance between incoming (rainfall and irrigation) and outgoing (runoff ET and deep percolation) water fluxes. Water stress coefficients (Ks) are dependent on the root zone depletion and affect: (1) CC expansion, (2) stomatal conductance and hence transpiration per unit CC, (3) canopy senescence and decline and (4) the HI. Each of the above stress coefficients has its own threshold depletions and response curves. Further, the root system deepening rate is a function of Ks for stomatal conductance. When the crop experiences water stress, the simulated CC will be less than the potential canopy cover (CCpot). The coefficient for transpiration (Kctr) is proportional to CC, and hence continuously adjusted throughout the simulation. The main features includes (1) separation of evapotranspiration (ET) in to crop transpiration (Tr) and soil evaporation (E), (2) simple canopy growth and senescence model as the basis for the estimate of Tr and its separation from E, (3) final Y as the product of final B and HI and (4) segregation of water stress into four components: canopy growth, canopy senescence, Tr and HI. As in other crop models, AquaCrop consists of a soil-crop-atmosphere continuum with (1) the soil- water balance, (2) the crop growth, development and yield and (3) the atmosphere – thermal regime, rainfall, evaporative demand and carbon dioxide concentration.
The environment of the crop is specified in the climate component in AquaCrop (Steduto et al., Reference Steduto, Hsiao, Raes and Fereres2009) with five daily weather input variables: maximum and minimum temperatures, rainfall, reference evaporation (ET0) and the mean annual CO2 in the atmosphere. Biomass of the crop is simulated through cumulative transpiration and WP (Eq. 2). The conceptual equation at the core of the AquaCrop growth engine is Eq. (2).

where, WP is the water productivity (biomass per cumulative transpiration); Tr, crop transpiration and B, total biomass (t ha−1).
The model is based on the conservative behaviour of WP (Steduto et al. Reference Steduto, Hsiao and Fereres2007), that is the constancy to the relationship between biomass production and transpiration. The normalization of WP for climate (atmospheric evaporative demand, ETo and concentration of CO2) makes AquaCrop applicable to diverse location and seasons, including future climate scenarios.
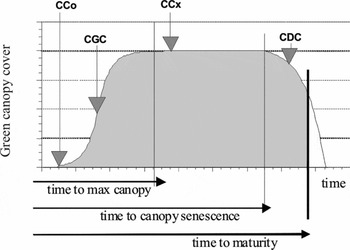
AquaCrop describes crop foliage development in terms of CC (Figure 1) and not via LAI. The canopy is a crucial feature of AquaCrop that determines the amount of water transpired, which in turn determines the amount of biomass produced through expansion, aging, conductance and senescence. This distinctive feature introduces a significant simplification in the simulation, allowing the user to enter actual values of CC even estimated by eye.
Green canopy cover development described by four parameters: initial canopy cover at the time of crop emergence (CCo), canopy growth coefficient (CGC), expected maximum canopy cover (CCx), canopy decline coefficient (CDC).

Further, CC can be easily obtained from remote sensing sources when facilities are available either to check the simulated CC or as input for AquaCrop. Under non-stressed condition, the canopy development of the first half of the growth curve is simulated by an exponential growth equation decribing the growth of canopy, being dependent on the existing canopy size for photosynthesis, and follows first order kinetics (or has a constant relative growth rate) (Steduto et al., Reference Steduto, Hsiao, Raes and Fereres2009). For the second half of the CC curve, when the plants begin to shade each other, canopy growth is no longer proportional to existing canopy size. Hence, for the second half, CC follows an exponential decay. As the crop approaches maturity, CC enters a declining phase. The overall canopy development functions are given in Eq. (3).
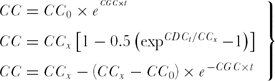
where CC is the canopy cover at time t and is expressed in fraction of ground covered, CC0 is initial canopy size (at t = 0) in fraction, CGC is canopy growth coefficient in fraction per GDD or per day, a constant for a crop under optimal conditions but modulated by stresses and CDC is canopy decline coefficient (in fraction reduction per GDD or per day) The CC0 is proportional to plant density and the mean initial canopy size per seedling (CC0), and this feature is used by the model to account for variations in plant density.
The crop phenology is simulated through calendar time or thermal time (GDD), over five developmental stages: emergence, start of flowering, maximum rooting depth, start of canopy senescence and physiological maturity.
AquaCrop does not calculate the partitioning of biomass to various organs, but simply adopts HI to simulate the portion of above-ground biomass stored into the grains (yield). This choice avoids dealing with the complexity and uncertainties associated with the partitioning processes. Once dry above-ground biomass is simulated by Eq. (2), Y is calculated by Eq. (4) from onset of yield formation with user-defined HI value.

Water stress has several effects based on timing, severity and duration. AquaCrop specifies four stress effects: on leaf growth, stomatal conductance, canopy senescence and HI. With the exception of HI, these effects are manifested through individual stress coefficients (Ks) that varies from one (no stress) to zero (the stress effect is maximum), and are a function of water content in the root zone. Temperature plays a role in influencing crop development, when the GDD mode is chosen. Biomass production is hampered when the air temperature is too cool, through a temperature stress coefficient (Ks). In addition, cold or heat stress at flowering induces a reduction in HI.
CALIBRATION OF AQUACROP FOR BAMBARA GROUNDNUT
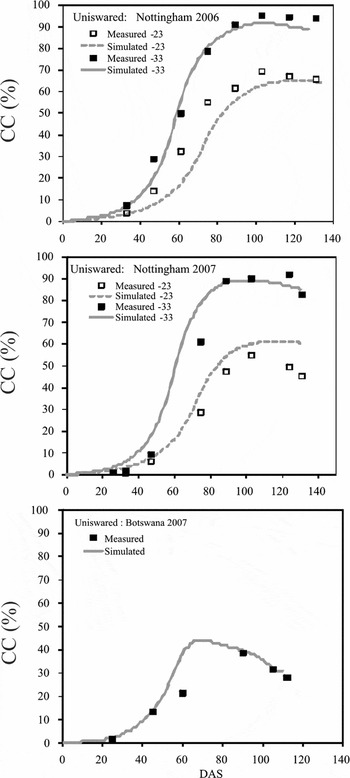
Bambara groundnut crop parameters for AquaCrop were derived using glasshouse (TCRU-2006, TCRU-2007) and field experiments (Botswana). The experiments represented a wide range of water regimes and environmental conditions (Table 1). A calibration procedure for bambara groundnut was initiated with the TCRU-2006 experiment (no water stress) and proceed with late drought (TCRU-2007) and rain-fed conditions in the field sites in Botswana. The calibration procedure consisted first in the matching of observed and simulated CC (Figure 2). Secondly, the calibrations were based on comparisons between observed and simulated B and Y. The crop development of bambara groundnut was modelled in AquaCrop on GDDs because Nottingham, TCRU glasshouse experiments were conducted with two temperature regimes (LT, HT). Also calendar days are not a good assessment of phenology of a crop, as explained by Azam-Ali and Squire (Reference Azam-Ali and Squire2002), as water stress has an effect via GDD on flowering and physiological maturity. Goodness of fit of the simulation results of the calibration and validation were assessed on the basis of the R 2 and root mean square error (RMSE) as described in Heng et al. (Reference Heng, Hsiao, Evett, Howell and Steduto2009).
Calibration results of canopy cover (CC) with days after sowing (DAS) under glasshouse conditions (TCRU-2006, irrigated; TCRU-2007, LT- 23 ± 5 °C and HT-33 ± 5 °C with drought at 77 DAS) and field sites in Botswana (2007/2008 growing season); Measured data are the average of 20 (LT), 30 (HT) and 10 (Botswana) plants per landrace.

Canopy development
The logistic growth curve of the canopy development used in AquaCrop was well suited to bambara groundnut (Karunaratne et al., Reference Karunaratne, Azam-Ali, Al-Shareef, Sesay, Jørgensen and Crout2010) both in controlled environment and field conditions. The initial canopy cover (CC0) was directly calculated from the planting density. The time to maximum canopy cover (CCx) and its value, as well as time to senescence, were derived from the LAI measurements for the fully irrigated and droughted bambara groundnut under glasshouse conditions in Nottingham, UK and in the field in Botswana, and fine-tuned during the calibration process.
Water regimes
Moderate water stress on canopy development was considered by setting the soil water depletion factor on canopy expansion (pexp) at an upper limit of 0.5 and lower limit of 0.8 of total available soil water (TAW) (Table 2). The soil moisture depletion at stomatal closure (pstom) was set at 0.80 of TAW. The settings of pstom are in accordance with evidence in Collinson et al. (Reference Collinson, Azam-Ali, Chavula and Hodson1996) that explains the drought tolerant capabilities of bambara groundnut through stomatal regulation. Early canopy senescence (psen) was set at 0.90 of TAW because early canopy senescence was not observed in any experiment. Between the thresholds, the shape factor of Ks curve determines the intensity of stress on canopy development. In order to obtain the highest match between observed and simulated CC, the canopy expansion was set to decrease linearly within the limits of 0.5 and 0.8 of pexp, whereas stomatal control was set according to a convex curve (shape factor 2) in order to maximize the match of B values. The extreme tolerance of water stress on early canopy senescence of bambara groundnut adjusted the programme settings for the variation of Ks according to a concave shape (shape factor 3) (Table 2).
As observed by Mwale et al. (Reference Mwale, Azam-Ali and Massawe2007a), the HI of bambara groundnut shows a linear increase after an initial lag phase and reaches a final value of 30–40% (varying with the landrace) close to maturity. The decrease in HI due to water stress is a common physiological process. The drought tolerance mechanisms in bambara groundnut allowed the settings to moderate water stress on HI. There was a moderately positive effect of water stress on HI as a result of limited growth in the vegetative period and leaf expansion that was observed in drought experiments. Therefore the upper limit of water stress during flowering was set at 0.90.
The upper threshold level of temperature for yield determination is set at 36 °C for Swaziland landrace (Uniswa Red) and 37 °C for other Namibian (S19–3) and Botswana (DipC, OM1) landraces. Although the difference is 1 °C only, it makes a significant difference in terms of biomass, and thus to pod yield. Over the three years (2006, 2007 and 2008), experiments at TCRU, Uniswa Red showed a significantly lower yield at high temperature than S19–3. So it can be concluded that yield formation of Uniswa Red is more sensitive to heat stress than the Namibian landrace, S19–3. The present calibration resulted in this small difference of 1 °C perhaps due to the constant shape factor in heat stress on HI.
Crop production
The default settings in AquaCrop are suited to bambara groundnut thus HI increased from zero at flowering to maximum at maturity. Water productivity normalized for ET0 and CO2 concentration (WP*) of 12 g m−2 was obtained from the glasshouse experiments (data not shown) and was used in all the simulations (Table 2). This resulted in reasonable simulations of B and Y under rainfed and irrigated conditions.
MODEL VALIDATION
Canopy cover
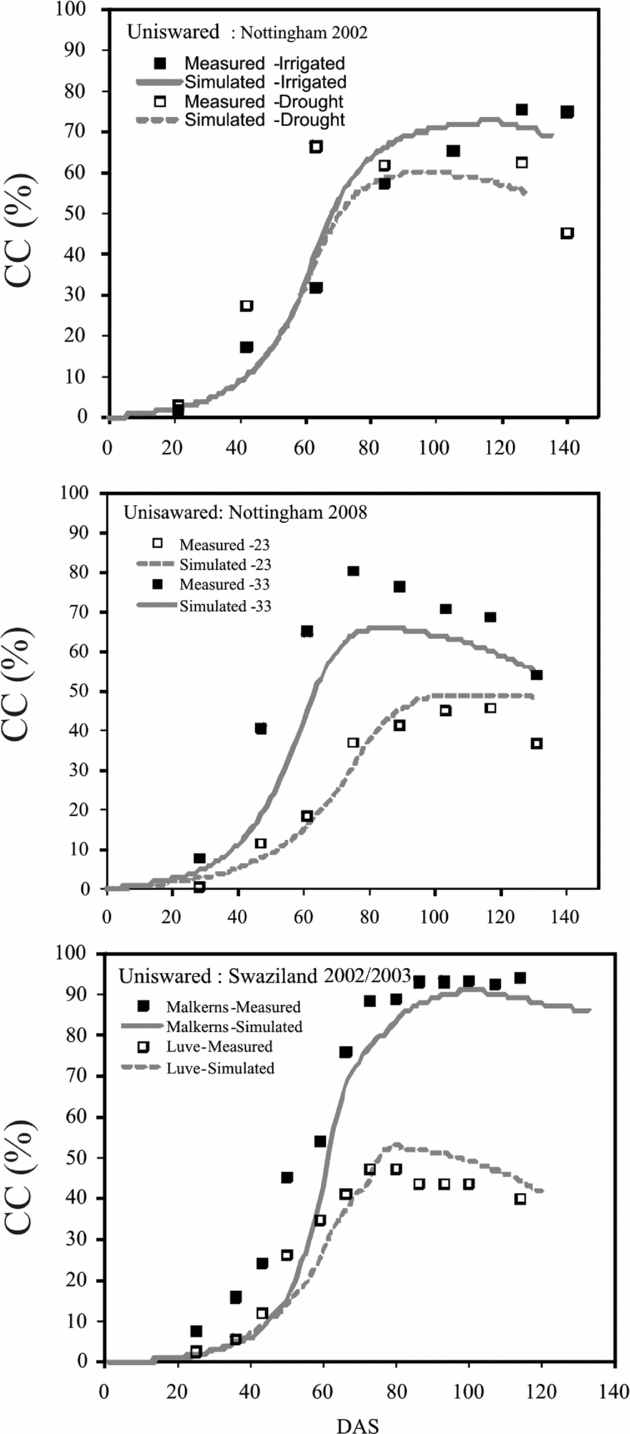
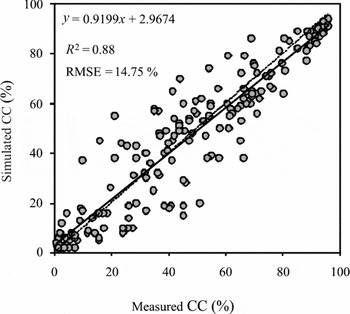
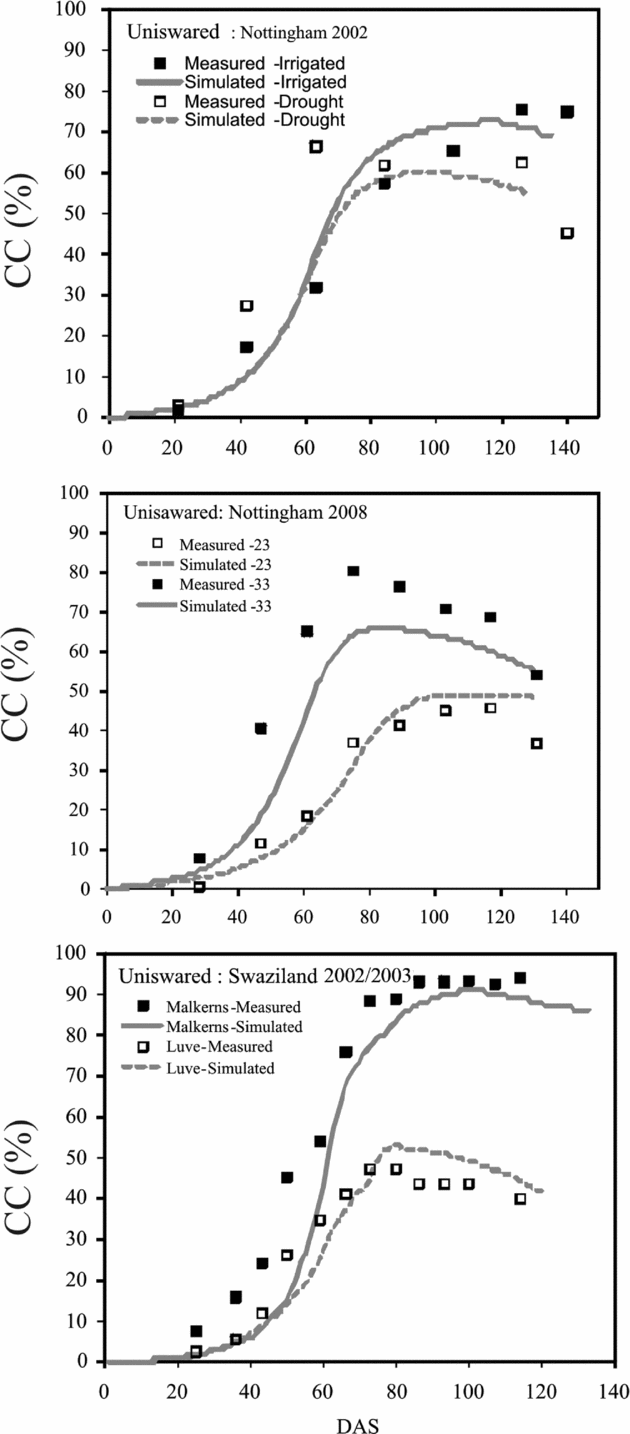
Validations were performed considering the calibrated crop parameters and local planting densities of two glasshouse years (TCRU-2002, TCRU-2008) and fields in Swaziland. The model simulation results for CC under glasshouse conditions, (TCRU-2002, irrigated and droughted; TCRU-2008, drought imposed at 33 DAS with LT and HT) and field sites in Swaziland (2002/2003 growing season; Malkerns, no water stress and Luve, with drought stress) for Uniswa Red are shown in Figure 3. AquaCrop simulations for CC followed the same trend (data not shown) for other tested landraces (S19–3, DipC, OM1) when the input parameters changed as in Table 2. AquaCrop CC simulations for both field grown and glasshouse crop in UK reported an excellent fit to the observed data (Figure 3). The cumulative results for the tested landraces (Uniswa Red, S19–3, DipC and OM1) reported that the linear regression of simulated v. measured CC shows a very small overestimate at the early stage and an underestimate towards the end of the growth cycle (Figure 4). However, the slope of the regression line (0.91) and the intercept (2.97) are not significantly different to the slope (1.0) and the intercept (0) of 1:1 line. The CC formation is explained successfully by AquaCrop indicating high R 2 (0.88). The RMSE (14.75%) was acceptable, considering the degree of error in the data in both field and glasshouse experiments, due to the differences in solar radiation intensities and intralandrace variability.
Validation of canopy cover (CC) with days after sowing (DAS) under glasshouse conditions (TCRU-2002, 28 ± 5 °C irrigated and drought at 33 DAS; TCRU-2008, LT- 23 ± 5 °C and HT-33 ± 5 °C with drought at 33 DAS) and field sites in Swaziland (2002/2003 growing season; Malkerns, no water stress and Luve, with drought stress). Measured data are the average of 20 (LT), 30 (HT) and 10 (Swaziland) plants per landrace.
Comparison between measured and simulated canopy cover for four landraces in glasshouse experiments, Nottingham, UK and field sites in Swaziland 1:1 line (·····) and regression line (–).

Biomass
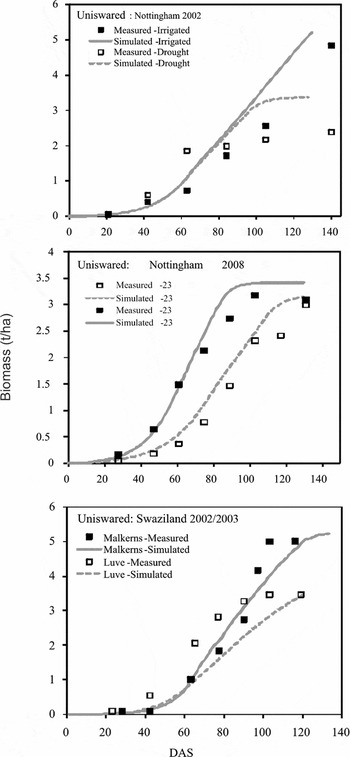
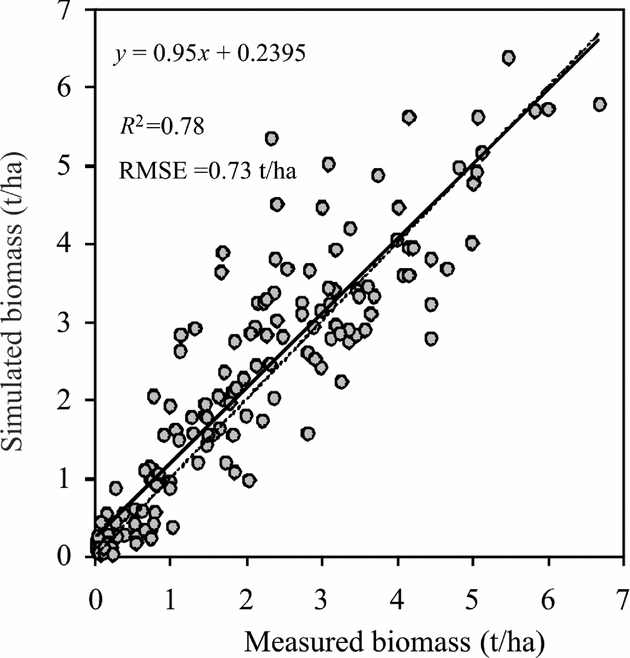
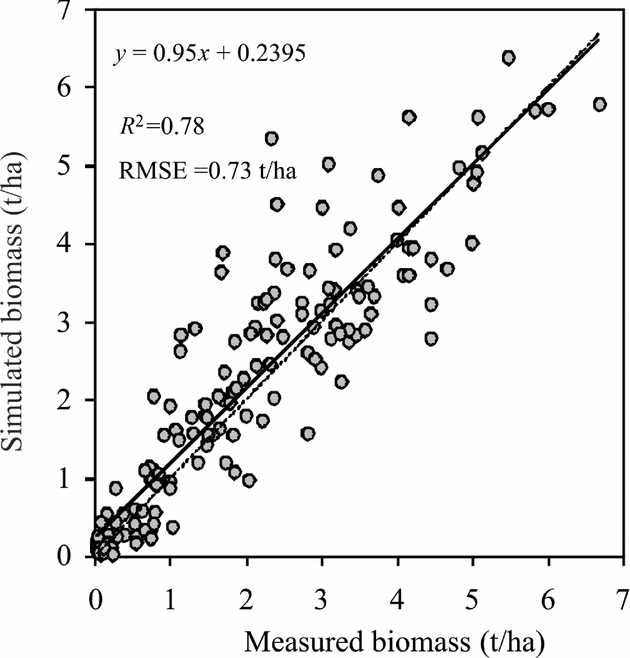
Simulation results for Uniswa Red under glasshouse conditions in the UK and field conditions in Swaziland are shown in Figure 5. Consistent overestimation was observed in TCRU-2002 experiments both under irrigated and drought conditions. However, the crop grown in TCRU-2008 with early drought at LT and HT reported an excellent fit to the observations of B. In Swaziland, the Luve experimental site with moisture stress indicated an underestimation of B thus indicating that the model is too severe with respect to drought stress coefficient. The combined result of all the landraces across experimental sites is shown in Figure 6. The linear regression of simulated v. measured biomass shows very small overestimation at the early stage. However the slope of the regression line (0.95) and the intercept (0.23) are not significantly different to the slope (1.0) and the intercept (0) of 1:1 line. The biomass production is explained successfully by AquaCrop indicating high R 2 (0.78). The RMSE (0.78 t ha−1) was acceptable, considering the carry-over effect due to the degree of error in CC.
Validation of biomass with days after sowing (DAS) grown under glasshouse conditions (TCRU-2002, 28 ± 5 °C irrigated and drought at 33 DAS; TCRU-2008, LT- 23 ± 5 °C and HT-33 ± 5 °C with drought at 33 DAS) and field sites in Swaziland (2002/2003 growing season; Malkerns, no water stress and Luve, with drought stress). Measured data are the average of 20 (LT), 30 (HT) and 10 (Swaziland) plants per landrace.

Comparison between measured and simulated B for tested four landraces in glasshouse experiments, Nottingham, UK and field sites in Swaziland 1:1 line (·····) and regression line (–).
Pod yield
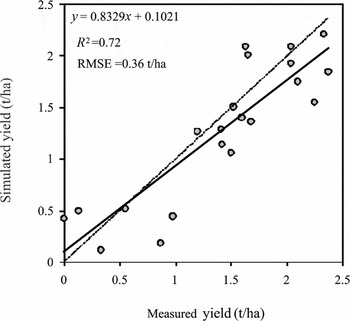
Simulation of end-of-season yield can be considered satisfactory with relatively high R 2 (0.72), with RMSE (0.36 t ha−1) lower than 0.5 t ha−1 (Figure 7). Two data points from Nottingham, UK, were not included in the regression due to the massive discrepancies with observed data.
Comparison between measured and simulated yield (Y) for tested four landraces in glasshouse experiments, Nottingham, UK and field sites in Swaziland 1:1 line (·····) and regression line (–).

DISCUSSION
On average, bambara groundnut canopy cover, biomass and yield can be successfully predicted by the AquaCrop model. It should be noted that, whilst most crop simulation models deal with genetically uniform varieties of major species, this version of AquaCrop can be used for a series of genetically variable landraces of an underutilized and under-researched species. However, the model validation results under variable climates reported overall underestimations for CC, B and Y. The agro-ecological adaptation of each landrace and intra-landrace variability can be suggested as the main reasons for the deviation of model simulations from observed values. In addition, variation in the quality and quantity of solar radiation may have indirect effects on AquaCrop simulations through ET0 (reference evapotranspiration) calculations.
Bambara groundnut landraces originated in various locations across semi-arid Africa. As a result the different landraces exhibit diverse adaptations to agro-ecological zones. According to the experimental evidence from the present study (TCRU-2006, 2007, 2008) and previous studies (Mwale, Reference Mwale2005; Mwale et al., Reference Mwale, Azam-Ali and Massawe2007a) the Namibian landrace, S19–3 showed a faster rate of development, which led to earlier maturity and also relatively better economy of water use compared to other landraces. In contrast, Uniswa Red was slower growing than both S19–3 and DipC (Mwale, Reference Mwale2005) in most physiological traits. In addition, the glasshouse experimental results from the present study showed significant reduction of pod formation in Uniswa Red when grown under high temperature (33 ± 5 °C) compared to S19–3. According to the detailed evaluation of responses of Uniswa Red, S19–3 and DipC for drought, Mwale et al. (Reference Mwale, Azam-Ali and Massawe2007a) reported that, S19–3 short phenology and fast development may reflects its adaptation to low rainfall (365 mm mean annual rainfall) and warm conditions with short growing period, whereas Uniswa Red showed its agro-ecological adaptation to relatively cooler, high rainfall (1390 mm mean annual rainfall) conditions by having a longer growing period. The climate of Botswana is similar to that in Namibia but with a slightly longer growing period (527 mm mean annual rainfall). The rainfall amounts, the daily mean temperatures and lengths of growing seasons in these countries appears to be closely related to the growth and developmental performances of the landraces used in the present study and show their agro-ecological adaptation. Based on the climates of Namibia, Swaziland and Botswana, it is apparent that bambara groundnut has wide climatic adaptations as reflected in the model simulations.
The deviation of model predictions from measured values can be further explained by the intra-landrace variability (BAMLINK-on going work, Sean Mayes personal communication). An estimate of ‘genetic width’, i.e. the intra-landrace variability, has to be considered for the landraces used in the present study. Most bambara groundnut landraces exist as a series of inbred lines, with the variability between lines dependent upon the genetic width of the parent materials. For most of the landraces, adaptive traits (phenological stages) are likely to be reasonably constant; due to the adaptation of the landrace to their original environment in which it is regularly grown and selected by farmers.
The effects of differences in the quality/quantity of solar radiation in field sites in semi-arid Africa and glasshouse environments in the UK are not well understood and no attempt has been made to quantify this. Therefore one practical approach to understand and overcome the effect of variability due to solar radiation is to conduct detailed field experiments in contrasting radiation environments to calibrate AquaCrop for different landraces, with two categories for field and glasshouse experiments in future validations.
CONCLUSIONS
Canopy development and biomass production of four tested landraces – Uniswa Red, S19–3, DipC and OM1 under glasshouse conditions in Nottingham, UK and field sites in Swaziland are successfully simulated by AquaCrop. Simulation of final yield is satisfactory but needs further improvement. The possible reasons for the discrepancies of simulated values from measured data are the variability of growth and developmental processes within landraces and significant differences in radiation levels in Africa and in Nottingham, UK. The current modelling aspects in bambara groundnut provided scientific evidence for developing a mathematical framework to predict the growth and yield of an underutilized crop under moisture-limited and non-limited conditions. This example for bambara groundnut can be used within the AquaCrop network as a basis for other underutilized crops that have genetically variable landraces rather than genetically improved varieties or cultivars.
Acknowledgements
The authors express their gratitude to Dr S. Mwale and Dr R. Cornelissen, I. Al-Shareef and S. Noah for providing data from their PhD research to calibrate and validate the AquaCrop model. The research described was a part of EU BAMLINK (INCO-CT-2005–015459) project funded through the EU Framework 6 Programme. The support for this and other EU-funded activities on bambara groundnut is warmly acknowledged. Special thanks are expressed to BAMLINK project partner Professor Abu Sesay, Botswana College of Agriculture, Botswana for allowing access to field data.