


1. Photogrammetry Basis
At the Vallée de la Sionne test site, canton Valais, Switzerland, photogrammetry was used to map the boundaries of the avalanche events precisely and to measure the surface of the snow cover before and after the triggering of the avalanche. The purpose of these measurements was to obtain detailed information, based on the differences between the two states, about the released and deposited volumes of snow.
Photogrammetry is a well-established method to measure X, Y, Z coordinates of topographic points (Reference Kraus and WaldhäuslKraus and Waldhausl, 1998). Taking pictures of an object or terrain from different view angles allows the construction of a three-dimensional stereoscopic vision. The instrument needed for the photogrammetric measurements is called a “stereo plotter”. There are analytical as well as digital stereo plotters. To obtain the stereoscopic vision, two different pictures of an object are required. This couple is termed “model”. In order to transform the image coordinates (x, y) into object coordinates (X, Y, Z) an operation termed “orientation” must be performed. The orientation is the determination of the position (X, Y, Z) and of the direction angles (Ω,Φ, K) at the time of the image capture. The orientation of a model is divided into three steps: (1) inner orientation, (2) relative orientation and (3) absolute orientation. The inner orientation is determined by measuring at least three precise marks on the image (termed “fiducial marks”) where the image coordinates are known. This operation places the image in the coordinate system of the stereo plotter. The relative orientation is determined by measuring well-distributed points on both pictures. The absolute orientation creates the correspondence of the three-dimensional model with the terrain coordinate system. It is performed by measuring known points on the ground (termed “ground-control points” or GCPs). The GCPs have to be well distributed and clearly identifiable in the images. Usually more than two pictures are necessary to cover an area. Therefore, more than three GCPs are necessary and an adjustment among all the GCP measurements is necessary, using least-squares or bundle block methods. The measurement of the X, Y, Z coordinates in the stereoscopic model is termed “restitution”. While this operation is man-made on analytical stereo plotters, it could be automated with digital stereo plotters by means of automatic image correlation. However, in case of bad contrast in the images (e.g. new snow) no automatic image correlation is possible and only the analytical (i.e human) solution provides reliable results. For a detailed introduction to the photogrammetric method refer to Reference Kraus and WaldhäuslKraus and Waldhausl (1998).
The use of photogrammetry at the Vallee de la Sionne test site revealed some problems with respect to avalanche measurements that are not easy to resolve by standard photogrammetric procedures:
-
1. An undisturbed new-snow cover has very little contrast. Therefore a precise measurement of the snow cover in the release zone before the triggering is very difficult to achieve.
-
2. Since avalanche situations cannot generally be forecast > 3 days in advance, the procedure must be flexible and rapidly implemented.
-
3. Experience with avalanche triggering at the Vallee de la Sionne test site shows that it is necessary to take the photographs of the release zones before 0900 h in order to trigger the avalanches shortly after this time, since after 1000 h the likelihood of a successful triggering decreases due to the intensive solar radiation.
-
4. The positioning of GGPs in the release area is very difficult, since points have to be found that are visible even after a heavy snowfall period.
To meet the requirements of flexibility and speed, a system has been chosen that is based on the use of a light aerial hand-held Linhof camera with an image size of 4 in × 5 in. A helicopter flies close to the ground (<450 m) in order to take large-scale (1:4500) vertical pictures of the deposition zone and oblique pictures of the release area.
Both release area and deposition area were targeted with 50 GGPs. Rectangular plates of 60 cm × 60 cm with a yellow diagonal cross on a black background were used as GCPs. The coordinates of the GCPs were measured in the release area with theodolites, and in the deposition area with a differential global positioning system (GPS). In the release area the GCPs have been carefully selected based on the observation of permanently snow-free points during winters 1994–97.
2. Avalanche Events in 1999
In 1999 three large avalanche events were artificially triggered at the Vallee de la Sionne test site. Figure 1 provides an overview of the perimeters of these avalanches. Table 1 summarizes the photogrammetric measurements taken. Usually, it was not planned to take photographs of the deposition area before the avalanche triggering, since before 0900 h the area is still in shadow, so the accuracy of the photogrammetric measurements decreases. For the volume derivation, the surface of the deposition of the preceding avalanche is directly used by neglecting the new-snow amount that occurred in the meantime. Details of the photogrammetric measurements are described in the following.
Overview of avalanches in 1999. Circles in release and deposition zones delineate areas where photogrammetric points were targeted. The positions of obstacles and the bunker are marked. Contour interval is 20 m.

Overview of the photogrammetric measurements in 1999 before and after the avalanche triggering

30 January 1999
Because wind speeds were > 130 km h–1, it was impossible to take photographs of the release area before the avalanche triggering. Therefore, pictures were taken in the release zone only after the avalanche. Taking pictures in the deposition zone before the avalanche triggering was necessary because the deposition area was already covered by many spontaneous avalanches that preceded the artificially triggered avalanche. However, 60% of the area covered by the photographs before the avalanche was in shadow. This shadow reduced the contrast, i.e. the accuracy of the restitution.
10 February 1999
Aerial photographs were taken before and after the triggered avalanche as planned in the release as well as in the deposition area. However, the perimeter of the avalanche exceeded the targeted release area (see Fig. 1). The fracture extended 700 m to the south, and the depositions exceeded the lower limit of the targeted deposition area. In the deposition area the avalanche destroyed half of the control points. Pictures were taken in the entire area even if it was not completely targeted.
25 February 1999
Due to a defect of the film winder, no pictures were taken before the avalanche. Nevertheless, pictures of the fracture line were taken with the Linhof camera after the avalanche. Due to the extreme size of the avalanche event, the deposition area was more than twice the targeted area. All control points in the deposition area were destroyed. New temporary targets had to be deployed with GPS field measurements before the flight over the deposition area. In order to facilitate and improve the quality of the measurements, a large-format RC-30 camera was used in this special case.
3. Photogrammetric Results
3.1. Accuracy of the orientation
The obliquity of the images of the release area required the use of an analytical stereo plotter. An analytical plotter combined with the BLUH block adjustment software (Reference JakobsenJakobsen, 1994) was used for both the orientation and the restitution. In the deposition area, the Socet Set Method of LH-Systems (detailed information available at http://www.lh-systems.com) was used for the orientation. Good contrast in the deposition area allowed the use of automatic image correlation using a digital stereo plotter. The results of the automatic correlation were controlled and corrected manually.
In Table 2, the scales of the photographs and accuracy of the orientation are summarized. The overall accuracy of the orientation can be expressed by the root-mean-square error (rms) of the deviations at the GCPs. A good rms value is crucial for the quality of the volume measurements, since a bad orientation infers systematic errors that strongly influence the difference between two models. This overall accuracy of the orientation that can be stated precisely by the rms depends on the scale of the photographs as well as on the distribution of the GCPs. Well-distributed control points lead to a reliable orientation (+ + inTable 2), whereas control points that are distributed along a line make orientation weak, i.e. in some part of the model inaccurate (- -). Furthermore the orientation depends on the qualify of the control points, i.e. if they can be clearly identified (++) or if some of them are hardly visible on the photographs (– –).
Overview of the quality of the photogrammetric measurements in 1999 before and after the avalanche triggering

3.2. Fracture depth along the fracture line
Since only a relative measurement in a single model is required, the fracture-line depth measurements are not strongly influenced by the orientation. The precision of these measurements is therefore given by the inner orientation and can be assumed to be about 10–15 cm. This error is also termed as noise of a single point measurement.
Since the fracture lines are clearly visible in the oblique photographs of the release area, the measurements along these lines can be undertaken quite precisely. Even for the avalanche on 10 February it was possible to measure the fracture depth along a length of 470 m of the fracture line despite the bad image orientation. The photographs of 25 February had to be repeated 5 days later due to a film-winder defect of the camera. The settling value measured by the neighbouring snow-measurement station was 45 cm. This value was added to roughly compensate the settling during this time period. The error of this compensation is estimated to be ±20 cm. This error must be added to the error of the absolute orientation, so on 25 February the accuracy of a single point measurement along the fracture line is about ±35 cm. Table 3 lists the average fracture depth perpendicular to the slope d0, the accuracy of a single point measurement, the standard deviation of all measurements along the fracture line and the lengths of the fracture line.
Average fracture depths d0, accuracy of the single point measurements, standard deviation of all measurements along the fracture lines and length of the fracture lines

In Figure 2 the fracture depth along the fracture line of the largest avalanche (25 February) is shown. It was 1.0–3.5 m, with an average of about 2.10 m over a length of > 1000 m. This depth has to be considered extreme according to the statistically derived fracture depths in Switzerland (Reference Salm, Burkard and GublerSalm and others, 1990).
Fracture depths along fracture line of the avalanche of 25 February 1999. Dotted lines indicate error of single point measurements (±0.35m).

3.3. Volumetric measurements in the release area of the 10 February avalanche
Pictures before and after the avalanche triggering in the release zone were taken only on 10 February (see Table 1). Therefore, all statements in this subsection refer to this event. For volumetric measurements the orientation is crucial because the computation of the volume refers to two different states, i.e. two different sets of picture orientation. In this case, systematic errors have an important influence on the volume. This kind of error influences the volume more than the error made on a single point measurement.
In order to reduce systematic error between both models, the avalanche situation after the triggering was measured first. Afterwards the same points on the pre-avalanche situation were used for the orientation. In areas where the fracture exceeded the targeted area, natural points on both models were used as GCPs for the orientation. An accuracy (rms) of about 25 cm between both states was achieved by this procedure.
In addition to the accuracy of the orientation, the noise of the measurement of a single point also produces an error. This error depends mainly on the contrast of the snow cover. One possibility to estimate the accuracy of a single point measurement is to compare neighbouring points with each other, assuming that they should have more or less the same depth. In Figure 3 the results of such a comparison in critical areas are given. Based on this comparison, the noise can be estimated to be about 60 cm.
Variability (noise) of single point measurements in release zone of the 10 February avalanche. The differences between neighbouring points were used as measure of the noise.

Another method to estimate the accuracy of single point measurements is to compare the measurements carried out by different persons. This test revealed that in areas with a good contrast, the accuracy of a single point measurement was about 15 cm, whereas for a low contrast this was reduced to 60 cm. Note that the noise of single point measurements does not significantly affect the volume calculations, since the average value of noise is about zero (as shown in Fig. 3).
After the avalanche event the restitution did not cause problems, due to a good contrast. A grid of 2900 points was measured. Before the avalanche, however, the lack of contrast allowed the measurement of only about half of the targeted area, i.e. 1700 points. Figure 4 shows the depths in the measured release area.
Measured release-depth ranges in the targeted part of the release area of the 10 February avalanche. Accuracy of single point measurements is ±0.6m. Contour interval is 20 m.

Despite the incompleteness due to the lack of contrast, and reservations about the accuracy of single point measurements, some important information can be derived about the release-depth distribution. The largest depths of the released slab were not at the fracture line, but either directly below the steepest parts of the rocks, where the slope begins to decrease slightly, or in gullies. The volume calculation of the measured areas gives an average release depth of 1.20 m, which is about 35 cm more than the average along the fracture line (Table 3).
3.4. Volumetric measurements in the deposition areas
For the 30 February event the deposition before and after the avalanche was orientated successfully (Table 2) and restitution provides good-quality snow-surface information after the avalanche. However, some of the shadowed areas before the avalanche could not be measured precisely, due to a lack of contrast. In these areas irregularities appeared in the volume calculations.
For the 10 February event neither orientation nor restitution caused any problem. The contrast conditions allowed a restitution with an accuracy of 30 cm. The maximum depositions of up to 15 m were in the bottom of the valley, just at the locations where the different avalanche arms entered the main valley.
Because of the large size of the 25 February avalanche, all GCPs of the deposition area were destroyed. This reduced the accuracy of the orientation of the pictures to 50 cm. The contrast, however, was very good, so that the overall accuracy can be estimated to about ±60 cm. In Figure 5 the difference in the snow surface after the avalanches of 10 and 25 February is shown.
25 February avalanche deposit in Vallee de la Sionne. Dotted lines are view angle of the picture in Figure 6.

The maximum depositions of up to 16 m were in the bottom of the valley, directly below the shelter, and at the tip of the avalanche, >1000 m after the avalanche entered the main valley. Moreover, not only deposition but also erosion of the previous avalanche deposition is clearly visible in parts of the deposition zone. This erosion (e.g. at the curve before entering the small avalanche deposition arm in the southeast) is also clearly visible in Figure 6. Note that only the erosion that is visible when the avalanche came to rest is measured. Erosion during the avalanche process that is covered later on with new deposits could not be measured photogrammetrically. The measured volume differences between all three avalanche events are listed inTable 4.
Part of 25 February 1999 avalanche deposit. Erosion effects are clearly visible (righthand side). Picture by M. Schaer( SLF).

Photogrammetric ally measured volume differences between the three main avalanche events, 1999

4. Discussion
The photogrammetric results presented above did not cover the whole area of the avalanche track. For the track below the release area and above the deposition area, no quantitative information except a few point measurements is available. With the help of video images, it was possible to identify roughly the area of the initial slab and, based on this, to estimate the initial release volume of every avalanche. The snow densities at the fracture line were measured at a few points. For comparison with the volumes in the deposition zone, these values are shown inTable 5.
Rough estimates of the initial fracture dimensions
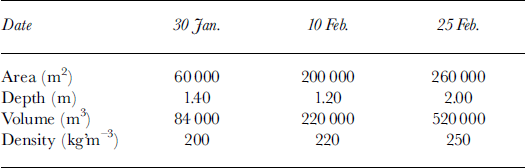
In the uppermost 2 m of the deposition of all avalanche events, densities of 350–500 kg m–3 were measured in the field. Thus, considering a densification of the snow by about a factor 2, the comparison of the initial volumes with the deposited volumes clearly emphasizes the amount of entrainment of the existing snow cover below the release area for the two events in February. The 25 February avalanche crossed an area of 900 000 m2 below the release area. To be able to collect the densified volume of 870 000 m3, about 1.5 m of the snow cover on this area had to be collected, i.e. most of the new snow that had fallen since 10 February.
These mass considerations are important since many avalanche models used today (Reference Salm, Burkard and GublerSalm and others, 1990; Reference Bartelt, Salm and GruberBartelt and others, 1999) completely neglect the entrainment of snow. The results clearly emphasize the need to include entrainment and deposition along the whole avalanche track in the modelling. Discussion of the integration of these processes can be found, for example, in Reference Perla, Lied and KristensenPerla and others (1984).
Contrary to the findings from the 10 and 25 February avalanches, the 30 January avalanche did not entrain much snow. The most likely reason for this lack of entrainment is that on 28 January a large spontaneous avalanche had already occurred, which collected most of the existing snow along the track.
5. Conclusions and Future Development
The results obtained by photogrammetry during these three large avalanches revealed that it is a very useful method for measuring deposition depths. Thanks to the good contrast of an avalanche deposition, snow-depth measurements with an accuracy of 20–30 cm can be expected. Even for the largest avalanche, which destroyed all GCPs in the deposition zone, an accuracy of 60 cm was achieved. This value was sufficient since the deposition depths varied between –4 m (i.e. erosion of the deposits of the 10 February avalanche) and +16 m.
However, the results in the release area clearly demonstrated the limits of the method. Winter conditions like stormy winds, the poor contrast of fresh snow before the avalanche triggering and the need for well-distributed, targeted GCPs were limiting factors. It was possible to measure the depth along the fracture line with a precision of 20 cm for all three avalanche events. However, the volumetric measurements within the release area of the avalanche event of 10 February clearly showed that the fracture-line depth is not representative for the whole area, especially when the release area consists of different slope angles and gullies. Wind-transportation effects on the initial release slab volume were identified by the photogrammetric measurements. Nevertheless, a precise measurement of the fracture-line depths helps to reduce the error of the estimation of the initial volume of the slab in comparison with single point fracture depth measurements.
The findings about the snow entrainment showed that it is possible that almost the whole new snow cover below the release area can be collected by large avalanches under extreme conditions. Processes like erosion of the existing snow cover or even of existing avalanche deposits must be included in the future model development. For this purpose, the measurements conducted on these large avalanches, especially that on 25 February, provide very useful data on a large scale, i.e. the final deposition distribution.
In order to improve the method of photogrammetry, tests to integrate the Linhof camera with a navigation system (inertial unit in combination with GPS) are ongoing, with the purpose of allowing the orientation of photographs without GCPs. With the additional flexibility, it will be possible to take and orientate pictures on the whole track, i.e. also in the track area below the release zone.
Parallel to this improvement of the photogrammetry, the evaluation of new techniques of airborne laser-altimeter scanners with respect to snow surface measurement is continuing. Preliminary results revealed, however, that at the moment, even if these methods provide good results on snow and are insensitive to contrast and illumination, their applicability is questionable due to the high costs relative to the small area treated, and the flexibility needed with respect to the triggering date.
Acknowledgements
We thank W. Ammann for his substantial efforts to initiate the Vallee de la Sionne experimental project. The site was financed by the Governing Board of the EPFL. We thank them for their generous support. We also thank C. Wouilloud who provided continuous local assistance.



