


INTRODUCTION
Communication is a critical component of representation (Burke Reference Burke1774; Cohen Reference Cohen, Hamlin and Petit1989; Habermas Reference Habermas1968; Mansbridge Reference Mansbridge2003; Mill Reference Mill1861; Pitkin Reference Pitkin1967). Effective representation requires a dynamic, deliberative sharing of information between the elected official and those they represent in office. Although communication has always played a central role in representative government, developments in both society and technology affect what information gets shared and how.
In this article, we introduce new data and measures that shed light on how rhetoric by elected representatives has evolved in the era of social media, email, and other online communication. Our focus is Congress, perhaps the most studied representative assembly. In the 1970s, scholars such as Mayhew (Reference Mayhew1974) and Fenno (Reference Fenno1978) put a spotlight on congressional communications, arguing that legislators strategically promote themselves to various constituencies for electoral and other reasons. A key insight was that most messaging by legislators aims to achieve one of a few universal goals, such as promoting a personal brand, claiming credit for legislative accomplishments, taking stances on issues voters care about, or adopting a home style.
Fifty years later, there has been both continuity and change in congressional communication. Members today continue to advertise, claim credit, take positions, and connect with constituents. But the way in which they do so differs considerably from earlier decades. Unlike when Mayhew and Fenno were writing, the advent of online communication and social media mean that legislators can reach a vast audience both inside and outside of their district boundaries nearly instantaneously (Gainous and Wagner Reference Gainous and Wagner2013; Russell Reference Russell2021b). Traditional gatekeepers such as parties and legacy media organizations no longer maintain an oligopoly on communication, enabling politicians to connect with the public directly using chosen messages (Jungherr and Schroeder Reference Jungherr and Schroeder2022; Schroeder Reference Schroeder2018). Changes in the technological environment have been accompanied by changes in the political environment. Partisanship and polarization both inside and outside of Congress have grown considerably (McCarty Reference McCarty2019).
This article advances the study of representation and communication in two ways. First, we introduce new data on communications by members of Congress spanning multiple platforms over a 14-year period (2009–22), covering almost the entire time period that social media has been widely used.Footnote 1 The dataset includes over 4.7 million tweets, 2.4 million Facebook posts, and 184,000 email newsletters. A textual scaling model is used to place each message on a partisan spectrum from far left to moderate to far right based on the language used. Similarly, a set of transformer-based classification models pretrained on social media are used to classify each message into six different categories based on the intended purpose of the message, classifications that encompass over 72% of all communications in our dataset.
Second, we demonstrate the possibilities our data unlock via several applications. In these applications, we chart the development of congressional rhetoric across the social media period. Congressional rhetoric has become more partisan as well as more negative, trends found across all platforms. Possibly contributing toward this development, we find that partisanship, position-taking, and negativity receive much more engagement on social media than other types of messaging (e.g., credit claiming or constituency service).
The article proceeds as follows. First, we detail our data collection process and the computational methods used to measure partisanship and classify representational content in congressional communications. After a series of extensive validations of the measures, we proceed to the applications described above, examining temporal trends in rhetoric and exploring differences in online engagement. Throughout, we demonstrate how our new dataset enables more comprehensive investigations of elite political communication than previously possible.
CONGRESSIONAL RHETORIC AND ONLINE COMMUNICATION
The literature on congressional representation has long recognized that members play an active and strategic role in communicating information for various purposes, particularly electoral success (Fenno Reference Fenno1978; Mayhew Reference Mayhew1974; Yiannakis Reference Yiannakis1982). For instance, Fenno (Reference Fenno1978) emphasizes how political representatives shape their public image to align with crucial district elements, crafting a distinct “homestyle” to cultivate the trust of their constituents. Mayhew (Reference Mayhew1974) highlights three activities in particular that members do to enhance their re-election chances: position-taking (establishing stances on political issues); credit claiming (taking responsibility for work done to pass legislation and secure resources for their districts); and advertising (bolstering name recognition, highlighting appearances at events and mentions in the media). More recent work confirms that members of Congress continue to use similar messaging strategies in modern times (e.g., Ban and Kaslovsky Reference Ban and Kaslovsky2025; Grimmer Reference Grimmer2013; Hunt and Miler Reference Hunt and Miler2025; Russell Reference Russell2021b).
But while the underlying purposes of communication may seem similar, the means of communication have changed dramatically. In the contemporary era, the rise of the internet and social media has transformed communication, allowing representatives to reach a wider audience than ever before. Members of Congress are no longer dependent on a franking privilege to directly reach those they represent, and even lowly rank-and-file legislators now have the ability to broadcast views far beyond the boundaries of their districts. Moreover, messages no longer have to pass through newspaper reporters or television anchors before reaching the public (Gainous and Wagner Reference Gainous and Wagner2013; Russell Reference Russell2021b). The internet and social media allow representatives to reach constituents in a direct and unmediated way. At the same time, the proliferation of information requires information to break through the noise; with the demise of traditional news sources such as local papers (Canes-Wrone and Kistner Reference Canes-Wrone, Kistner, Cameron, Canes-Wrone, Gordon and Huber2023; Hayes and Lawless Reference Hayes and Lawless2015; Reference Hayes and Lawless2017; Peterson Reference Peterson2021), there is no single front page or editorial section equivalent that guarantees messages will be seen by a large, captive audience (Jungherr and Schroeder Reference Jungherr and Schroeder2022; Schroeder Reference Schroeder2018). Social media has also enabled two-way communication between the mass public and political elites, allowing each group to influence the discourse of the other (Barberá et al. Reference Barberá, Casas, Nagler, Egan, Bonneau, Jost and Tucker2019; Warner Reference Warner2023).
Researchers have begun studying how political elites use these new forms of media, although the field is still nascent. As recently as 2017, scholars were referring to online tools of campaign communication “smartphones, Facebook, blogs, and the like” as “niche communication(s)” (Frankel and Sunshine Hillygus Reference Frankel, Hillygus, Kenski and Jamieson2017). Still, considerable progress has been made in understanding how these tools are used. We view these works as creating at least two major strands of research.
One of these major strands focuses on explaining what factors shape differential usage of social media and online communication, both in terms of the volume of social media usage as well as which types of messages (e.g., position-taking vs. credit claiming) members choose to prioritize (Albert Reference Albert2020; Cormack Reference Cormack2016a; Reference Cormack2016b; Evans and Clark Reference Evans and Clark2016; Evans, Cordova, and Sipole Reference Evans, Cordova and Sipole2014; Hemphill, Russell, and Schöpke-Gonzalez Reference Hemphill, Russell and Schöpke-Gonzalez2021; Hunt and Miler Reference Hunt and Miler2025; Russell Reference Russell2018a; Reference Russell2018b; Reference Russell2021a; Reference Russell2021b; Scherpereel, Wohlgemuth, and Lievens Reference Scherpereel, Wohlgemuth and Lievens2018; Smith and Russell Reference Smith and Russell2022; Straus et al. Reference Straus, Williams, Shogan and Glassman2016; Tillery Reference Tillery2021). This work typically considers the political, institutional, demographic, sociological, and other variables that lead politicians to communicate in different ways.
A second major strand of research focuses on how rhetoric has evolved in response not just to the rise of social media, but also to the growing political polarization in American society. While many have studied the polarizing effects of social media usage on the mass public (for a review, see Tucker et al. Reference Tucker, Guess, Barbera, Vaccari, Siegel, Sanovich and Stukal2018), others have focused more specifically on how political elites use social media in polarizing ways, via the language they use and how they discuss political issues online. Research on congressional rhetoric has considered the extent to which lawmakers deploy polarizing or extreme rhetoric (Ballard et al. Reference Ballard, DeTamble, Dorsey, Heseltine and Johnson2023; Cowburn and Sältzer Reference Cowburn and Sältzer2025; Heseltine Reference Heseltine2023; Reference Heseltine2024; Kaslovsky and Kistner Reference Kaslovsky and Kistner2025), negativity (Macdonald, Russell, and Hua Reference Macdonald, Russell and Hua2023; Macdonald, Hua, and Russell Reference Macdonald, Hua and Russell2024; Russell Reference Russell2018a; Yu, Wojcieszak, and Casas Reference Yu, Wojcieszak and Casas2024), and uncivil language (Ballard et al. Reference Ballard, DeTamble, Dorsey, Heseltine and Johnson2022). Once again, a common theme in this work is the importance of electoral incentives in shaping member behaviors. Both social media users and donors (categories with some overlap) reward this type of language with engagement (Ballard et al. Reference Ballard, DeTamble, Dorsey, Heseltine and Johnson2023; Macdonald, Russell, and Hua Reference Macdonald, Russell and Hua2023) and dollars (Fu and Howell Reference Fu and Howell2020; Hilden and Kistner Reference Hilden and Kistner2025; Yu, Wojcieszak, and Casas Reference Yu, Wojcieszak and Casas2024).
While this research has improved our understanding of how representatives communicate, most of this work has been hamstrung by three key limitations. The first limitation, common to almost all of the above-cited research, is a focus on short time periods. Due in part to the difficulties in collecting and cleaning communication data, most research uses at most a few years of data, which can lead to inferential issues.Footnote 2 For instance, studies using data from a single session (Hemphill, Russell, and Schöpke-Gonzalez Reference Hemphill, Russell and Schöpke-Gonzalez2021; Yu, Wojcieszak, and Casas Reference Yu, Wojcieszak and Casas2024) have found communication differences between Democrats and Republicans, which are attributed to one party being in the majority and the other in the minority. But Democrats and Republicans differ from each other in many ways, making it impossible to separate partisan differences from majority–minority differences when analyzing just a single session’s worth of data.
Besides avoiding problems such as these, longer time spans are desirable for another reason. It’s unclear whether congressional communication has stayed largely constant or evolved as social media usage and technology have changed. Particularly given the speed of developments in online communication, a major concern is the temporal validity of findings in this area (Munger Reference Munger2023). Assessing how stable conclusions are requires data covering longer periods of time.
A second issue with most existing research is examining communication on a single platform.Footnote 3 The audiences members speak to when posting on a social media platform like Twitter/X—where messages are seen by a heterogeneous mix of political enthusiasts, journalists, interest group members, fellow politicians, and more—look very different from the recipients of email newsletters, which are targeted more directly toward constituents.Footnote 4 Recently published research demonstrates that these different audiences matter. Members vary in terms of how much they post on Facebook versus Twitter/X (Blum, Cormack, and Shoub Reference Blum, Cormack and Shoub2023). Furthermore, the partisanship of member speech can vary by venue, as sometimes members appear more partisan when measured using communication in one form versus another (Green et al. Reference Green, Shoub, Blum and Cormack2024). Other hypotheses researchers are interested in testing may be platform-specific, and demonstrating similarities or differences across platforms can provide deeper insight.
The third issue is that the current system—where research teams individually download, clean, and prepare different versions of similar datasets—is inherently wasteful and slows the pace of scientific progress. Having a central repository of easily accessible, ready-to-use data allows researchers to spend their time developing and testing theories of political communication, not repeating time-consuming data work that has been done many times over. To build on this point, having a single commonly-used dataset ensures that similar cleaning and sample inclusion decisions have been made. Idiosyncratic data processing decisions (that may not be immediately obvious to readers) can be eliminated as possible explanations when differing results emerge, making comparison of results more transparent.
For these reasons, the study of communication and representation stands to benefit enormously from a single publicly available dataset with multimodal and longitudinal data, classified by representational purpose and scaled according to the partisan positioning expressed via the message. In the remainder of the article, we describe our efforts to accomplish exactly that.
MEASURING PARTISANSHIP AND REPRESENTATION
To address these limitations and advance future research, we create the Scaled and Classified Congressional Communication (SCCC) dataset, a multimodal dataset spanning the years 2009–22. The dataset includes posts on the two most-used social media platforms by members of Congress (Twitter/X and Facebook) as well as email newsletters, a common form of communication members used primarily to reach constituents. In addition to texts of communications, we possess auxiliary variables such as social media engagement metrics (likes, retweets, shares, etc.).
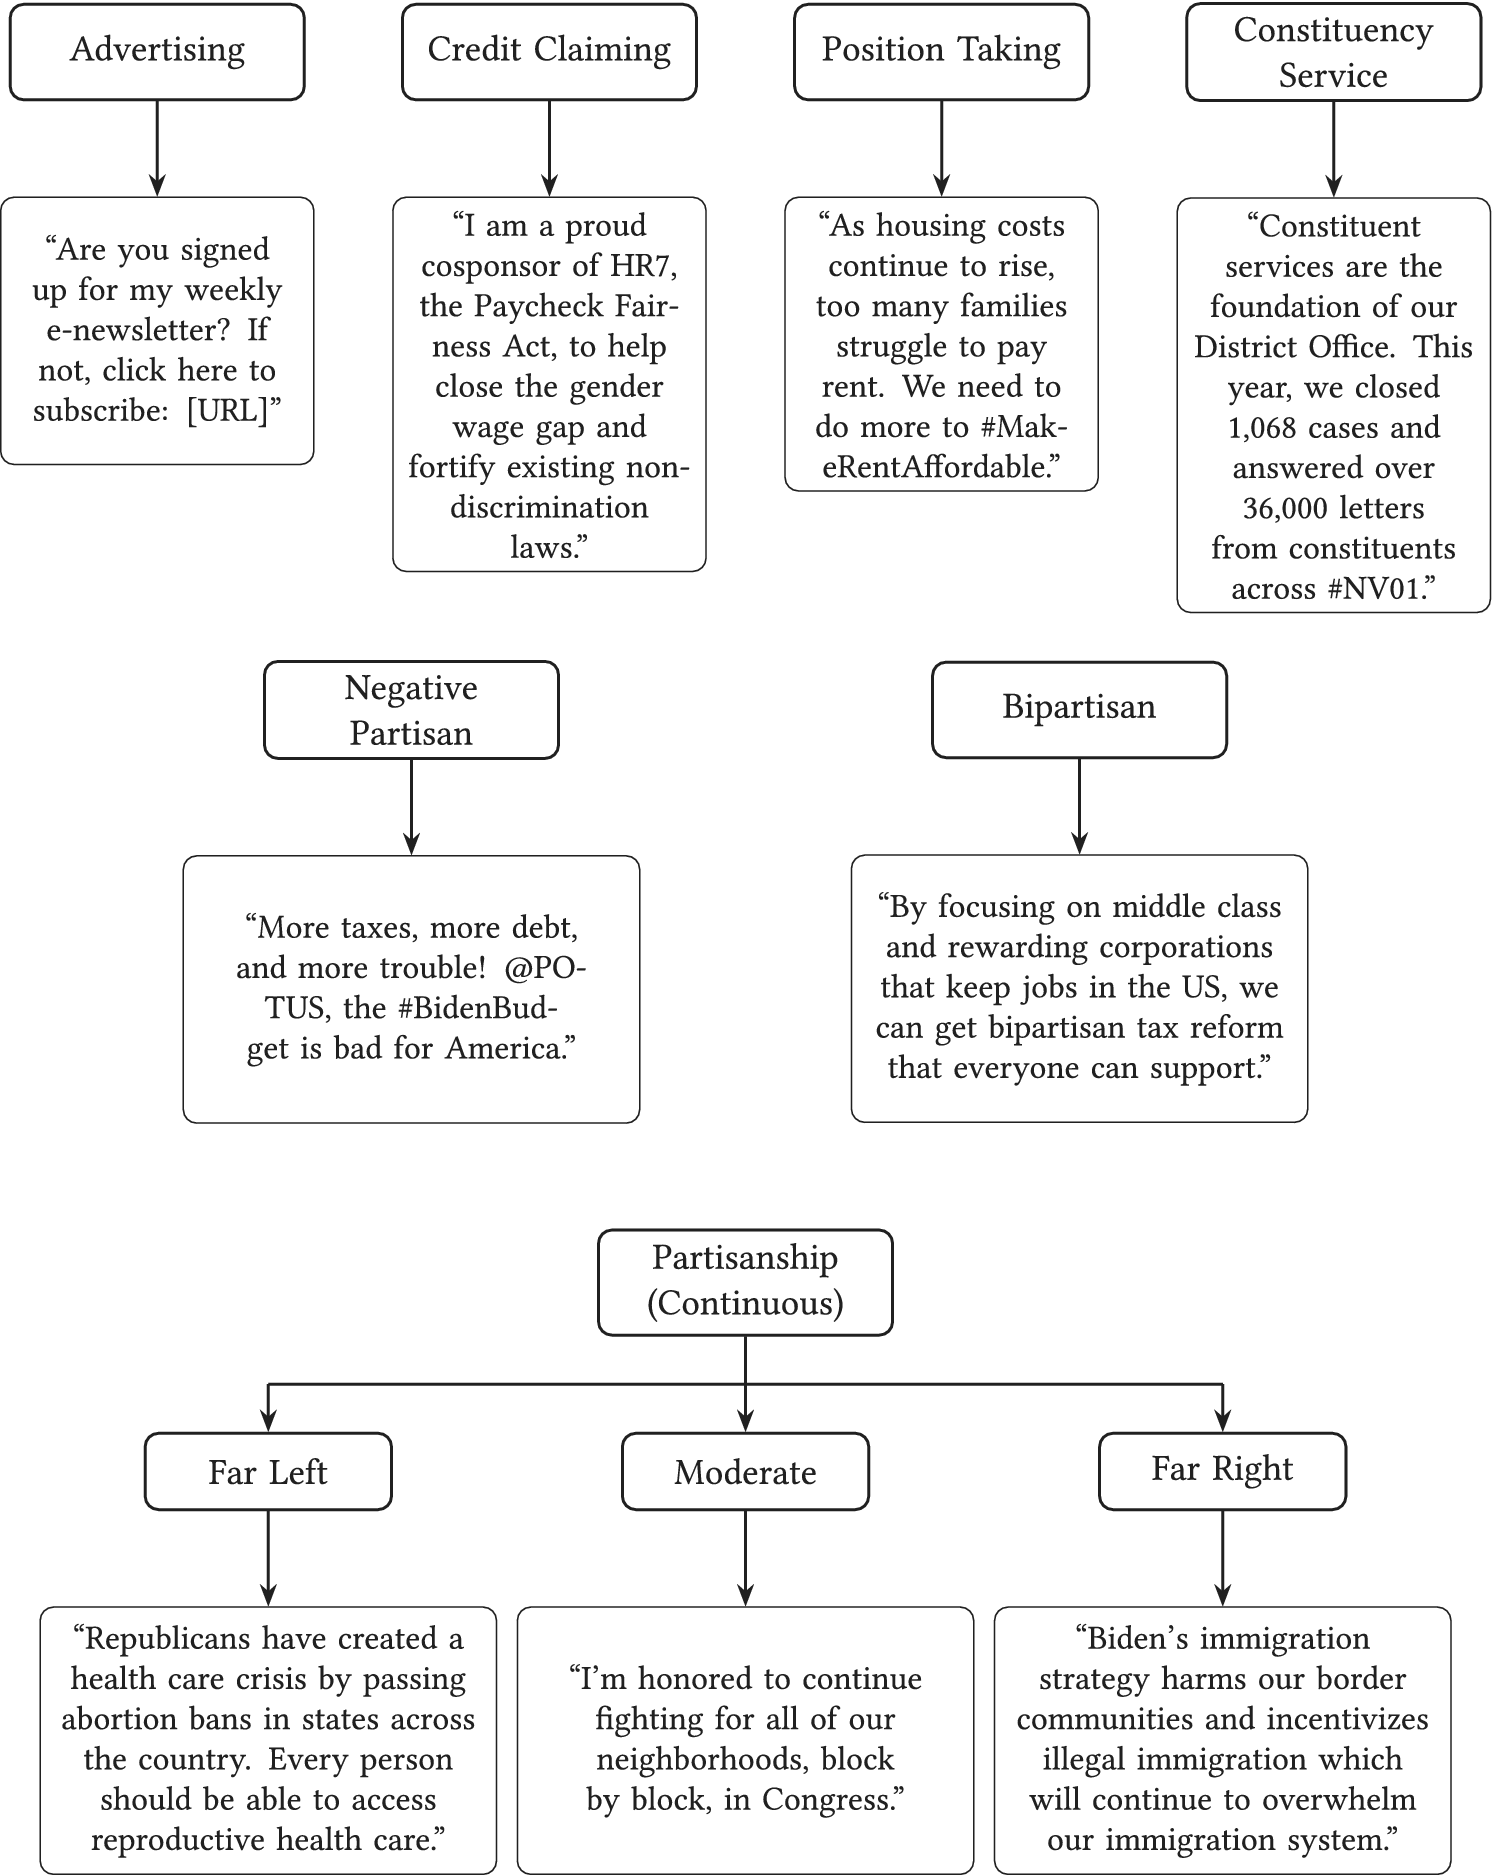
Measurement schemata are shown in Figure 1, along with corresponding example messages. The representational categories come directly from Mayhew (Reference Mayhew1974) and Fenno (Reference Fenno1978). These categories are Advertising (“any effort to disseminate one’s name among constituents in such a fashion as to create a favorable image”), Credit Claiming (“generat[ing] a belief
$ \dots $
 that one is personally responsible for causing the government, or some unit thereof, to do something that the actor
$ \dots $
 considers desirable”), Position Taking (“a judgmental statement on anything likely to be of interest to political actors”), and Constituency Service, which corresponds to two components of home style: the “presentation of self” in the district (meetings with constituents, attendance at social events, etc.), and “allocation of resources” to the district (helping constituents with obtaining passports, social security checks, or internships in public office).Footnote
5
Classification and Scaling Schemata with Example Text

Figure 1. Long description
The flowchart is divided into three rows.
Top row, from left to right:
* Advertising: An arrow points to a box asking if the reader is signed up for a weekly e-newsletter and providing a U R L link.
* Credit Claiming: An arrow points to a box stating, ‘I am a proud cosponsor of H R 7, the Paycheck Fairness Act, to help close the gender wage gap and fortify existing non-discrimination laws.’
* Position Taking: An arrow points to a box discussing rising housing costs and the need to #MakeRentAffordable.
* Constituency Service: An arrow points to a box stating that constituent services are the foundation of the District Office, noting 1,068 cases closed and 36,000 letters answered across #N V 0 1.
Middle row, from left to right:
* Negative Partisan: An arrow points to a box criticizing taxes and debt, mentioning @P O T U S and stating the #BidenBudget is bad for America.
* Bipartisan: An arrow points to a box about focusing on the middle class and rewarding corporations that keep jobs in the U S to achieve bipartisan tax reform.
Bottom row, Partisanship Continuous scale:
* A central box labeled Partisanship Continuous branches into three categories:
* Far Left: An arrow points to a box criticizing Republicans for a health care crisis regarding abortion bans and advocating for reproductive health care access.
* Moderate: An arrow points to a box about fighting for neighborhoods, block by block, in Congress.
* Far Right: An arrow points to a box criticizing Biden's immigration strategy for harming border communities and incentivizing illegal immigration.
The partisanship categories mirror those studied by Russell (Reference Russell2018b); specifically, we identify both Negative Partisanship (an attack on the policies and politicians of the opposing party) and Bipartisanship (advocating the value of bipartisan collaboration) in messages.Footnote
6 In addition, we estimate the Partisan Orientation of each message on a scale that ranges from
$ -1 $
 (most Democrat-leaning) to 0 (nonpartisan) to 1 (most Republican-leaning).
The categories are neither mutually exclusive nor collectively exhaustive. A single tweet could, for instance, advertise (“As the representative for TX-23,”
$ \dots $
 ), position-take (“securing the border is one of my top priorities.”), credit claim (“This is why I’m sponsoring legislation
$ \dots $
 ”), and make a negative partisan attack (“The Biden border crisis must be stopped!”). It can also be none of the above, wishing (for example) followers a Merry Christmas or Happy Holidays.
While we choose these categories in part based on congruence with existing research, these categories also each represent critical components of the information voters require in order to hold legislators accountable. A useful theoretical framework to think about representation is the principal–agent model of political accountability (Ashworth Reference Ashworth2012; Besley Reference Besley2006), in which voters select politicians with aligned preferences whom they believe will do the best jobs of advancing their interests. As a consequence, politicians motivated by re-election take actions that correspond to voter preferences and benefit constituents, in order to maximize their chances of remaining in office. This relationship requires that voters know who their representatives are (which advertising facilitates), how they vote for or against specific policies (position-taking), and the actions they take to aid voters (credit-claiming, constituent service). Bipartisan and negative partisan messages send signals to voters about whether representatives will work with or oppose members of the other party, also critical pieces of information in a polarized age.
Data Collection
The communications data come from multiple sources. For tweets and Facebook posts, data were downloaded directly on a rolling basis beginning in 2018.Footnote 7 Tweets were first downloaded using the V2 API endpoint and then later using the Academic Twitter API. For Facebook, posts were downloaded using the CrowdTangle Platform. For newsletters, data come from the publicly available www.DCInbox.com repository of email newsletters collected and cleaned by Cormack (Reference Cormack2017). For newsletters, the data are available dating back to 2010; in the case of Twitter/X and Facebook, the data are available dating back to 2009. The dataset currently spans through 2022, although we aim to make periodic future updates of the dataset to broaden the timespan and enable study of contemporary congressional communication.
Table 1 displays the total number of tweets, Facebook posts, and email newsletters included in the dataset, listed by biennial legislative session. In total, the data consist of 7,827,972 unique communications from 1,034 U.S. senators and representatives. As the table shows, the volume of online communication has grown, although some of the social media differences in the pre-2018 years may be due to the deletion of accounts. For Twitter and Facebook, the table thus displays lower bounds on the total number of users as well as tweets and posts from this time period. On the other hand, the number of tweets and posts from the median member has gone up considerably over this time period (over a fourfold increase for each social media platform), suggesting that the increase in social media usage over this time period is not merely an artifact of missing accounts.
Online Communication by Members of Congress (2009–22)

Table 1. Long description
The table is organized into six columns: Medium, Session, Years, Percent using, Number (Median member), and Number (Total).
* Tweets: Usage grew from 71,061 total tweets in the 111th session (2009-10) to 1,100,253 in the 117th session (2021-22). The percentage of members using Twitter increased from 82.0 percent in the 112th session to 97.8 percent in the 117th. The median member's tweet count rose from 444.0 to 1,676.0 in that same period.
* Facebook posts: Total posts increased from 42,669 in the 111th session to 677,376 in the 117th. Adoption rose from 69.3 percent of members in the 112th session to 96.9 percent in the 117th. The median member's post count grew from 187.5 to 1,061.5.
* Newsletters: Total newsletters rose from 8,076 in the 111th session to a peak of 30,406 in the 116th session, before slightly declining to 29,383 in the 117th. Adoption remained high and relatively stable, starting at 88.8 percent in the 112th session and ending at 88.5 percent in the 117th. The median member's newsletter count increased from 26.0 to 39.0.
Note: The table displays the usage of tweets, Facebook posts, and email newsletters by members of Congress in our dataset. Percent using and number by median member are excluded for the 111th session, as the data do not span the full session.
Data are available at Kistner et al. (Reference Kistner, Heseltine, Alvarez, Fitch, Lothamer and Simas2026).
Scaling Procedure
To scale speech as more or less partisan, we adopt the same general strategy as Gentzkow, Shapiro, and Taddy (Reference Gentzkow, Shapiro and Taddy2019), who measure partisanship in congressional floor speeches. Following their lead, we define speech as partisan on the basis of how strongly it identifies the party of the speaker. Extreme partisan speech is used almost exclusively by members of one or the other party, while moderate speech is used by both. For instance, an individual who uses terms such as “border crisis” when discussing immigration is likely to be a Republican, while the utterance of “pathway to citizenship” means the speaker is likely to be a Democrat.
We opt to scale speech partisanship rather than speech ideology because we view partisanship as a broader concept inclusive of more relevant features when evaluating rhetoric than ideology. Similar to Converse (Reference Converse and Apter1964), we conceptualize ideology as a set of co-occurring (i.e., constrained) issue beliefs. We conceptualize partisanship similar to how the Michigan School authors describe partisanship in Chapter 10 of The American Voter (Campbell et al. Reference Campbell, Converse, Miller and Stokes1960), which encompasses issue views but also friendliness or hostility to various political figures or socio-demographic groups. Partisan speech may include not just the discussion of policy issues, as in the examples in the prior paragraph, but also non-policy topics, such as individual politicians (e.g., “crooked Hillary”). In an era where certain members of Congress have chosen not to hire any policy staff so they can employ more communications staffers (Vesoulis Reference Vesoulis2021), it is necessary to measure members’ partisan positioning in a way that incorporates not just issue stances but also broader partisan language. Partisanship can also be inferred from the way in which politicians talk. In an era of increasing educational polarization (Grossmann and Hopkins Reference Grossmann and Hopkins2024), the degree of formality and refinement may provide important signals about how a politician presents themselves.
To estimate the partisanship of member language, a class affinity scaling model (Perry and Benoit Reference Perry and Benoit2017) is fit using the words contained in the tweets, Facebook posts, and newsletters members share. Though the party identification of the speaker is used in training the algorithm, the procedure is better described as scaling than supervised classification since it models speakers having a continuous affinity toward classes (e.g., parties) rather than simply predicting membership in a binary class.Footnote 8 The model is estimated separately for each session of Congress, to account for changes in the partisan valence of language over time.
In the model, affinity towards party (partisanship) is parameterized as
$ {\pi}_r\in [0,1] $
 , the probability that for any given token of speech
$ {W}_i $
 the underlying orientation of the speaker is
$ {U}_i=r $
 , or Republican. The probability that the speaker’s underlying orientation is Democratic (
$ {U}_i=d) $
 for a given token of speech is thus
$ 1-{\pi}_r $
 . The orientation of a speaker for each token
$ i=1,\dots, n $
 determines the probability of a specific word w being used:

The partisanship for any given tweet, Facebook post, or newsletter is the expected proportion of time the underlying orientation is r versus d, which can be calculated as
$ {\pi}_r=\unicode{x1D53C}\left\{\right.\frac{1}{n}{\sum}_{i=1}^n{U}_i=r\left\}\right. $
 . For interpretability sake, we rescale the resulting probability so it ranges from
$ -1 $
 (most Democrat-leaning) to 0 (neutral partisanship) to 1 (most Republican-leaning), calculated as
$ 2{\pi}_r-1 $
 . This rescaling we refer to as the Text Partisanship Score. This measure can be folded, that is,
$ |2{\pi}_r-1|\in [0,1] $
 , so that higher values indicate more extreme partisan rhetoric regardless of the speaker’s party. This measure we refer to as the Text Partisan Extremity Score.
We validate our Text Partisanship Scores in several ways. First, we aggregate the text-level scores by taking the average for each member of Congress in our dataset and compare our scores to four other common measures of positioning by members of Congress: DW-NOMINATE (Poole and Rosenthal Reference Poole and Rosenthal2000) based on members’ roll call votes, CF scores (Bonica Reference Bonica2014) based on members’ fundraising, platform positions (Meisels Reference Meisels2026) based on issue statements on members’ websites, and presidential support scores (Edwards Reference Edwards1985), based on how frequently members vote for or against the stated preferences of a co-partisan or opposite-party president.Footnote 9
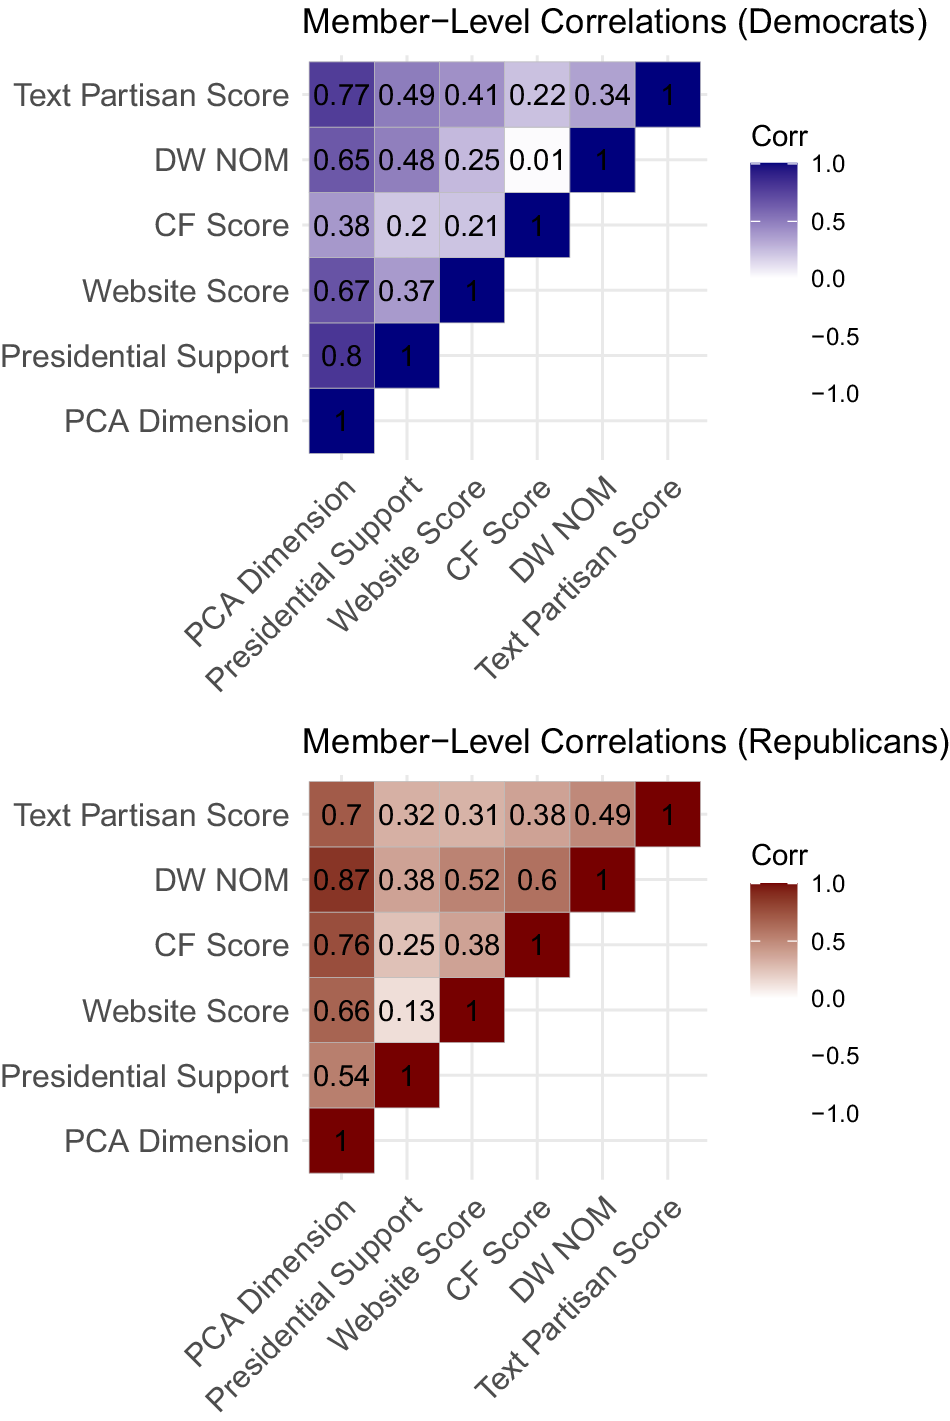
Figure 2 compares the within-party correlations of our aggregated Text Partisanship Scores with these four alternatives, as well as a composite positioning dimension constructed by applying principal components analysis to all of the measures and extracting the dimension which explains the most variance.Footnote
10 Each of these measures captures member positioning along a different domain, and though there should be shared patterns there will also be domain-specific differences. As Tausanovitch and Warshaw (Reference Tausanovitch and Warshaw2017) describe in their comparison of different ideology estimation procedures, “existing measures do not measure the same underlying dimension
$ \dots $
 The performance of these measures varies across parties, with no measure clearly dominant” (183).Footnote
11
Comparing Text Partisanship Scores to Existing Member Positioning Measures
Note: The figure displays the within-party member-level correlations between our partisanship measure (text partisan score) and other commonly-used measures of member ideology and partisanship. Numbers and shading of each cell show the Pearson correlation.

Figure 2. Long description
A two-panel multi-plot displaying correlation matrices.
Top Panel: Member-Level Correlations (Democrats). The color scale ranges from white (0.0) to dark blue (1.0). The Y-axis lists measures from top to bottom: Text Partisan Score, D W N O M, C F Score, Website Score, Presidential Support, and P C A Dimension. The X-axis lists the same measures in reverse order from left to right.
* Text Partisan Score correlates with: P C A Dimension (0.77), Presidential Support (0.49), Website Score (0.41), C F Score (0.22), and D W N O M (0.34).
* D W N O M correlates with: P C A Dimension (0.65), Presidential Support (0.48), Website Score (0.25), and C F Score (0.01).
* C F Score correlates with: P C A Dimension (0.38), Presidential Support (0.2), and Website Score (0.21).
* Website Score correlates with: P C A Dimension (0.67) and Presidential Support (0.37).
* Presidential Support correlates with: P C A Dimension (0.8).
Bottom Panel: Member-Level Correlations (Republicans). The color scale ranges from white (0.0) to dark red (1.0).
* Text Partisan Score correlates with: P C A Dimension (0.7), Presidential Support (0.32), Website Score (0.31), C F Score (0.38), and D W N O M (0.49).
* D W N O M correlates with: P C A Dimension (0.87), Presidential Support (0.38), Website Score (0.52), and C F Score (0.6).
* C F Score correlates with: P C A Dimension (0.76), Presidential Support (0.25), and Website Score (0.38).
* Website Score correlates with: P C A Dimension (0.66) and Presidential Support (0.13).
* Presidential Support correlates with: P C A Dimension (0.54).
In both panels, the diagonal cells representing self-correlation are marked with 1 and the darkest shade.
As Figure 2 demonstrates, our Text Partisanship Scores are strongly correlated with the shared positioning dimension and substantially correlated with the individual positioning measures.Footnote 12 The first row of each plot shows the Pearson correlations between our member-level Text Partisanship Scores and each of the other measures. The first entry is the correlation between our scores and the common dimension uncovered via PCA. For both Democrats and Republicans, the correlation is moderately high both in absolute terms and relative to the other positioning measures. For Democrats, only the presidential support score has a slightly higher correlation (by 0.03). For Republicans, DW-NOMINATE and CF Scores correlate modestly higher with the shared dimension (by 0.17 and 0.06, respectively), but the Text Partisanship Score has a higher correlation with the shared dimension than either the website platform scores or the presidential support scores.
Our Text Partisanship Scores also correlate well with the individual measures themselves, ranging from 0.22 (with CF scores for Democrats) to 0.49 (DW-NOMINATE scores for Republicans). Notably, some of the non-Text Partisanship measures correlate much more weakly with the other individual measures, including a near-zero correlation between CF scores and DW-NOMINATE scores among congressional Democrats (for more on this, see Barber Reference Barber2022).
The Supplementary Material contains numerous other forms of validation. First, we consider how strongly our partisanship scores correlate with each other if we estimate member partisanship separately using each of the three communication types. As Figure C.1 in the Supplementary Material shows, these within-party correlations are quite high, ranging from 0.51 to 0.82. Second, using a random sample of 3,000 anonymized and human-coded messages, we compare the scalings produced by the class affinity model to human perceptions of the partisan orientation of the member. As Figure D.1 in the Supplementary Material shows, there is an almost linear relationship between these human perceptions and the scaling output. Third, we consider whether our scalings are reflective of observable changes in politicians’ orientations. In Section E of the Supplementary Material, we examine changes in our Text Partisanship Scores among members of Congress widely perceived to have evolving partisan loyalties during the time period of our scores. As the section documents, each member’s by-session Text Partisanship Score largely corresponds to public discussion of their changing partisan inclinations. Finally, to establish facial validity and provide researchers intuition as to what types of messages our scaling procedure associates with different positions, Figure F.1 in the Supplementary Material displays the top 20 words most strongly associated with being classified as Democratic rhetoric (a Text Partisanship Score of
$ -1 $
 to
$ -0.5 $
 ), Republican rhetoric (score of 0.5 to 1), or nonpartisan rhetoric (score of
$ -0.5 $
 to 0.5).
Classification Procedure
To classify messages into the six binary categories displayed in Figure 1, trained PhD-level researchers read and coded approximately 43,000 messages for binary membership (yes or no) into each of the categories. These messages were then used to train a series of transformer-based classification models (one for each category) using the BERTweet language model (Nguyen, Thanh, and Nguyen Reference Nguyen, Thanh, Nguyen, Liu and Schlangen2020), a RoBERTa variant pretrained on English-language tweets.Footnote 13 A comprehensive description of our manual annotation and algorithmic classification procedure is provided in Section G of the Supplementary Material.
Out-of-sample classification performance metrics for all platforms (accuracy, balanced accuracy, and macro F1) are displayed in Table G.1 in the Supplementary Material, while more detailed classification metrics are provided in Section H of the Supplementary Material. The macro F1 for each category of tweets ranged from 0.83 to 0.95, values indicating strong performance. Classifier performance on the Facebook data was substantively identical, with macro F1 scores ranging from 0.81 to 0.92. The models showed marginally weaker performance on the newsletter data, reflecting the more freeform nature of the text compared to social media, but still well within acceptable levels (macro F1 between 0.77 and 0.93).
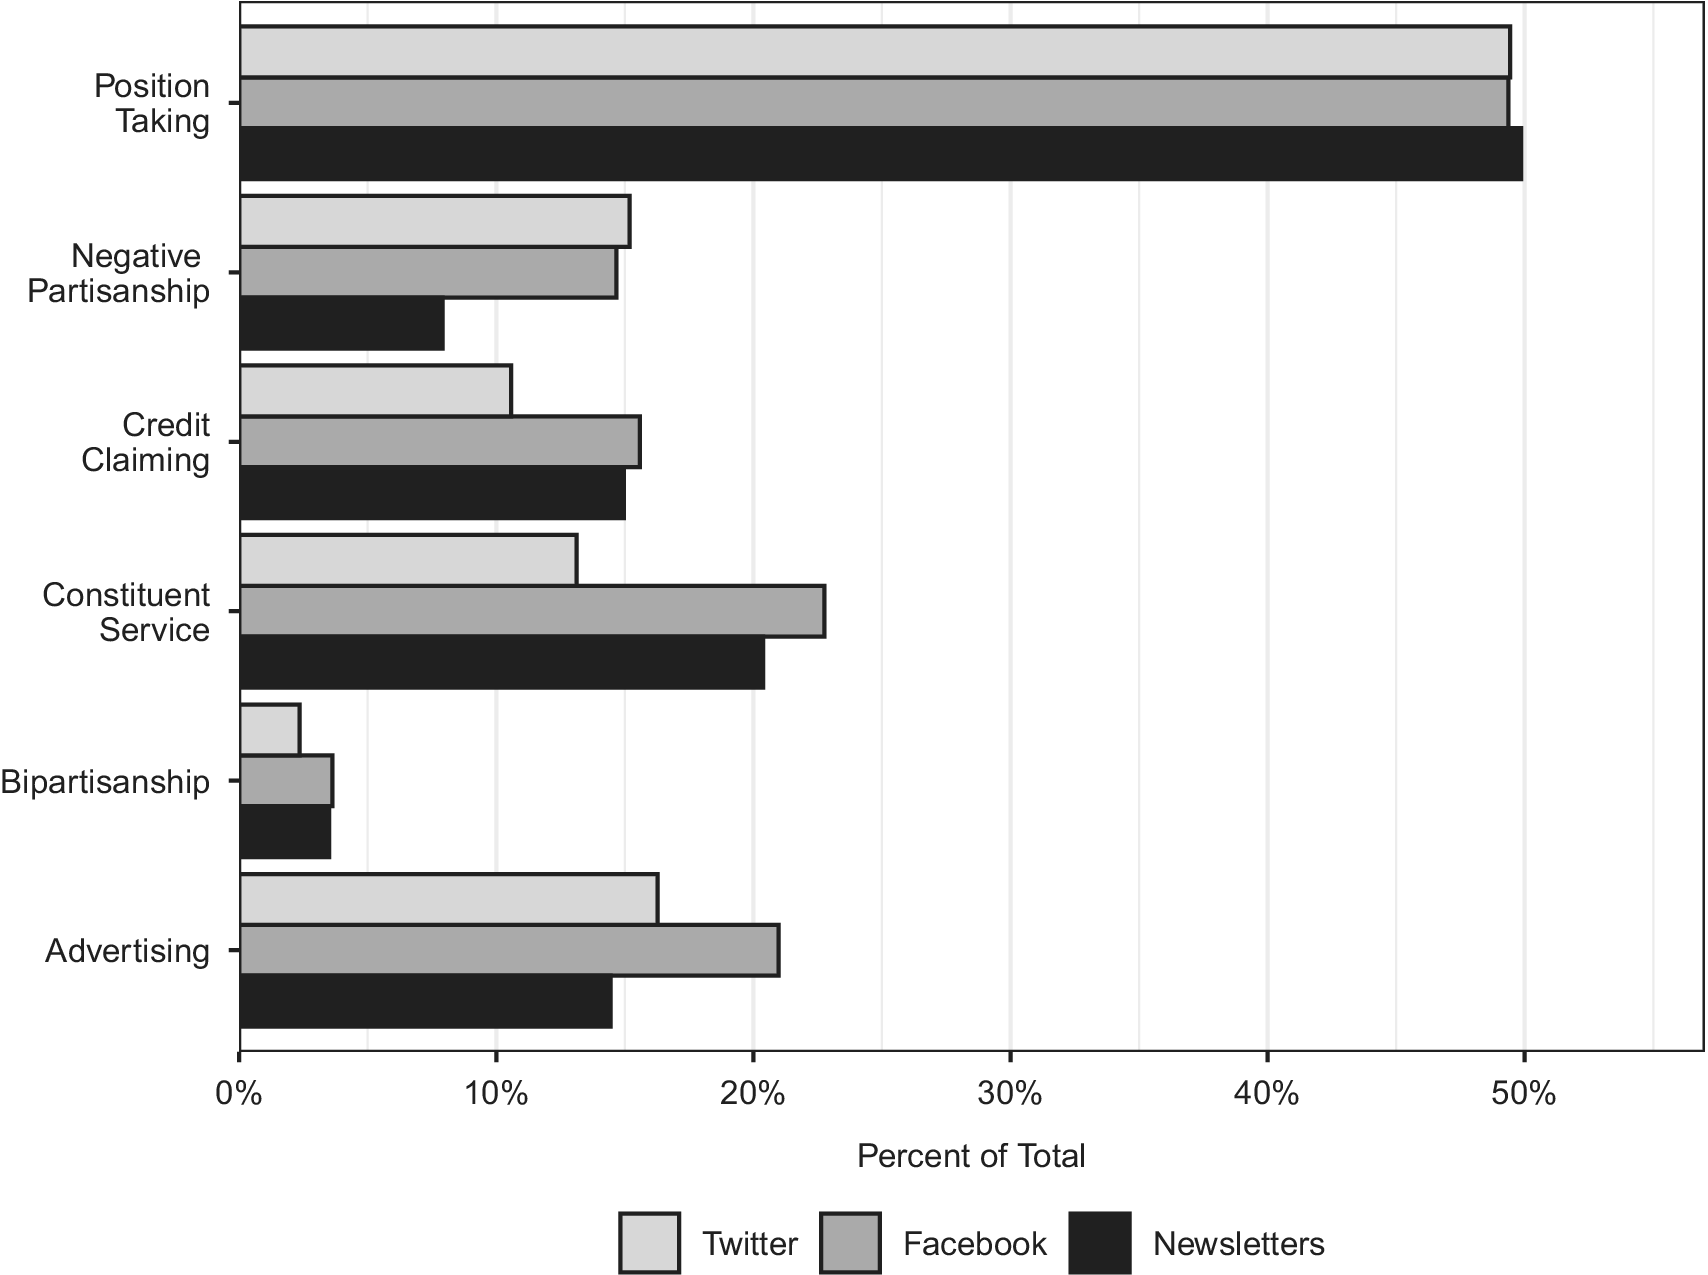
Figure 3 shows the percentage of all tweets, Facebook posts, and newsletter sentences that can be classified in each category. Across all data sources, position taking is by far the most common type of communication that we observe. This combined with the prevalence of advertising and credit claiming show that while congressional communication has changed, the basic framework of Fenno and Mayhew is still relevant and applicable today. Overall, 71% of all tweets, 76% of all Facebook posts, and 72% of all newsletter sentences can be classified into at least one of our six categories.
Frequency of Message Types, by Platform
Note: The figure uses bars to displays the percent of all tweets, Facebook posts, and newsletter sentences classified into each of the six main categories displayed in Figure 1 by the BERTweet models.

Figure 3. Long description
The horizontal bar chart uses the X-axis to measure the Percent of Total from 0 percent to 50 percent. The Y-axis lists six categories. Each category contains a cluster of three bars: light gray for Twitter, medium gray for Facebook, and black for Newsletters.
* Position Taking: All three platforms peak near 50 percent, with Newsletters slightly higher than Twitter and Facebook.
* Negative Partisanship: Twitter and Facebook are approximately 15 percent, while Newsletters are significantly lower at roughly 8 percent.
* Credit Claiming: Twitter is at 10 percent, while Facebook and Newsletters are higher at approximately 15 percent.
* Constituent Service: Facebook leads at 23 percent, followed by Newsletters at 20 percent, and Twitter at 13 percent.
* Bipartisanship: This is the lowest category for all platforms, with all bars under 5 percent.
* Advertising: Facebook leads at 23 percent, followed by Twitter at 16 percent, and Newsletters at 14 percent.
A legend at the bottom identifies the bar colors as Twitter, Facebook, and Newsletters from left to right.
Again, we validate the resulting classifications in multiple ways. First, we consider whether members’ messaging on social media and in email newsletters—as measured using our classifications—is related to their behavior in office. We collect data on three outcomes—the number of bills introduced by the member, the percent of bills cosponsored by the member that have an opposite-party sponsor, and the number of times they mention a local area in their district (a town, neighborhood, location, etc.) during floor speeches. The bill (co)sponsorship variables are downloaded directly from www.govtrack.us/congress/members/report-cards/, while the local mentions during floor speeches variable comes from Ban and Kaslovsky (Reference Ban and Kaslovsky2025).
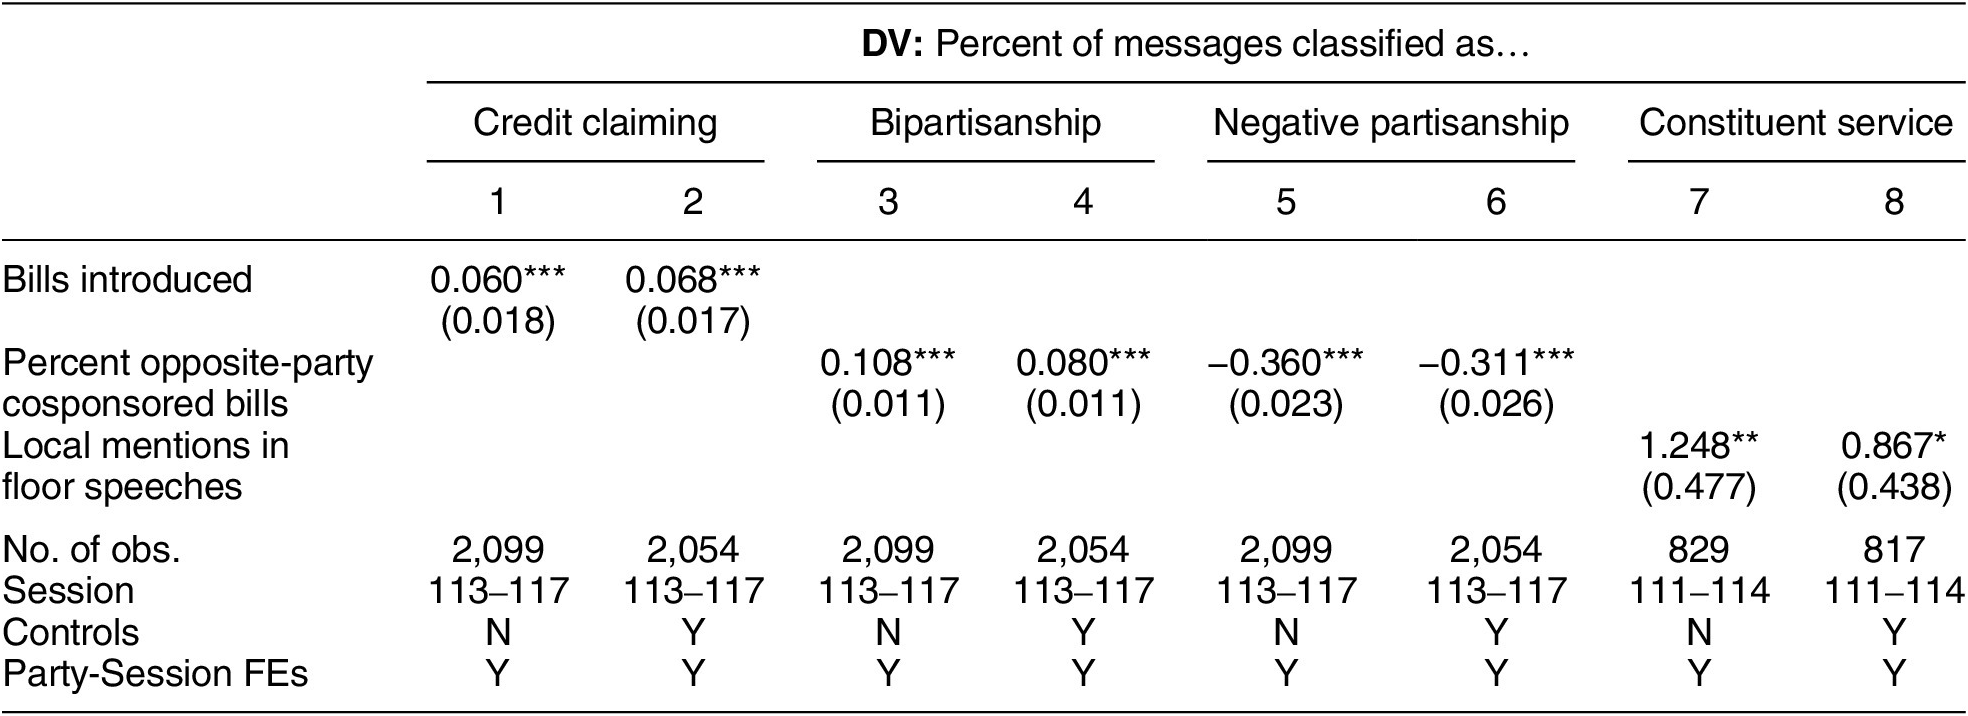
To evaluate whether these in-office behaviors predict messaging, we estimate a series of regression models with the behavioral measures as independent variables, and the percent of a member’s messages (aggregated across platforms) as the dependent variable. We expect members with more bill introductions to do more credit claiming; members with more cross-party cosponsorships to discuss bipartisanship more and make fewer negative partisan attacks; and members who mention localities in floor speeches to reference constituent service more often.
The results of these regression models are displayed in Table 2. For each of the expectations we test, we estimate two versions of the model, one with no control variables and one controlling for a variety of member characteristics as well as electoral and institutional contexts.Footnote 14 As the table shows, all expectations are borne out in the data. At least in aggregate, what members say is what members do.
Online Messaging and Behaviors in Congress

Table 2. Long description
A statistical table presenting O L S regression estimates. The dependent variable is the percent of messages classified into four categories across eight columns.
* Credit claiming (Columns 1 and 2): Bills introduced has a positive coefficient of 0.060 and 0.068, both significant at p less than 0.001.
* Bipartisanship (Columns 3 and 4): Percent opposite-party cosponsored bills has a positive coefficient of 0.108 and 0.080, both significant at p less than 0.001.
* Negative partisanship (Columns 5 and 6): Percent opposite-party cosponsored bills has a negative coefficient of minus 0.360 and minus 0.311, both significant at p less than 0.001.
* Constituent service (Columns 7 and 8): Local mentions in floor speeches has a positive coefficient of 1.248 (p less than 0.01) and 0.867 (p less than 0.05).
Model details include:
* Number of observations: Ranges from 2,099 for most models to 817 for constituent service.
* Sessions: 113 to 117 for the first six columns; 111 to 114 for the last two.
* Controls: Alternates between No (N) and Yes (Y) across odd and even columns.
* Party-session F E s: Included (Y) for all models.
* Standard errors are clustered by member and shown in parentheses below coefficients.
Note: Estimates are from OLS regression models. Standard errors are clustered by member. *
$ p<0.05 $
 , **
$ p<0.01 $
 , and ***
$ p<0.001 $
 .
As with the scaling, we also establish the facial validity of our classifications by creating keyword plots, showing which words are most strongly associated with classification into each of the six categories. Figure F.2 in the Supplementary Material shows the top 20 words for each category. The words in each category accord with expectations. For example, constituency service messages are associated with words that imply district visits (“town,” “hall,” and “meeting”), aiding constituents (“assistance” and “constituents”), and securing money for local projects (“funding” and “grant”). Similarly, messages that attack the other party feature the names of top leaders of each party (“trump,” “biden,” and “pelosi”) or divisive issues (“obamacare” and “border”).
THE EVOLUTION OF ONLINE CONGRESSIONAL COMMUNICATION
With our new data, the first question we consider is how congressional rhetoric evolved in the age of social media. Has messaging on social media and in newsletters become more polarized? In other domains, such as roll call voting, the congressional parties have been polarizing for decades (Poole and Rosenthal Reference Poole and Rosenthal2000). In our communication-focused context, a growth in polarization would mean that Democrats and Republicans speak in increasingly different ways. There would be a divergence in the issues, people, and groups they discuss as well the words they use to describe them, focusing on partisan topics more and nonpartisan topics (e.g., helping constituents and advertising appearances back home) less.
To evaluate trends in partisan rhetoric across time, Figure 4 plots the average Partisan Extremity Score by calendar day for all three forms of communication and each of the two major political parties across all sessions of Congress for which we have full data (the 112th to 117th Congresses). A smoothed GAM regression line is fit to each of the time series, to flexibly capture changes across the period.
Partisan Speech in Congressional Social Media and Newsletters (2011–22)
Note: The figure displays the daily average text partisanship score for tweets, Facebook posts, and newsletter sentence bigrams (higher values indicate more Republican rhetoric). Dark lines indicate smoothed GAM regression lines of best fit. Trends shown separately for Democrats (blue; endpoints denoted with circles) and Republicans (red; endpoints denoted with triangles). Numbers denote the average text partisanship score at the beginning and end of each trendline.

Figure 4. Long description
A multi-panel line graph with three vertical panels labeled Twitter, Facebook, and Newsletters. The y-axis represents Average Text Partisanship Score ranging from negative 0.5 to 0.5. The x-axis represents years from 2011 to 2023. Each panel contains two smoothed G A M regression lines: a blue line for Democrats and a red line for Republicans, overlaid on lighter, high-frequency daily data.
* Twitter Panel: The Republican line starts at 0.09 in 2011 and rises to 0.38 by 2023. The Democratic line starts at negative 0.37 and ends at negative 0.39, remaining relatively flat with minor fluctuations.
* Facebook Panel: The Republican line starts at 0.17 and rises to 0.38. The Democratic line starts at negative 0.37 and ends at negative 0.42.
* Newsletters Panel: The Republican line starts at 0.27 and rises to 0.53. The Democratic line starts at negative 0.28 and ends at negative 0.29, showing a notable peak around 2019 before returning to its baseline.
In all panels, the gap between the red and blue lines widens over time, indicating increased partisan divergence in rhetoric.
As can be seen in Figure 4, the partisan divide in congressional rhetoric has grown steadily over this time period across all three forms of communication studied. In 2011, the difference between the language used by Republicans and Democrats on social media was modest, ranging from 0.46 points on the 2-point scale (on Twitter) to 0.55 points (newsletters). By the end of 2022, the difference had almost doubled, ranging from 0.77 points (on Twitter) to 0.82 points (newsletters).
One noteworthy feature of this polarization in congressional rhetoric is that the growth in partisanship is disproportionately driven by Republicans. On the two social media platforms, the partisanship of Democratic speech is mostly flat across this time period, increasing only very slightly. In newsletters, there’s a brief period of depolarization from the 113th session of Congress to the 116th session of Congress.
How do these trends in partisan rhetoric compare to other forms of polarization? To answer this question, we estimate a series of regression models comparing trends in rhetorical polarization to polarization measured using roll call votes and campaign contributions. For rhetorical polarization, we use the member-session level Text Partisan Extremity Score described above, aggregated across all three communication platforms. For roll call polarization, we use (folded) Nokken–Poole scores, a dynamic version of the DW-NOMINATE scores that allows for more sudden change in member ideology than DW-NOMINATE scores themselves do (Nokken and Poole Reference Nokken and Poole2004). For campaign contribution polarization, we use (folded) dynamic CF scores (Bonica Reference Bonica2014).
Using these three extremity variables, we estimate within-party OLS regression models of the following form:

where i indexes members and t sessions. To make the results more directly interpretable, Session is recentered so the first session in our analysis (the 112th) is coded as 0 (and the 113th as 1, the 114th as 2, and so on), and the dependent variable is rescaled by dividing by the standard deviation of the extremity measure in the first session. Doing so means the coefficient (
$ \beta $
 ) on the recentered session variable represents the average per-session change in extremity as measured in units of the within-party SD during the first session. As the independent variable is measured at the session-level, we control for two party-session confounding variables: whether the member’s party is in the majority in their chamber, and whether there is a co-partisan president. Standard errors are clustered at the member level.
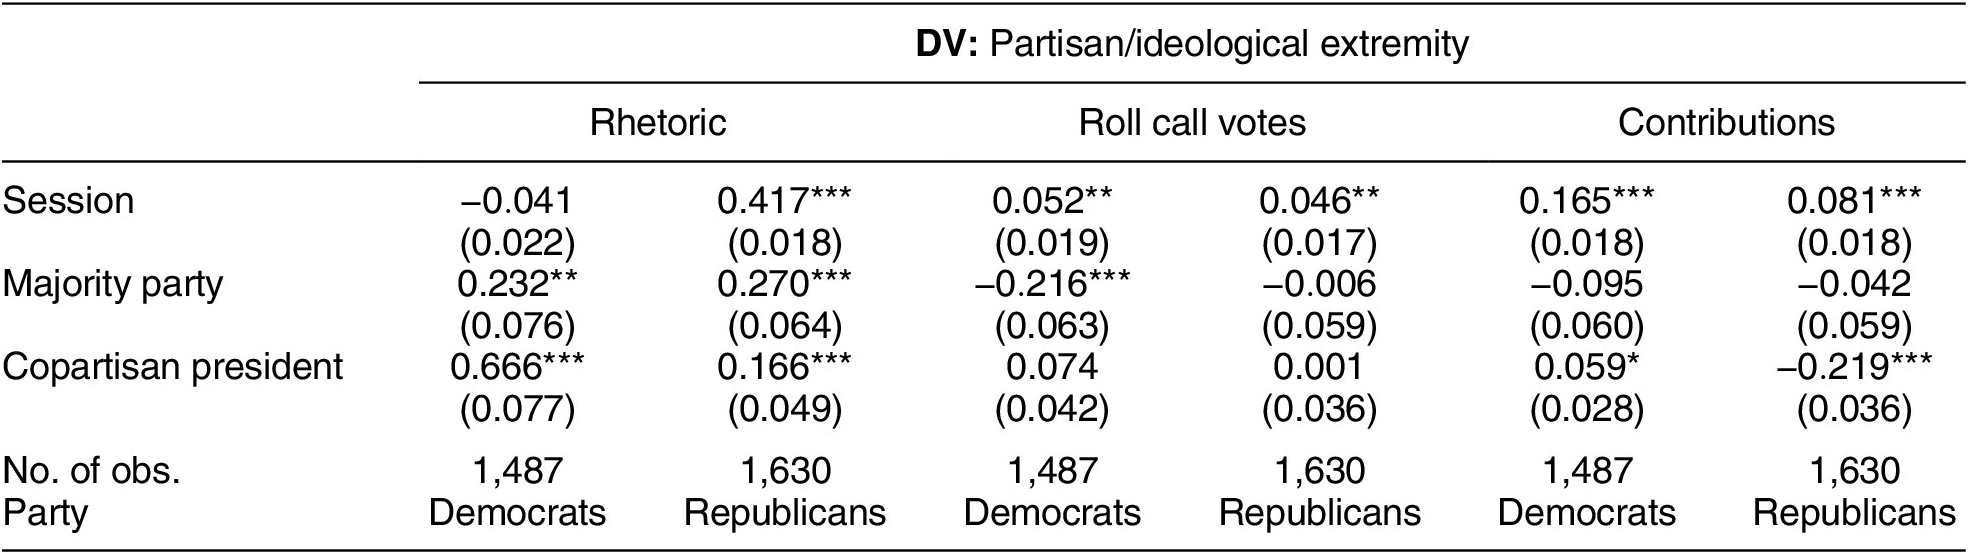
The results are shown in Table 3. The first two columns show the estimates for our Text Partisan Extremity Measure for Democrats and Republicans, respectively. After aggregation and including the control variables, there is no statistically significant trend in partisan rhetoric for Democrats. On the other hand, there is a large and significant increase for Republicans. The estimate suggests that partisanship increased by approximately 0.42 standard deviations per session, implying that by the final session in our data (2021–22), the average Republican was nearly 2.1 standard deviations more partisan than the average Republican a decade earlier (2011–12).Footnote 15 This partisan asymmetry mirrors the conclusions of Heseltine (Reference Heseltine2023), which finds more polarization on social media by Republican members of Congress, as measured by the external news organizations they reference or link to in their tweets and posts.
Comparing Polarization in Rhetoric to Alternative Forms

Table 3. Long description
The table presents O L S regression estimates for the dependent variable D V partisan or ideological extremity. It is divided into three main categories, each with two columns for Democrats and Republicans respectively.
1. Rhetoric.
- Session: -0.041 for Democrats and 0.417*** for Republicans.
- Majority party: 0.232** for Democrats and 0.270*** for Republicans.
- Copartisan president: 0.666*** for Democrats and 0.166*** for Republicans.
- Number of observations: 1,487 for Democrats and 1,630 for Republicans.
2. Roll call votes.
- Session: 0.052** for Democrats and 0.046** for Republicans.
- Majority party: -0.216*** for Democrats and -0.006 for Republicans.
- Copartisan president: 0.074 for Democrats and 0.001 for Republicans.
- Number of observations: 1,487 for Democrats and 1,630 for Republicans.
3. Contributions.
- Session: 0.165*** for Democrats and 0.081*** for Republicans.
- Majority party: -0.095 for Democrats and -0.042 for Republicans.
- Copartisan president: 0.059* for Democrats and -0.219*** for Republicans.
- Number of observations: 1,487 for Democrats and 1,630 for Republicans.
Standard errors are provided in parentheses below each estimate. Significance levels are indicated by asterisks: * p < 0.05, ** p < 0.01, and *** p < 0.001.
Note: Estimates are from OLS regression models. Standard errors are clustered by member. *
$ p<0.05 $
 , **
$ p<0.01 $
 , and ***
$ p<0.001 $
 .
Notably, however, the trends are different when compared to polarization in roll call voting or in campaign contributions. Columns 3 and 4 of Table 3 show roll call voting polarization increased for both Democrats and Republicans during this time period, but very modestly, a small fraction of the within-party standard deviation at the beginning of the 2010s. Columns 5 and 6 of Table 3 show slightly more polarization in campaign contribution patterns during this time period, with Democrats polarizing more quickly than Republicans. In none of these regressions does polarization increase as rapidly as it does for Republicans in the rhetoric they use on social media and newsletters over this time period.
In the Supplementary Material, we examine the robustness of our rhetorical polarization findings in two ways. First, we consider whether the results replicate if we use a different scaling procedure than the Class Affinity scaling model. In Section K of the Supplementary Material, we rescale the data using the Naive Bayes approach, which produced the next strongest within-party correlations with the non-text positioning measures, such as DW-NOMINATE and CFscores (as discussed in Section B of the Supplementary Material). We then estimate identical regression models as in Table 3 and Table J.1 in the Supplementary Material. The results are shown in Table K.1 in the Supplementary Material. When using this measure instead, there is significant evidence of growing partisanship in Democratic rhetoric as well as Republican rhetoric. However, even in these estimates, Republican rhetoric polarizes approximately twice as much over the same time period.
Additionally, in Section L of the Supplementary Material, we provide a non-model-based examination of changes in partisan rhetoric across time by plotting the top 20 words that increased or decreased the most in usage between the 112th and the 117th session of Congress, separately for Democrats and Republicans. As can be seen in Figure L.1 in the Supplementary Material, the word changes are suggestive of a shift from routine governance to partisan conflict for both major parties. Democrats increased their emphasis on progressive policy priorities with words like “climate,” “gun,” “democracy,” and “infrastructure” becoming more common, while decreasing references to procedural governance terms like “veteran,” “district,” “medicare,” and “budget.” Republicans also show an even more pronounced shift toward combative, identity-focused rhetoric, with large increases in “border,” “illegal,” “polic,” and “china,” while dropping more traditional policy language like “regulation,” “business,” “tax,” and “spending.” The overall pattern indicates a transformation from governance-focused communication towards more polarized, emotionally charged messaging, with Democrats pivoting to progressive social causes and Republicans to immigration-focused cultural warfare and attacks on the opposing party.
In addition to examining the partisan orientation of speech, we can also examine trends in the six categories of messages displayed in Figure 1. To accomplish this, Figure 5 shows quarterly averages in the percent of messages classified as Negative Partisan, Bipartisan, Advertising, Credit Claiming, Position Taking, and Constituent Service, separated for each of the three platforms.
Trends in Partisan and Representational Categories (2011–22)
Note: The figure displays trends in the quarterly averages of the two partisan and four representational categories trends described above, displayed separately for each type of communication between 2011 and 2022.

Figure 5. Long description
A multi-panel line graph with six panels arranged in two columns and three rows. The x-axis for all panels represents years from 2011 to 2022. The y-axis represents Percent, with varying scales per panel. A legend at the bottom identifies three modes: Facebook (solid line), Newsletters (dotted line), and Twitter (dashed line).
* Top-Left Panel: Negative Partisan. Y-axis 5% to 25%. Facebook and Twitter show a sharp increase around 2017, fluctuating between 15% and 20% thereafter. Newsletters remain lower, generally under 15%.
* Top-Right Panel: Position Taking. Y-axis 30% to 60%. All three modes show high volatility. Facebook and Twitter generally stay between 40% and 60%, while Newsletters fluctuate between 30% and 55%.
* Middle-Left Panel: Advertising. Y-axis 10% to 35%. Facebook and Twitter show a steady linear decrease from roughly 30-35% in 2011 to 15% in 2022. Newsletters remain relatively flat between 10% and 15%.
* Middle-Right Panel: Credit Claiming. Y-axis 5% to 15%. Facebook and Twitter show a gradual increase over time. Newsletters show a significant upward trend starting in 2018, rising from 7% to nearly 15%.
* Bottom-Left Panel: Bipartisan. Y-axis 1% to 6%. All modes show an upward trend with high volatility. Facebook peaks near 5.5% in 2022. Twitter and Newsletters follow a similar rising trajectory from 1% to roughly 4%.
* Bottom-Right Panel: Constituent Service. Y-axis 10% to 30%. Facebook shows a peak around 30% in 2016-2017 before declining. Newsletters show a sharp peak over 30% in 2020. Twitter remains the lowest and most stable, fluctuating between 10% and 15%.
Two trends worth remarking on, given their relevance to the partisanship trends discussed already, are sizable increases in both Negative Partisan attacks and Position Taking messages. Negative Partisan attacks represent approximately 5%–10% of messages during the initial years of the time series, but increase to 15%–20% by the end of the time period, with a particularly sharp increase toward the end of 2016.Footnote 16 Similarly, position taking comprises between 40% and 55% of messages at the beginning of the time series, but increases to 55%–60% by the end of 2022.
Figure M.1 in the Supplementary Material replicates Figure 5 but displays category trends for each of the two major parties (aggregated across communication platforms). The figure reveals interesting heterogeneity by party. Most notably, the stark increase in Negative Partisan attacks after 2016 is driven by congressional Democrats, most likely in direct response to the election of Republican Donald Trump to the presidency. There is a similar increase in Negative Partisan attacks by Republicans following the election of Democrat Joe Biden. Notably though, even after accounting for factors such as a cross-party president the across time trends still hold. Republicans engage in much higher levels of Negative Partisanship during the Biden presidency compared to the earlier Obama presidency years, for example.
THE SOCIAL MEDIA FEEDBACK MIRAGE
In this section, we explore one possible explanation for the increase in partisanship, negativity, and position-taking in online rhetoric during this time period: differential engagement by message type on social media. Prior research has found that incivility or negativity on social media leads to more engagement in more limited data (Ballard et al. Reference Ballard, DeTamble, Dorsey, Heseltine and Johnson2022; Macdonald, Russell, and Hua Reference Macdonald, Russell and Hua2023; Yu, Wojcieszak, and Casas Reference Yu, Wojcieszak and Casas2024). We replicate and extend this research, examining engagement as a function of partisan extremity and our six purposive categorizations on both Facebook and Twitter across a 14-year period.
An advantage of the social media data is that posts and tweets contain information about public engagement in the form of likes, shares, retweets, and other metrics. These metrics represent the information members and their staff receive in real time, showing how followers respond to the messages they share. In the case of communications staffers who often run these social media accounts, increasing engagement and the number of followers is often a component of how their performance is evaluated. Given these incentives, it is important to consider which types of messages receive the most attention (particularly positive attention) on social media.
To determine which characteristics of messages in our data receive this attention, we estimate a series of OLS regression models where the unit of observation is an individual tweet or post. For each message, we include six binary variables for whether the message is classified into each of our categories, as well as the continuous (0–1) Text Partisan Extremity Score. The dependent variable is the number of likes, retweets/shares, or replies/comments the message received (logged to address right-skew). Regressions include member-session fixed effects. As a consequence of the fixed effect log-DV specification, coefficients can be interpreted as the percent difference in expected likes or retweets relative to the average tweet or post by a member.
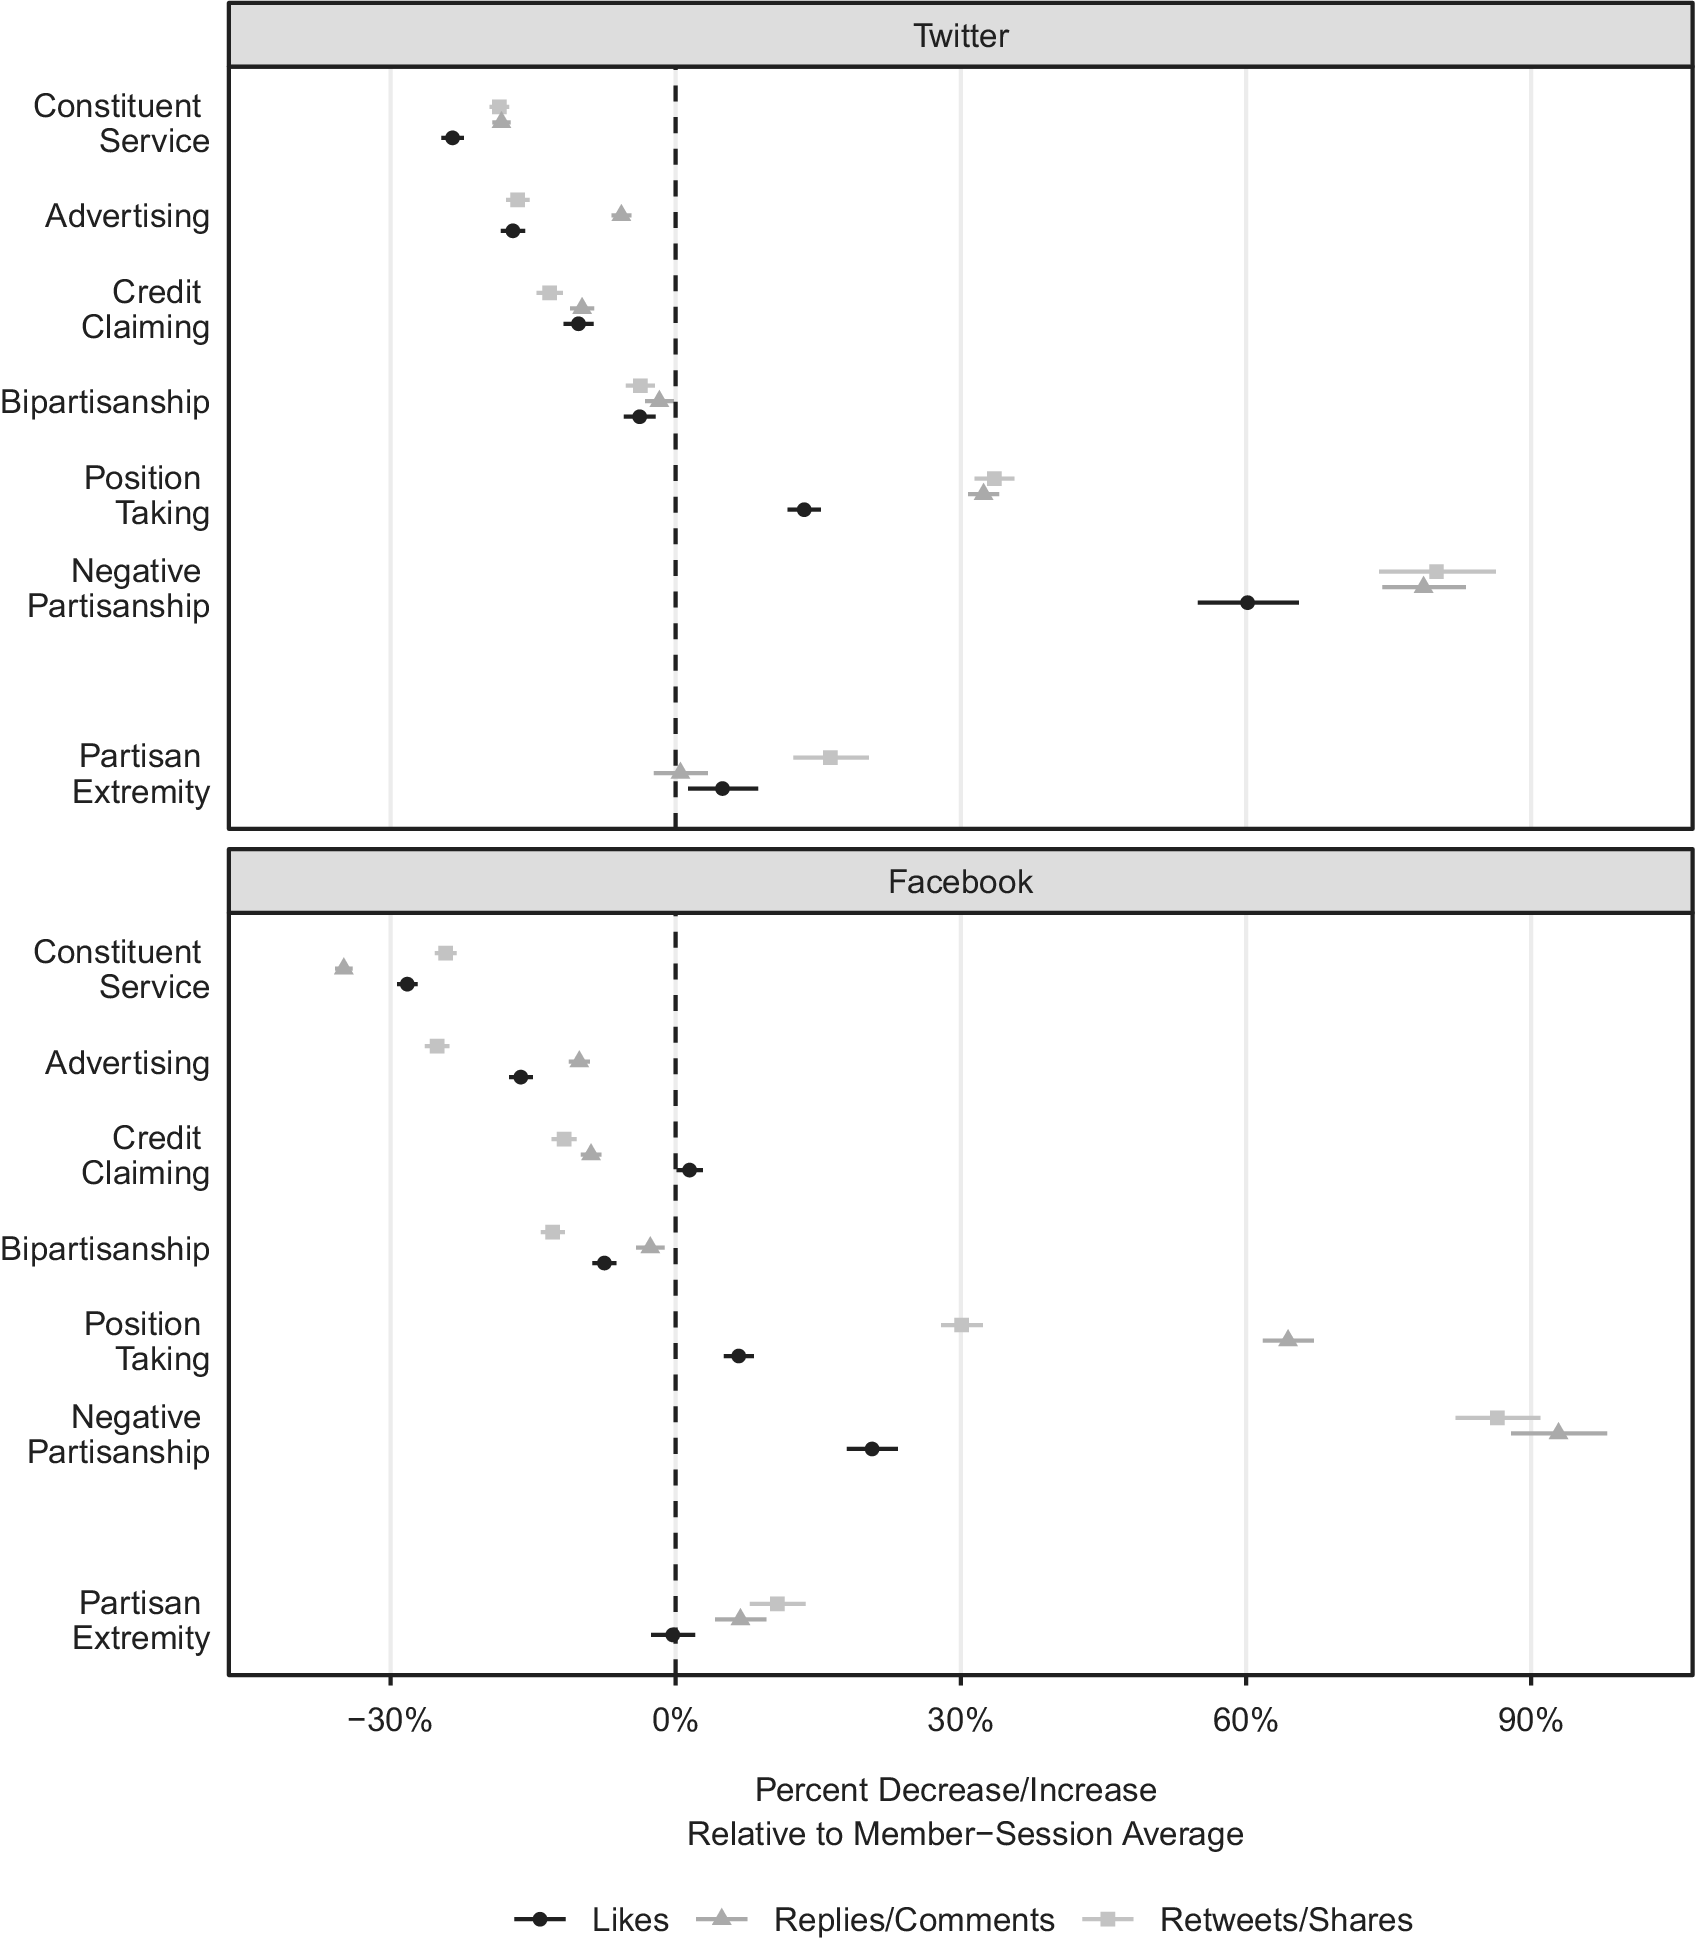
The results are displayed in Figure 6. The figure shows clear differences in engagement across message types. The most striking pattern is the high levels of engagement that negative partisan messages receive. Negative partisan attacks on Twitter receive 60% more likes, 80% more retweets, and 79% more replies than a member’s average tweet. Similarly, negative partisan attacks on Facebook receive 21% more likes, 86% more shares, and 93% more comments than a member’s average Facebook post.
Social Media Message Content and User Engagement
Note: The figure displays OLS coefficient estimates and 95% confidence intervals for member-session fixed effects models where the dependent variables are the social media engagement metrics shown in the legend at bottom. Independent variables are message characteristics shown on the y-axis. Coefficient estimates are transformed (exp(
$ \widehat{\beta})-1 $
 ) to percent differences for interpretability; transformed coefficients thus represent engagement relative to a member’s average in a given session of Congress. Standard errors are clustered by member. Full regression results shown in Table I.2 in the Supplementary Material.

Figure 6. Long description
A two-panel coefficient plot comparing Twitter (top) and Facebook (bottom). The X-axis represents the percent decrease or increase relative to a member-session average, ranging from negative 30 percent to 90 percent. A vertical dashed line marks the zero-percent baseline. The Y-axis lists seven message characteristics: Constituent Service, Advertising, Credit Claiming, Bipartisanship, Position Taking, Negative Partisanship, and Partisan Extremity. Data points include Likes (black circles), Replies or Comments (dark gray triangles), and Retweets or Shares (light gray squares), each with horizontal 95 percent confidence interval bars.
In the Twitter panel:
* Constituent Service, Advertising, Credit Claiming, and Bipartisanship show negative engagement, clustered between negative 30 percent and 0 percent.
* Position Taking shows a positive increase of approximately 15 percent for Likes and 35 percent for Retweets.
* Negative Partisanship shows the highest engagement, with Likes at 60 percent and Retweets or Shares near 85 percent.
* Partisan Extremity is near the zero baseline for Likes and slightly positive for Retweets.
In the Facebook panel:
* Constituent Service, Advertising, and Bipartisanship show negative engagement between negative 35 percent and 0 percent.
* Credit Claiming is near zero for Likes but negative for other metrics.
* Position Taking shows a 10 percent increase for Likes and a 65 percent increase for Comments.
* Negative Partisanship shows extreme positive engagement, with Likes at 20 percent and Comments or Shares between 85 percent and 95 percent.
* Partisan Extremity shows a slight positive increase of approximately 10 percent across all metrics.
Generally speaking, there are three types of messages that receive higher levels of engagement: negative messages, more partisan messages, and position-taking. In contrast, the other four types of messages (constituent service, advertising, credit claiming, and bipartisanship) receive less engagement than the typical social media message for a particular member.
Does this differential reception by social media users matter? There are at least two reasons it might. One is if members mistake engagement on social media with the preferences of voters and other key constituencies they care about. In general, survey and experimental studies find opposite patterns. Respondents report approving more highly of a hypothetical representative when they describe their accomplishments in office (credit claiming) versus attacking the other party (e.g., Barron and McLaughlin Reference Barron and McLaughlin2024; Costa Reference Costa2021; Simas et al. Reference Simas, Hilden, Kistner and Wright2025). Social media thus threatens to provide members a misleading impression about what constituents want out of their representatives if members use social media engagement to provide feedback on what resonates with potential voters. This illusory mismatch between the messaging voters prefer and the messaging that attracts engagement online might be called a “social media feedback mirage.” Whether elected officials draw information from social media engagement in this manner or not is an open question, one that future research should pursue.
A second reason this distortion might matter is if the political discourse of the mass public is influenced by the conversations of political elites on social media. The extent to which public rhetoric follows elite rhetoric and vice-versa is an area of active debate in political science and the broader communication literature (e.g., Barberá et al. Reference Barberá, Casas, Nagler, Egan, Bonneau, Jost and Tucker2019; Smith et al. Reference Smith, Green, Welles and Lazer2025; Warner Reference Warner2023; Zoizner and Levy Reference Zoizner and Levy2025). Despite this, some degree of influence by elites on mass opinion is a longstanding axiom of political science (Lippmann Reference Lippmann1922; Jacobs and Shapiro Reference Jacobs and Shapiro2000; Zaller Reference Zaller1992). To the extent that politicians emphasize divisive messages on social media because they garner attention (or equivalently, to the extent that algorithms prioritize such messages), the downstream consequences are likely a shifting of the way members of the public think about and debate politics.
CONCLUSION
Communications from elected officials both facilitate effective representation (e.g., Pitkin Reference Pitkin1967) and shape the subject and tenor of public conversation. As such, studying the content of those communications is central to numerous strands of the political science literature. Work in this area has attempted to keep pace with the changes that have come with the wide-spread adoption of online communications, but efforts have been hampered by the challenge of collecting such large volumes of data over time and across platforms. Our SCCC dataset, spanning approximately 4.7 million tweets, 2.4 million Facebook posts, and 184,000 email newsletters authored by members of Congress between 2009 and 2022, helps advance study in this area in several ways. The size and scope of this dataset not only resolve practical issues related to data collection, but also allow for more comprehensive investigations of how communications change over time and vary across modes. Moreover, the coding of both purpose and partisanship allows for more precise estimates of the effects of the various components of online messages. Altogether, the SCCC is one of the most comprehensive resources available for studying how characteristics of politicians’ rhetoric affect a host of key political outcomes.
Indeed, the applications presented here demonstrate the vast potential of this dataset to make contributions beyond just the more focused study of online congressional communications. Our findings that negative and partisan messages are increasingly prevalent and attention-grabbing speak to work on polarization. They also raise interesting questions for further study. Namely, why has online communication grown and evolved to be more partisan in nature when considerable evidence suggests that there are no apparent payoffs from voters? While some of this may be due to disconnect between the feedback received from social media users versus direct constituents (i.e., the social media feedback mirage), it seems unlikely that savvy politicians would continue to pursue strategies that do not help and possibly hinder their goals in some form. The obvious conclusion is that more work is needed to gain a complete understanding of the motivations behind and consequences of politicians’ communications.
It should also not be lost that while a major strength of our approach is that it offers estimates of both style and partisanship, the partisan ratings alone are an extremely valuable tool for approximating legislators’ positions, in some cases providing more facially valid and/or informative estimates than alternatives such as DW-NOMINATE. For one, the two widely used measures of legislative positioning we compare our measures to above are derived from legislative voting and fundraising. Though the public has access to records of both, the majority of individuals lack knowledge about their representatives’ activities in these areas. Our ratings, in contrast, are derived from visible and easily accessible communications that are crafted to portray a legislator as they want to be seen. So when used in combination with these other types of measures, our partisan scaling has the potential to offer a fuller picture of legislators’ preferences and speak to questions of whether those preferences appear relatively consistent when estimated from these different sources.
In addition, there is ample evidence that partisan rhetoric has a significant influence on the thoughts and actions of the public, as partisans can be both swayed by their own party and repelled by the opposite (e.g., Nelson Reference Nelson2004; Pink et al. Reference Pink, Chu, Druckman, Rand and Willer2021; Slothuus and Bisgaard Reference Slothuus and Bisgaard2021). Having measures of the strength of the partisanship in representatives’ messages can thus offer greater insight into the parties’ powers to persuade and the downstream consequences of increasingly polarized communications.
Our dataset, as currently constructed, ends in 2022. In the very short time since then, social media usage by politicians has continued to evolve. One of the most notable examples is the rise of new social media platforms that are associated with particular points on the ideological spectrum: Truth Social and Bluesky. But our August 2025 search found that while all sitting members of the House and Senate have an X/Twitter account and 99% have a Facebook account, only 46% have an account on Bluesky and only 20% have an account on Truth Social. Moreover, Figure N.1 in the Supplementary Material shows that almost all members have a link to their Facebook and/or Twitter/X account on the homepage of their official website. And 92% of members had a link or pop-up prompting individuals to signup for their newsletters. Thus, it appears that (1) accounts on alternate platforms are coming in addition to and not in replacement of Facebook and/or Twitter/X and (2) Facebook, Twitter/X, and newsletters are still the three dominant forms of communication that members of Congress are pushing their constituents to follow.Footnote 17
Even so, it is possible that we will continue to observe even more fractionalization, with politically-oriented media consumers choosing platforms that cater in a focused way to their tastes. On the other hand, even among the population of social media users most do not follow their representatives on social media (McCabe et al. Reference McCabe, Green, Goel and Lazer2023), perhaps limiting the impact of this type of political Balkanization. A clear path forward for scholars of political communication, then, is unpacking the effects these new platforms have on rhetoric and discourse. The large percentages of members with linked YouTube and Instagram accounts suggest that shifting study to more visual communication may be particularly fruitful.
Explorations of more visual forms of communication may also help with the continued evolution of the typology of messages. We take the fact that over 70% of communications can be classified into one of our six categories as evidence that (with slight modifications) Mayhew’s and Fenno’s classic frameworks still clearly capture the majority of congressional communication. While most of the messages that do not fit into one of our categories lack any real political substance, involving things like holiday wishes or recognition of specific constituent achievements, we acknowledge that there may be messaging styles unique to online communication that simply do not map well onto categories originally intended for different forms of communication. As such, the shareable aspects of our dataset will allow scholars to develop their own categorization schemes and further highlight the ways in which the content of messages has and has not changed in accordance with changes in the way those messages are delivered.
So in sum, though politics and political communication has changed drastically in the past half century, the fact remains that “if there is to be congruence between the policy preferences of the represented and the policy decisions of the representatives, however, two-way communication between them is a prerequisite” (Fenno Reference Fenno1978, 241). We offer a comprehensive resource for the continuing and evolving study of representation in the United States. The possibilities our data unlock are too many to list here; we are confident that scholars from across the discipline will benefit from having such a resource at their disposal, and use it in ways beyond what we can imagine.
SUPPLEMENTARY MATERIAL
To view supplementary material for this article, please visit https://doi.org/10.1017/S0003055426101841.
DATA AVAILABILITY STATEMENT
Research documentation and data that support the findings of this study are openly available at the American Political Science Review Dataverse: https://doi.org/10.7910/DVN/19MIBB.
ACKNOWLEDGEMENTS
We would like to thank Hongbi Choi, David Hilden, and Jamie Wright for their able research assistance. We gratefully acknowledge helpful feedback and advice from Andy Ballard, Lindsey Cormack, Jaclyn Kaslosky, Michael Olson, Ju-Yeon Park, Annelise Russell, and Boris Shor.
FUNDING STATEMENT
This research was funded by the Center for Effective Lawmaking and the University of Houston’s Division of Research.
CONFLICT OF INTEREST
The authors declare no ethical issues or conflicts of interest in this research.
ETHICAL STANDARDS
The authors affirm this research did not involve human participants.





 Open access


Comments
No Comments have been published for this article.