Introduction
The Atlantic Forest is one of the most fragmented and impacted biomes due to human activities, having lost more than 93% of its original area, with most of its remnants being small (<50 ha) and isolated in the landscape (Galindo-Leal and Câmara Reference Galindo-Leal and Câmara2003; Ribeiro et al. Reference Ribeiro, Metzger, Martensen, Ponzoni and Hirota2009). Despite this unfavourable scenario, this ecosystem harbours an extraordinary diversity of plant and animal species, with a high number of endemisms (Galindo-Leal and Câmara Reference Galindo-Leal and Câmara2005), backing its classification as a global biodiversity hotspot (Myers et al. Reference Myers, Mittermeier, Mittermeier, Fonseca and Kent2000).
Forest fragmentation is understood as a change in landscape configuration, resulting in the loss of native habitat and the consequent formation of small and isolated fragments, usually separated by a matrix of altered land cover (Haddad et al. Reference Haddad, Brudvig, Clobert, Davies, Gonzalez, Holt, Lovejoy, Sexton, Austin, Collins, Cook, Damschen, Ewers, Foster, Jenkins, King, Laurance, Levey, Margules, Melbourne, Nicholls, Orrock, Song and Townshend2015). As a result, different interfaces abruptly emerge, exposing the organisms residing in the forest fragments to new conditions from a distinct surrounding environment (Murcia Reference Murcia1995). The set of structural and functional changes in the community arising from the formation of edges in the remaining fragments is known as the edge effect (Laurance et al. Reference Laurance, Lovejoy, Vasconcelos, Bruna, Didham, Stouffer, Gascon, Bierregaard, Laurance and Sampaio2002), which is considered one of the main impacts on tropical forest fragments (Laurance et al. Reference Laurance, Nascimento, Laurance, Andrade, Fearnside, Ribeiro and Capretz2006).
High tree mortality at varying distances from forest edges has been widely documented across different forest systems (Harper et al. Reference Harper, Macdonald, Burton, Chen, Brososfke, Saunders, Euskirchen, Roberts, Jaiteh and Esseen2005; Medeiros et al. Reference Medeiros, Castro, Salimon, Silva and Silveira2013; Pütz et al. Reference Putz, Groeneveld, Alves, Metzger and Huth2011). Specifically, regarding large trees (LTs), studies such as that of Briant et al. (Reference Briant, Gond and Laurance2010) suggest that these individuals are particularly vulnerable to fragmentation, as they are more exposed to disturbances such as wind, especially if the surrounding matrix consists of deforested areas (Laurance et al. Reference Laurance, Delamônica, Laurance, Vasconcelos and Lovejoy2000; Mesquita et al. Reference Mesquita, Delamônica and Laurance1999). However, studies indicate that mechanical resistance to wind increases exponentially with tree size (Ribeiro et al. Reference Ribeiro, Chambers, Peterson, Trumbore, Marra, Wirth, Cannon, Négron-Juárez, Lima, de Paula, Santos and Higuchi2016). Additionally, physiological stress caused by changes in microclimatic conditions leads to the death of these standing individuals (D’Angelo et al. Reference D’Angelo, Andrade, Laurance, Laurance and Mesquita2004), contributing to biomass collapse in these areas (Nascimento and Laurance Reference Nascimento and Laurence2004). The proliferation of lianas, driven by fragmentation, also increases the vulnerability of LTs (Briant et al. Reference Briant, Gond and Laurance2010).
The notable increase in tree mortality in tropical forests (McDowell et al. Reference McDowell, Allen, Anderson-Teixeira, Brando, Brienen, Chambers, Christoffersen, Davies, Doughty, Duque, Espirito-Santo, Fisher, Fontes, Galbraith, Goodsman, Grossiord, Hartmann, Holm, Johnson, Kassim, Keller, Koven, Kueppers, Kumagai, Malhi, McMahon, Mencuccini, Meir, Moorcroft, Muller-Landau, Phillips, Powell, Sierra, Sperry, Warren, Xu and Xu2018), particularly among LTs, has significant implications for ecosystem integrity and biodiversity (Lindenmayer et al. Reference Lindenmayer, Laurance and Franklin2012). Given the critical role of these individuals, including storing large amounts of carbon (Lindenmayer and Laurance Reference Lindenmayer and Laurance2016; Slik et al. Reference Slik, Paoli, McGuire, Amaral, Barroso, Bastian, Blanc, Bongers, Boundja, Clark, Collins, Dauby, Ding, Doucet, Eler, Ferreira, Forshed, Fredriksson, Gillet, Harris, Leal, Laumonier, Mansor, Martin, Miyamoto, Araujo-Murakami, Nagamasu, Nilus, Nurtjahya, Oliveira, Onrizal, Parada-Gutierrez, Permana, Poorter, Poulsen, Ramirez-Angulo, Reitsma, Rovero, Rozak, Sheil, Silva-Espejo, Silveira, Spironelo, Steege, Stevart, Navarro-Aguilar, Sunderland, Suzuki, Tang, Theilade, van der Heijden, van Valkenburg, Van Do, Vilanova, Vos, Wich, Wöll, Yoneda, Zang, Zhang and Zweifel2013), regulating the hydrological cycle (Laurance et al. Reference Laurance, Delamônica, Laurance, Vasconcelos and Lovejoy2000), and providing shelter and food for wildlife (Felton et al. Reference Felton, Felton, Foley and Lindenmayer2010; Lindenmayer and Laurance Reference Lindenmayer and Laurance2016), understanding the underlying factors driving this mortality is essential. Thus, direct monitoring of the phytosanitary conditions leading to the death of LTs, along with long-term monitoring, is a promising approach to identify the factors underlying this process (Esquivel-Muelbert et al. Reference Esquivel-Muelbert, Phillips, Brienen, Fauset, Sullivan, Baker, Chao, Feldpausch, Gloor, Higuchi, Houwing-Duistermaat, Lloyd, Liu, Malhi, Marimon, Marimon Junior, Monteagudo-Mendoza, Poorter, Silveira, Vilanova Torre, Alvarez Dávila, del Aguila Pasquel, Almeida, Alvarez Loayza, Andrade, Aragão, Araujo-Murakami, Arets, Arroyo, Aymard, Baisie, Baraloto, Barbosa Camargo, Barroso, Blanc, Bonal, Bongers, Boot, Brown, Burban, Camargo, Castro, Chama Moscoso, Chave, Comiskey, Cornejo Valverde, Lola da Costa, Davila Cardozo, Di Fiore, Dourdain, Erwin, Llampazo, Vieira, Herrera, Coronado, Huamantupa-Chuquimaco, Jimenez-Rojas, Killeen, Laurance, Laurance, Levesley, Lewis, Ladvocat, Lopez-Gonzalez, Lovejoy, Meir, Mendoza, Morandi, Neill, Lima, Vargas, de Oliveira, Camacho, Pardo, Peacock, Peña-Claros, Peñuela-Mora, Pickavance, Pipoly, Pitman, Prieto, Pugh, Quesada, Ramirez-Angulo, Reis, Rejou-Machain, Correa, Bayona, Rudas, Salomão, Serrano, Espejo, Silva, Singh, Stahl, Stropp, Swamy, Talbot, ter Steege, Terborgh, Thomas, Toledo, Torres-Lezama, Gamarra, van der Heijden, van der Meer, van der Hout, Martinez, Vieira, Cayo, Vos, Zagt, Zuidema and Galbraith2020).
The present study aimed to evaluate the health of LTs along an edge-interior gradient in eight fragments of Semi-deciduous Seasonal Forest, one of the most threatened formations in the South American Atlantic Forests (Carlucci et al. Reference Carlucci, Marcilio-Silva, Torezan, Marques and Grelle2021; Ribeiro et al. Reference Ribeiro, Metzger, Martensen, Ponzoni and Hirota2009). The health of LTs was assessed using 11 health indicators, compiled into the Health Threat Index (HTI). In four of these fragments, monitoring represents the second health assessment, initiated in 2019 (Arcanjo et al. Reference Arcanjo, Taglianetti and Torezan2020), allowing a comparison between the data collected in the two periods. For these re-evaluated fragments, the study also investigated the factors contributing to the mortality of LTs, analysing how the health indicators behaved in 2019 for individuals found dead in 2023. Our hypothesis is that the health of LTs worsens in areas near the fragment.
Materials and methods
Study area
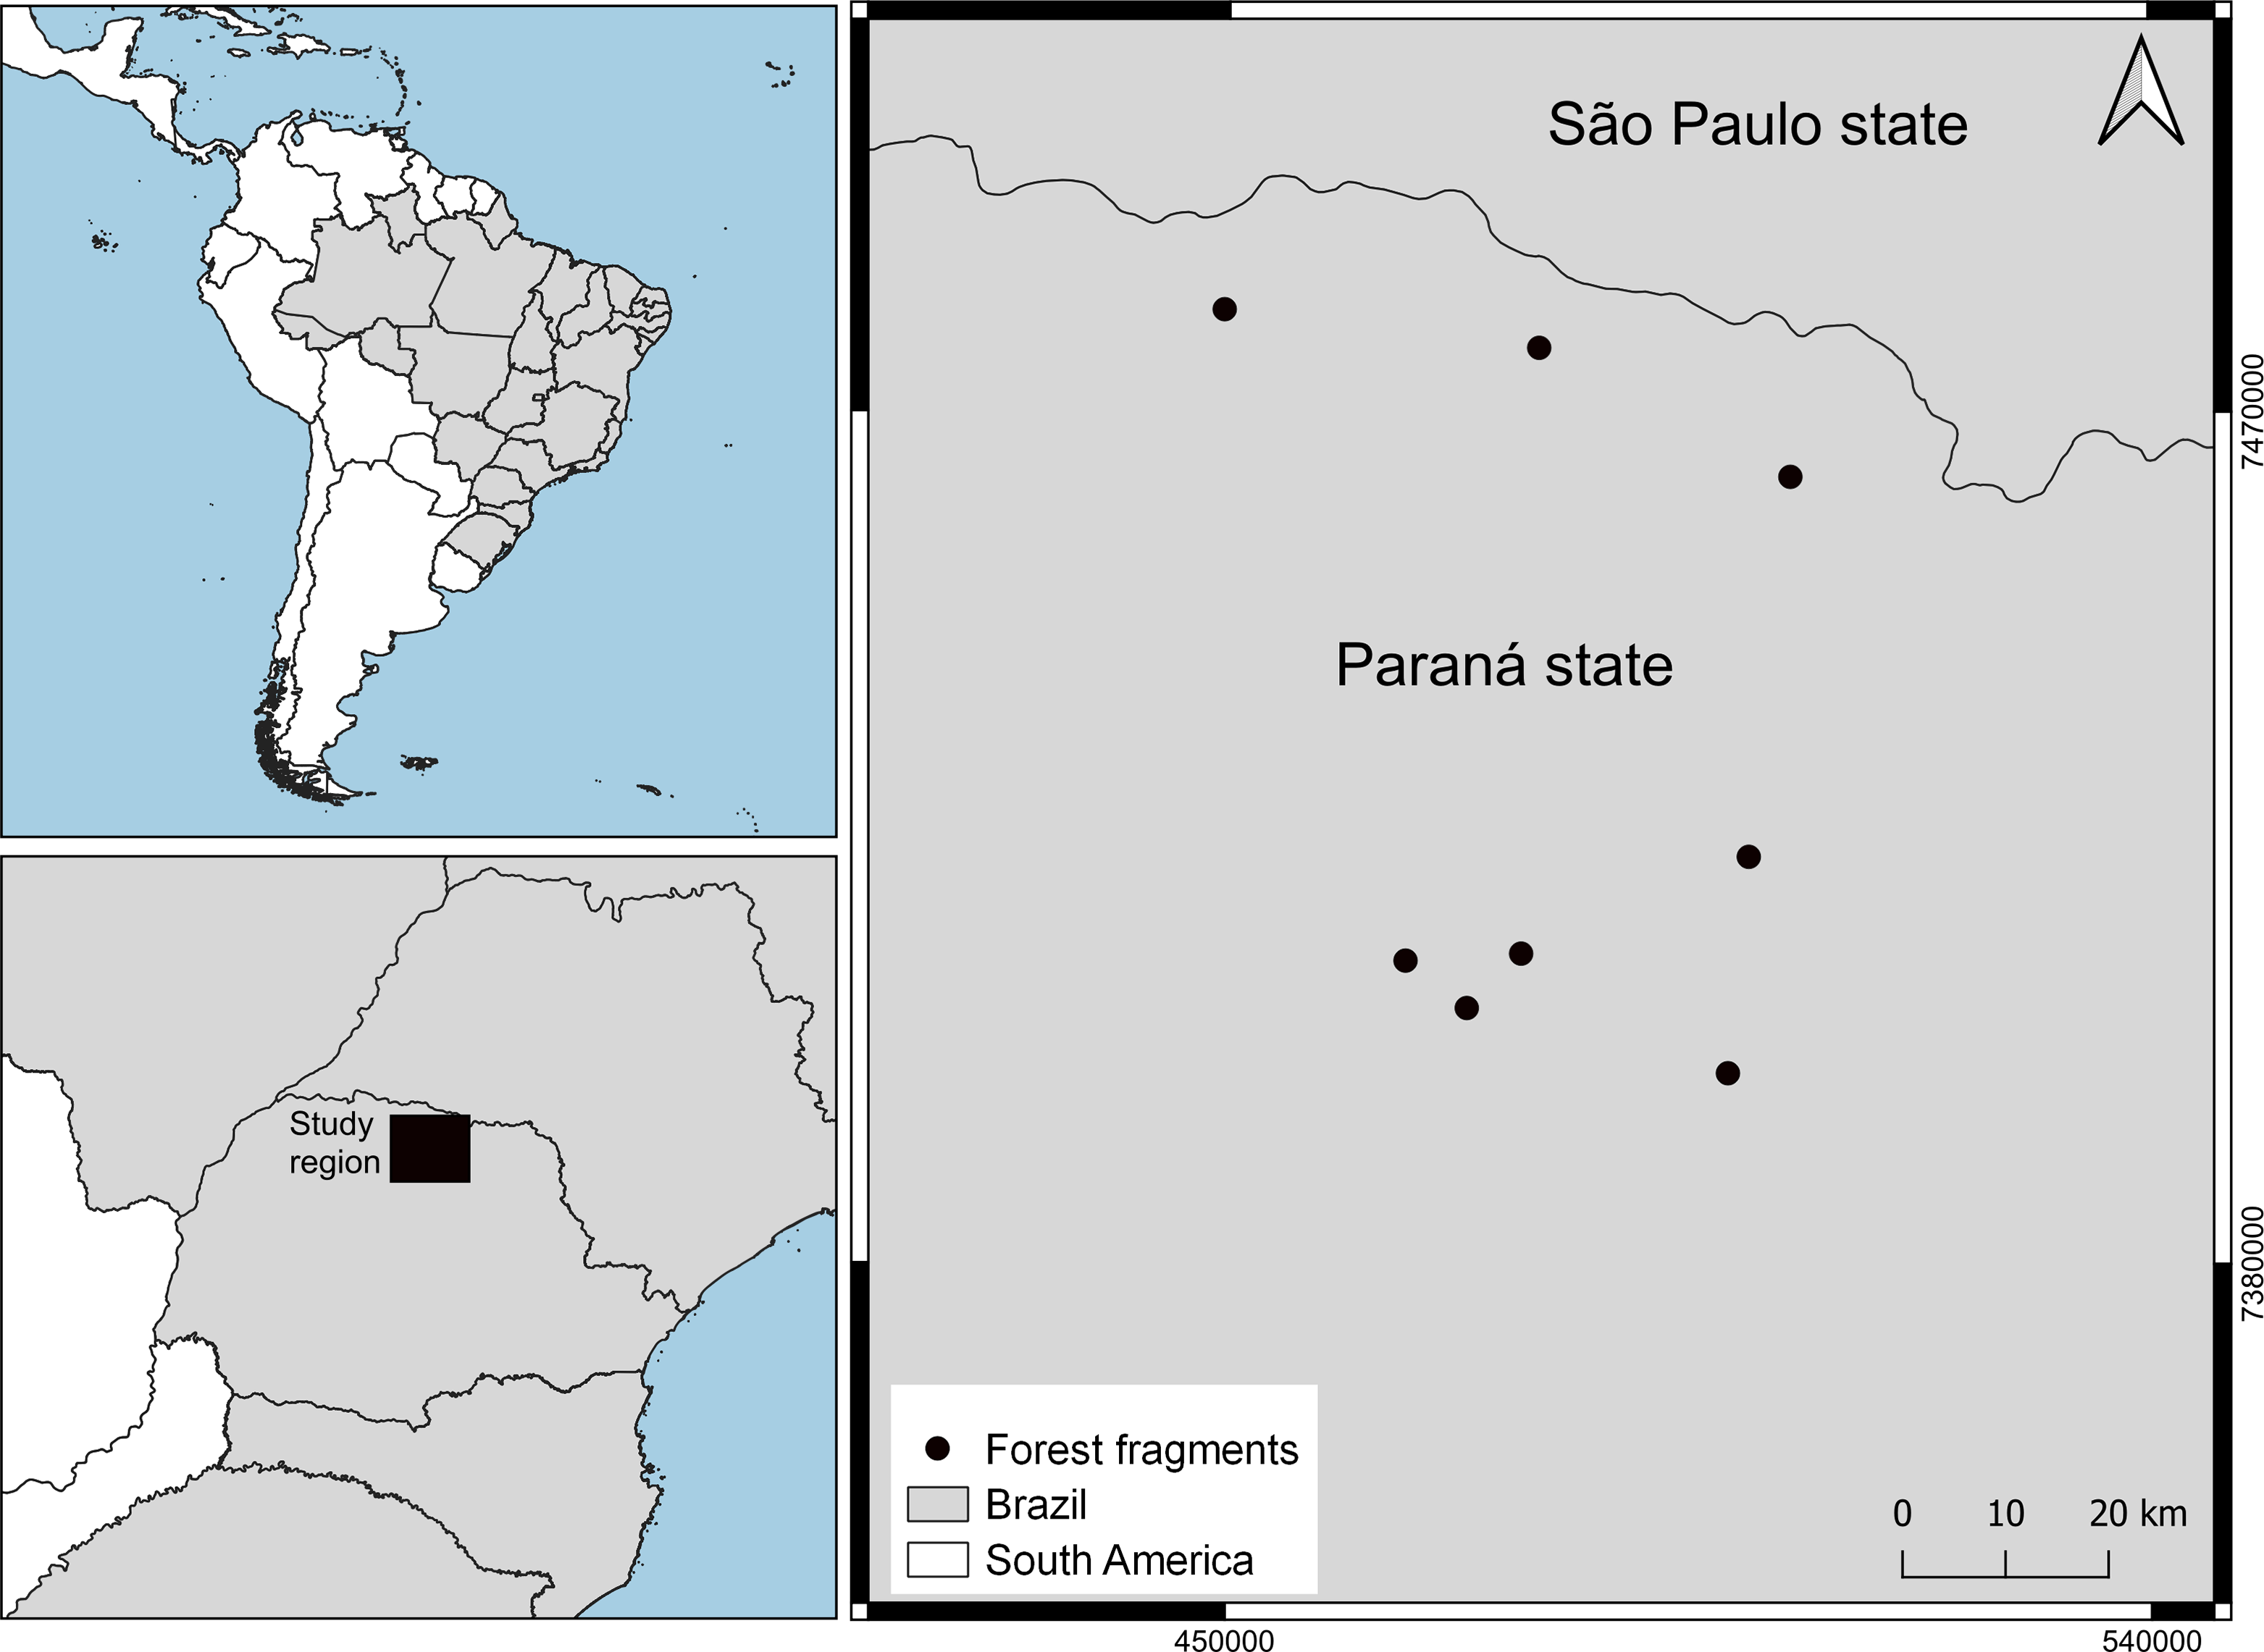
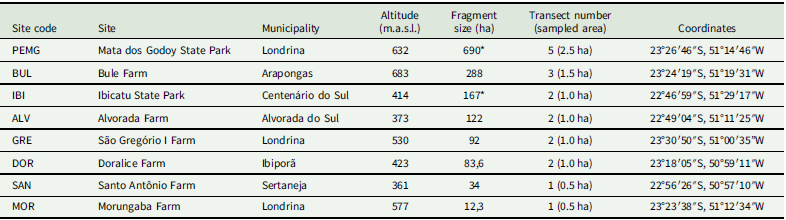
The research was conducted in the northern region of Paraná State, Southern Brazil, in eight forest fragments (Table 1 and Figure 1). Some of these fragments are part of the Long-Term Ecological Research site ‘Atlantic Forest of Northern Paraná’ (PELD-MANP).
Location of the eight Semi-deciduous Seasonal Atlantic Forest fragments in northern Paraná, southeastern Brazil.

Features of Semi-deciduous Seasonal Atlantic Forest fragments, in northern Parana state, Brazil

Table 1. Long description
A table comparing features of forest fragments in northern Parana state, Brazil. The table has 8 rows and 7 columns. Column headers are Site code, Site, Municipality, Altitude (m.a.s.l), Fragment size (ha), Transect number (sampled area), and Coordinates. Row 1: PEMG, Mata dos Godoy State Park, Londrina, 632, 690*, 5 (2.5 ha), 23°26′46″S, 51°14′46″W. Row 2: BUL, Bule Farm, Arapongas, 683, 288, 3 (1.5 ha), 23°24′19″S, 51°19′31″W. Row 3: IBI, Ibicatu State Park, Centenário do Sul, 414, 167*, 2 (1.0 ha), 22°46′59″S, 51°29′17″W. Row 4: ALV, Alvorada Farm, Alvorada do Sul, 373, 122, 2 (1.0 ha), 22°49′04″S, 51°11′25″W. Row 5: GRE, São Gregório I Farm, Londrina, 530, 92, 2 (1.0 ha), 23°30′50″S, 51°00′35″W. Row 6: DOR, Doralice Farm, Ibiporã, 423, 83.6, 2 (1.0 ha), 23°18′05″S, 50°59′11″W. Row 7: SAN, Santo Antônio Farm, Sertaneja, 361, 34, 1 (0.5 ha), 22°56′26″S, 50°57′10″W. Row 8: MOR, Morungaba Farm, Londrina, 577, 12.3, 1 (0.5 ha), 23°23′38″S, 51°12′34″W.
* PEMG is accounted for with a total area of 2,800 ha and IBI with a total area of 302 ha when including other fragments and capoeira around.
The vegetation cover of the fragments is characterized as Semi-deciduous Seasonal Forest, a forest subtype of the Atlantic Forest (IBGE 2012). According to the Köppen global climate classification, the climate is classified as Cfa, characterized as humid subtropical, with a more intense rainy season in summer and no defined dry season. The average annual precipitation ranges from 1,200 to 1,800 mm, and the average annual temperature ranges from 21 to 23°C (Nitsche et al. Reference Nitsche, Caramori, Ricce and Pinto2019). The soils are classified as eutrophic dark red latosol and eutroferric nitossol, derived from basalt, known for their high natural fertility (Bhering et al. Reference Bhering, Santos, Manzatto, Bognola, Fasolo, Carvalho and Rauen2007).
Of the eight evaluated fragments, six are located on private properties, while two are part of state-level Conservation Units (UCs). The private forest fragments belong to the rural properties of the Alvorada (ALV), Bule (BUL), Doralice (DOR), Morungaba (MOR), Santo Antônio (SAN), and São Gregório I (GRE) farms. The fragments located within UCs are under the jurisdiction of the Mata dos Godoy State Park (PEMG) and the Ibicatu State Park (IBI).
The ALV, DOR, IBI, MOR, SAN, and GRE fragments have undergone selective logging. In the BUL fragment, this activity was limited to one of the forest edges. In the PEMG fragment, there are no records of selective logging in any part of the forest.
Sampling
Data collection was conducted from February 2023 to October 2023 in the eight forest fragments (PEMG, BUL, IBI, ALV, GRE, DOR, SAN, and MOR). A total of 18 transects, each 250 m long, were established perpendicular to the forest edge, starting at the edge and extending inwards. The number of transects per area was proportional to its size: one transect for areas up to 50 ha, two transects for fragments between 50 and 200 ha, three transects for fragments between 200 and 350 ha, four transects for fragments between 350 and 500 ha, and a maximum of five transects for fragments larger than 500 ha. Sampling was performed within 20 m of the centreline of each transect, resulting in a sample area of 5,000 m2 (0.5 ha) per transect. Due to differences in the shape of the forest fragments, the transects were mainly installed in sections of straight edge or within concave angles, avoiding proximity to convex fragment corners. For descriptive analyses, each transect was divided into five plots of 50 × 20 m (0–50, 50–100, 100–150, 150–200, and 200–250 m), resulting in a total of 90 plots (Figure S1).
In the plots, all LTs, defined as those with a diameter at breast height (DBH) of 50 centimetres or more, a threshold used in studies conducted in the Atlantic Forest to define LTs (Arcanjo and Torezan Reference Arcanjo and Torezan2022; Arcanjo et al. Reference Arcanjo, Taglianetti and Torezan2020; Vieira et al. Reference Vieira, Araujo and Torezan2025), were numbered, georeferenced, and measured.
DBH (cm) was measured using a flexible tape, while tree height at 1.30 m above ground was recorded with a graduated pole, accounting for terrain inclinations and excluding buttress roots. All measurements followed the inventory protocol by Pearson et al. (Reference Pearson, Walker and Brown2005). Species identification was conducted in the field whenever feasible, but for all species, samples were collected and later confirmed or identified at the Herbarium of the State University of Londrina (UEL) – FUEL. Botanical names follow the Flora do Brasil 2020 database (Flora do Brasil 2020).
Tree health assessment
The health assessment was carried out using a visual diagnosis form that included the key indicators identified during external visual inspections of the trees. After each tree was inspected, the corresponding health indicators outlined in the form were recorded (Table S1).
The 11 assessed indicators included liana infestation in the crown, partial crown death, liana infestation in the stem, stem rotten, fungi in the stem, cavity in the stem, presence of galls, presence of termites, cavities in the roots and root collars, fungi in the roots and root collars, and roots and root collars rotten. The form was created based on factors known to impact tree health or lead to tree mortality (Arellano et al. Reference Arellano, Zuleta and Davies2020; Fontes et al. Reference Fontes, Chambers and Higuchi2018; Rutishauser et al. Reference Rutishauser, Barthélémy, Blanc and Eric-Andre2011; Tattar Reference Tattar1989).
Each indicator was recorded for every tree using a scoring system ranging from zero to 3. A score of zero indicated the absence of the indicator, while a score of 1 signified minor health damage, 2 indicated moderate damage, and 3 represented severe damage. For fungi-related indicators, only two possible scores were assigned: zero for no presence of fungi and 3 for their presence, due to the uncertainty surrounding the extent of fungal infection and its influence on tree survival (Arellano et al. Reference Arellano, Zuleta and Davies2020). The total score from all indicators made up the HTI, ranging from zero to 33, where higher values indicated trees in worse health conditions.
The health assessments of LTs were initially conducted in 2019 (Arcanjo et al. Reference Arcanjo, Taglianetti and Torezan2020) and repeated in the present study for the PEMG, BUL, ALV, and SAN fragments, resulting in two assessments for these areas. In contrast, for the IBI, DOR, GRE, and MOR fragments, the sampling and health assessments were conducted for the first time during this research.
Data analysis
To evaluate the influence of fragment size (FS) and edge distance (ED), explanatory variables, on the HTI of LTs, response variable, four generalized linear models (GLMs) with a negative binomial distribution to correct for overdispersion were fitted: a model with FS only, a model with ED only, an additive model with FS and ED, and a model with an interaction effect between FS and ED. Analyses were conducted using the glm.nb function from the MASS package (Venables and Ripley Reference Venables and Ripley2002). Model selection was based on the corrected Akaike Information Criterion (AICc), which includes a bias correction for small sample sizes. Models with ΔAICc ≤ 2 were considered equally informative (Zuur et al. Reference Zuur, Ieno, Walker, Saveliev and Smith2009). Homoscedasticity and normality of residuals were visually assessed through fixed and simulated residuals, as well as quantile-quantile plots generated with the DHARMa package (Hartig Reference Hartig2022).
For fragments with two health assessments (PEMG, BUL, ALV, and SAN), HTIs from the 2019 and 2023 sampling periods were compared using a paired t-test (Zar Reference Zar2010).
All graphs were created using the ggplot2 package (Wickham Reference Wickham2016). Results were considered statistically significant at p < 0.05. All analyses were performed using R Studio software, version 4.1.2 (R Core Team Reference Team2022).
Results
In the eight forest fragments, 189 LTs (DBH ≥ 50 cm) were sampled, comprising 40 species from 20 families (Table S2). The families with the highest abundance of individuals were Phytolaccaceae (61), Euphorbiaceae (24), and Apocynaceae (22). Across the edge-distance classes, 32 LTs were recorded within the first 50 m from the edge, 43 between 50 and 100 m, and 42 between 200 and 250 m from the edge. The abundances of the AGs per fragment can be found in Table S3.
Health of large trees across the edge-interior gradient
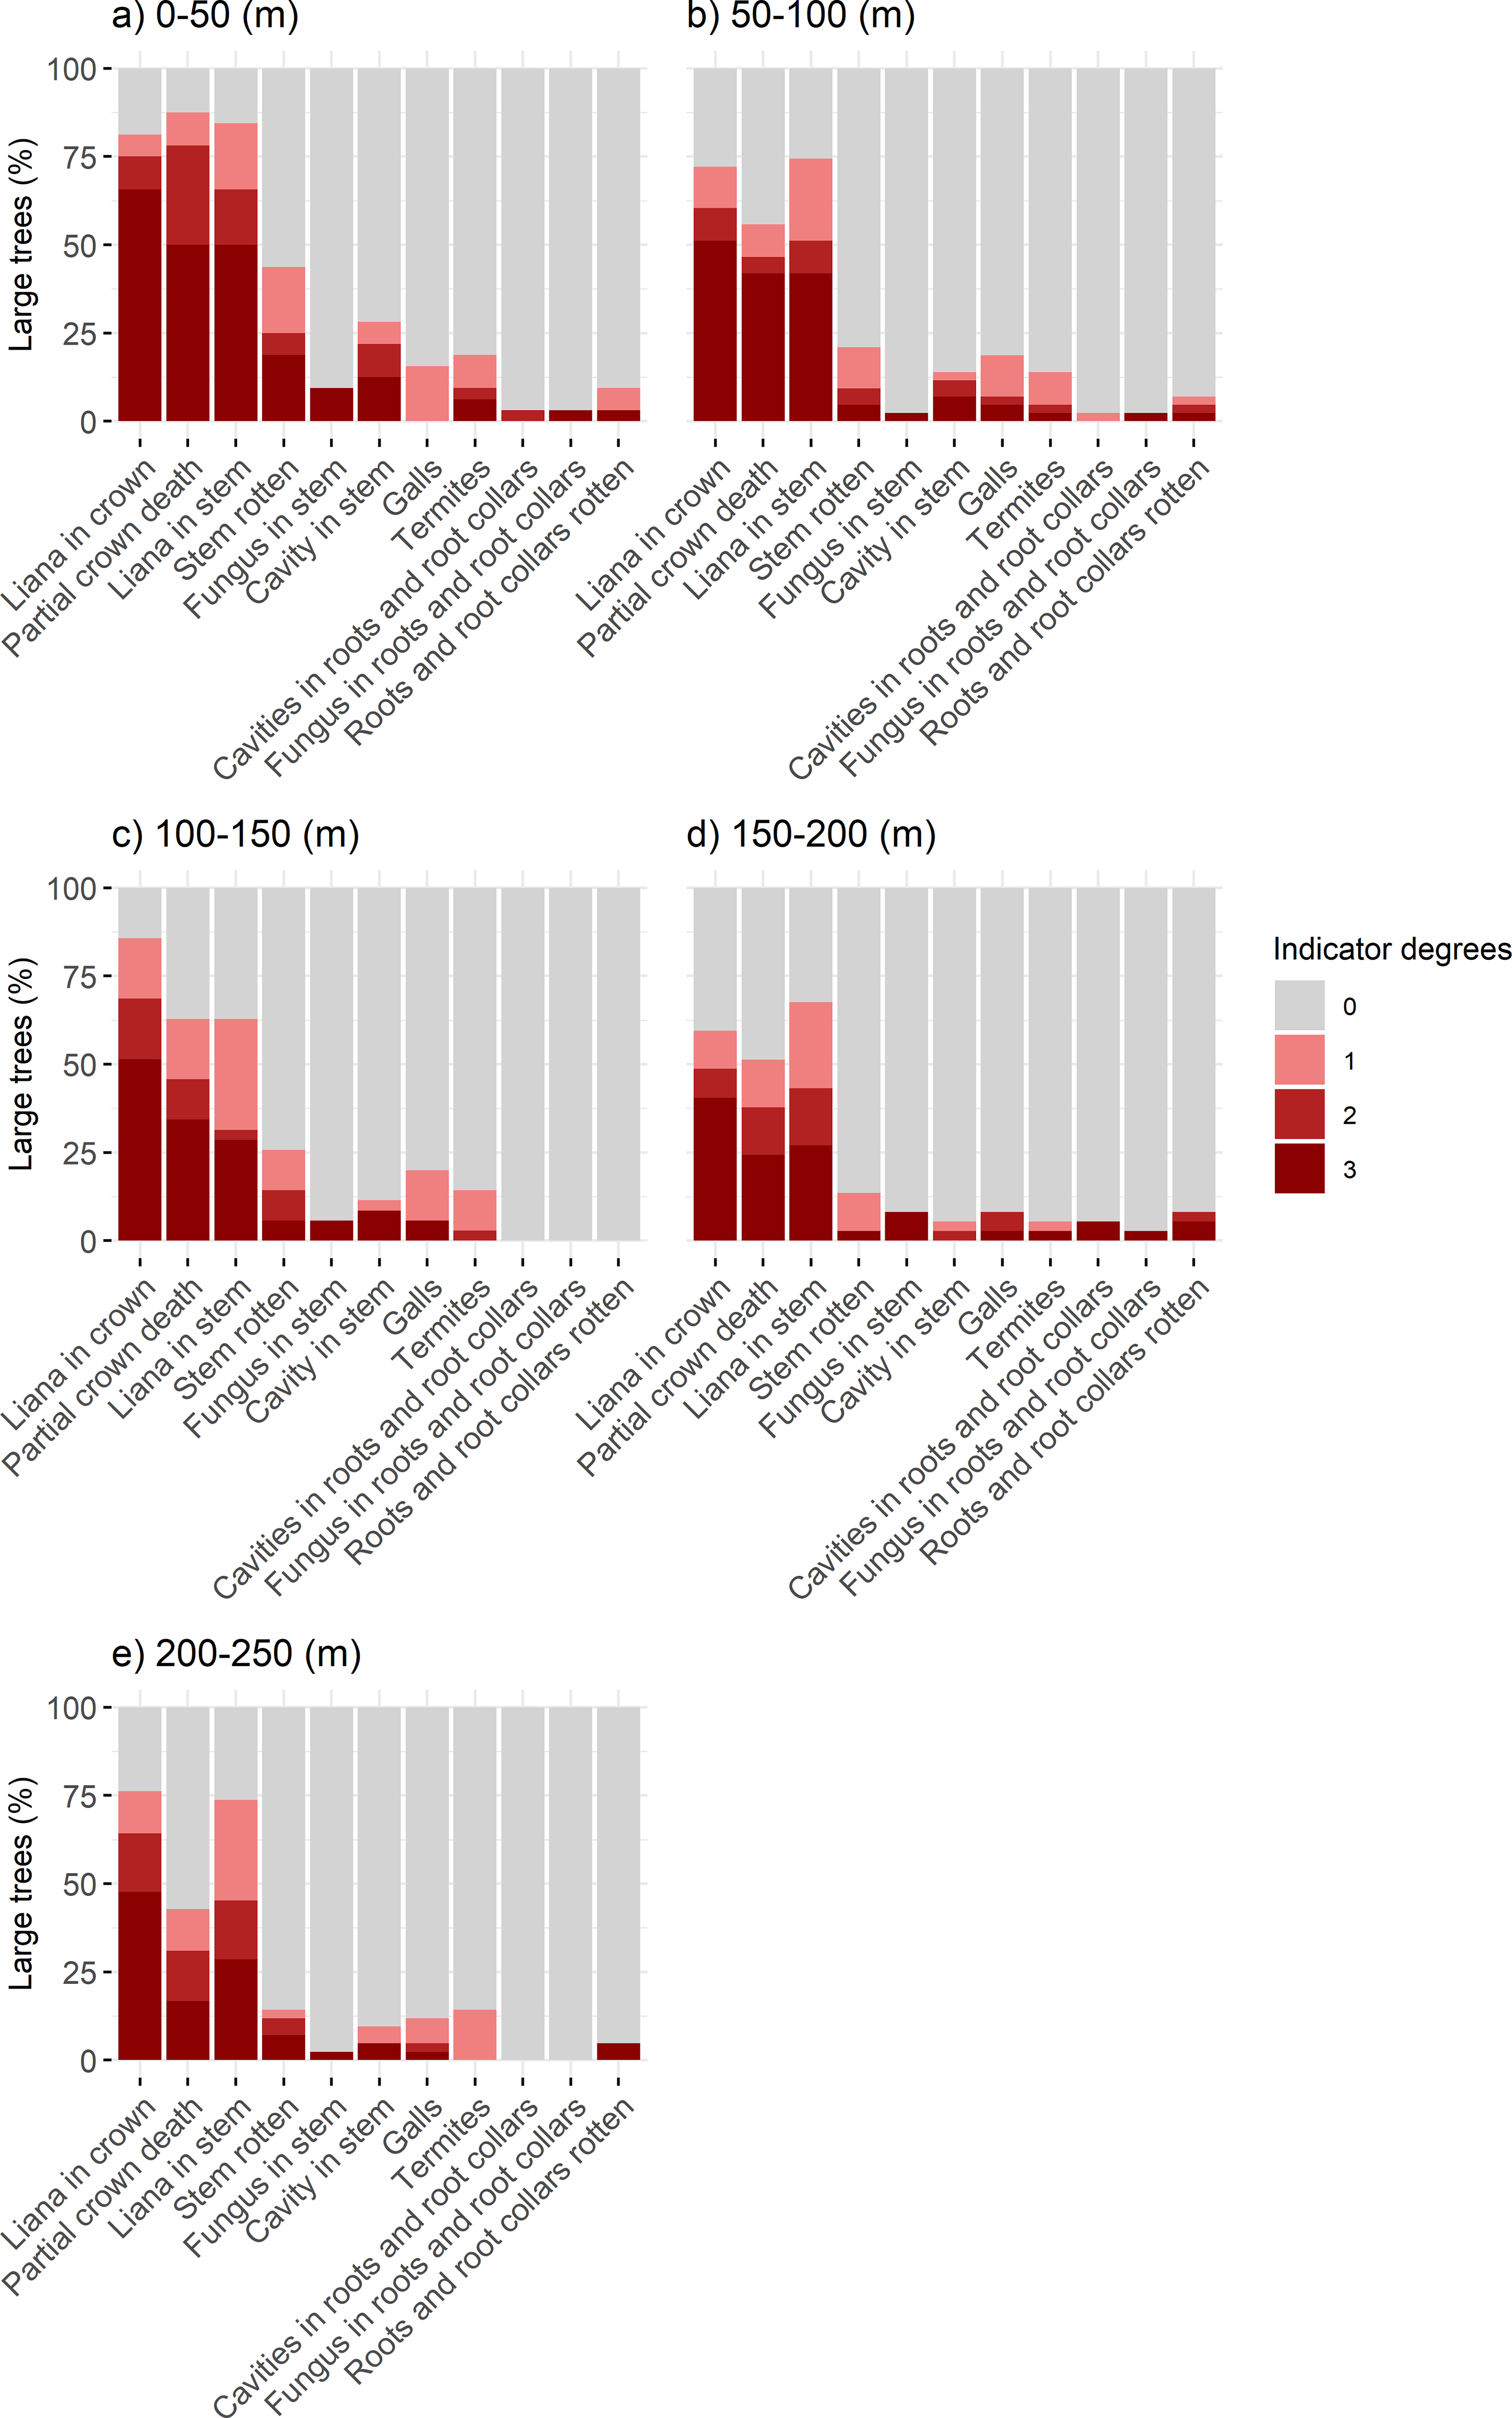
Of the 189 sampled trees, 175 showed at least one record of health threat, while 14 individuals exhibited no indicators (HTI = 0). The highest score recorded was 25 out of a maximum of 33, with the average HTI for all trees being 6.3. A descriptive frequency analysis of the individual health indicators revealed that, within 50 m from the edge, there was a higher incidence of trees showing various levels of health threats (scores 1, 2, and 3), which was reflected in nine out of the 11 evaluated indicators (Figure 2a). This analysis is intended to illustrate how the individual components of the HTI are distributed along the edge-distance gradient, rather than to test statistical differences among indicators.
Frequency of health indicator scores in large trees (DBH ≥ 50 cm) sampled along an edge-interior gradient (250 m) in eight fragments of Semi-deciduous Seasonal Forest, Paraná, Brazil. (a) 0–50 m from the edge; (b) 50–100 m from the edge; (c) 100–150 m from the edge; (d) 150–200 m from the edge; and (e) 200–250 m from the edge.

Figure 2. Long description
Panel A: A bar graph showing the frequency of health indicator scores in large trees 0 to 50 meters from the edge. The horizontal axis lists various health indicators, and the vertical axis represents the percentage of large trees. The bars are stacked and color-coded based on indicator degrees, ranging from 0 to 3. Panel B: A bar graph showing the frequency of health indicator scores in large trees 50 to 100 meters from the edge. The horizontal axis lists various health indicators, and the vertical axis represents the percentage of large trees. The bars are stacked and color-coded based on indicator degrees, ranging from 0 to 3. Panel C: A bar graph showing the frequency of health indicator scores in large trees 100 to 150 meters from the edge. The horizontal axis lists various health indicators, and the vertical axis represents the percentage of large trees. The bars are stacked and color-coded based on indicator degrees, ranging from 0 to 3. Panel D: A bar graph showing the frequency of health indicator scores in large trees 150 to 200 meters from the edge. The horizontal axis lists various health indicators, and the vertical axis represents the percentage of large trees. The bars are stacked and color-coded based on indicator degrees, ranging from 0 to 3. Panel E: A bar graph showing the frequency of health indicator scores in large trees 200 to 250 meters from the edge. The horizontal axis lists various health indicators, and the vertical axis represents the percentage of large trees. The bars are stacked and color-coded based on indicator degrees, ranging from 0 to 3.
Across all EDs evaluated (0–50, 50–100, 100–150, 150–200, and 200–250 m), the main health threats to LTs were liana infestation in the crown, partial crown death, and liana infestation in the stem, as shown in Figure 2. However, more severe damage (score 3) for these three indicators was observed within the first 50 m from the edge. Notably, 43.7% of LTs exhibited stem rotten within the first 50 m from the edge. For the remaining seven health indicators (fungi in the stem, cavity in the stem, presence of galls, presence of termites, cavities in the roots and root collars, fungi in the roots and root collars, and roots and root collars rotten), the percentage of affected LTs did not exceed 28.1%, this value being reached for cavity in the stem within the first 50 m from the edge (Table S4).
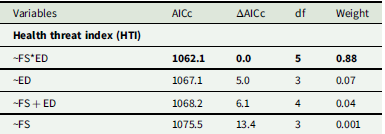
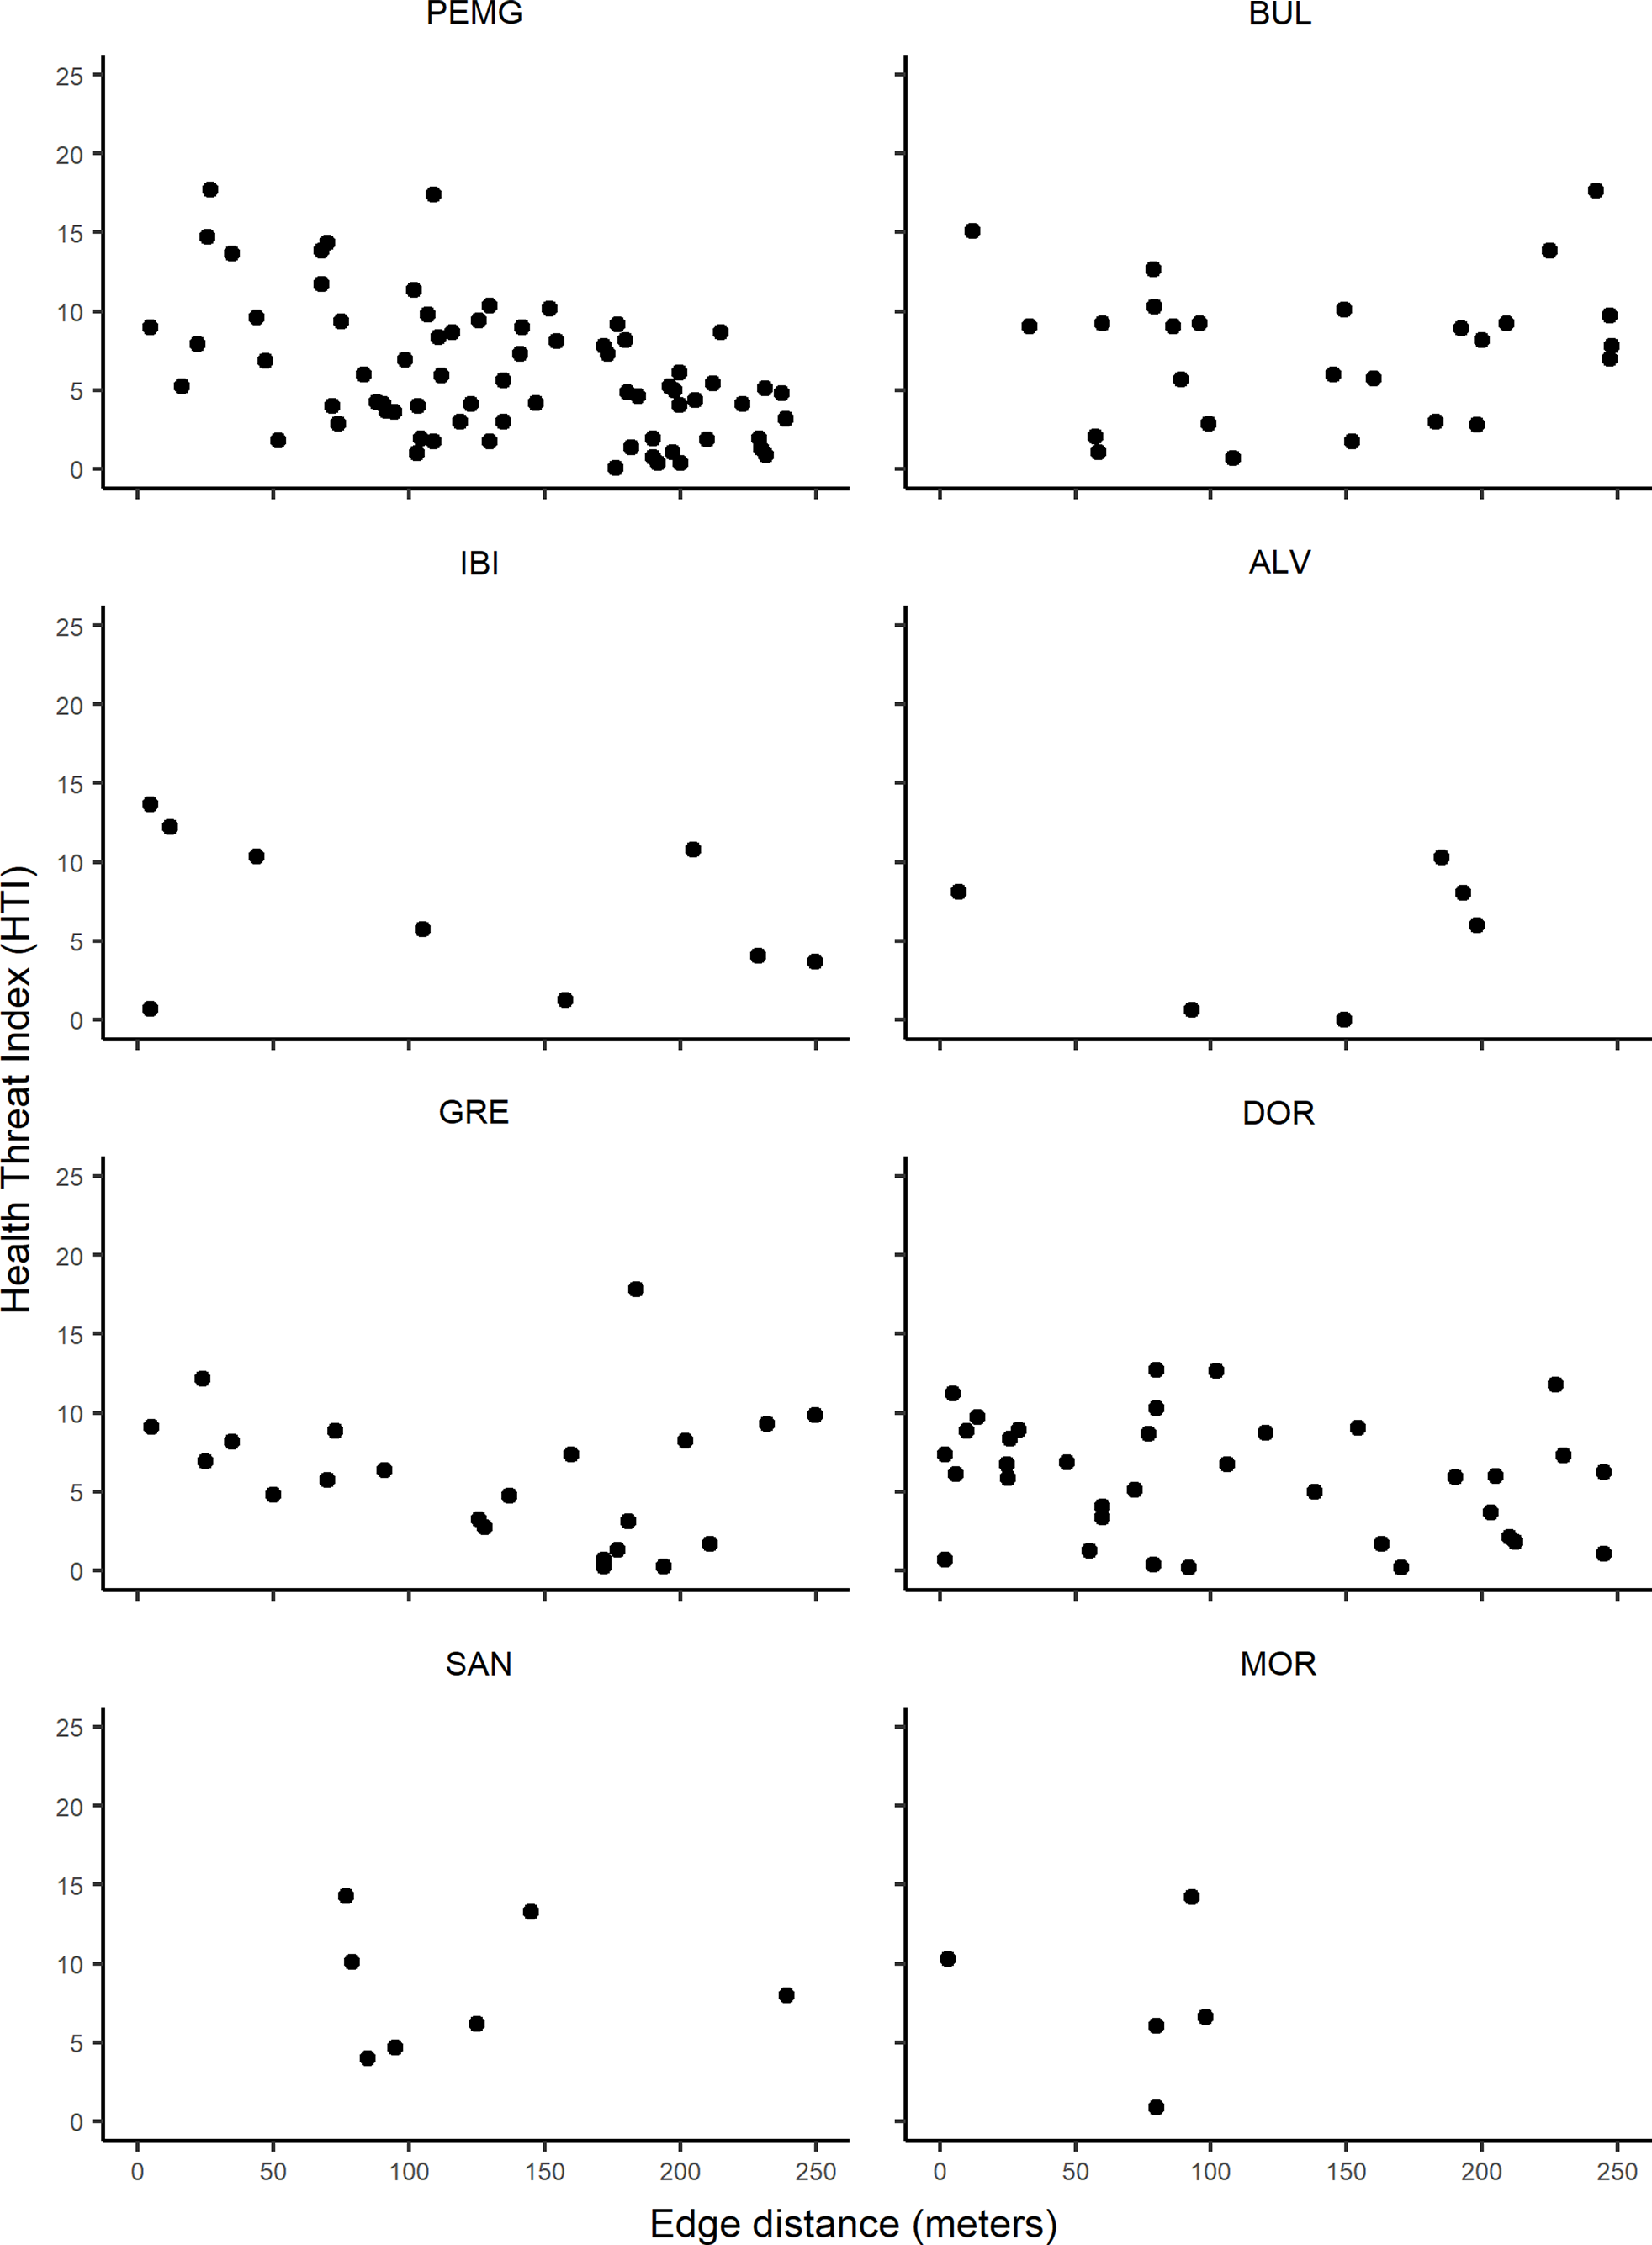
The analysis using GLMs with negative binomial distribution showed that the model including the interaction between FS and ED presented the best fit according to the corrected Akaike Information Criterion (AICc = 1062.1; ΔAICc = 0; weight = 0.88; Table 2). This model outperformed those with only FS, only ED, or the additive effect of FS and ED. In the interaction model, FS had a significant effect (p = 0.042), as did the interaction between FS and edge distance (p = 0.003), while ED alone was not significant (p = 0.880). Detailed model coefficients are provided in Table S5, and the variation of the HTI across EDs for all fragments is illustrated in Figure S2.
Generalized linear models (GLMs) fitted to evaluate the effects of fragment size (FS) and edge distance (ED) on the Health Threat Index (HTI) of large trees (DBH ≥ 50 cm) in eight forest fragments from northern Paraná, Brazil. Models with ΔAICc ≤ 2 were considered equally informative and are highlighted in bold (see main text). FS = fragment size; ED = edge distance; df = degrees of freedom; weight = Akaike weight

Table 2. Long description
A table comparing models evaluating the effects of fragment size (FS) and edge distance (ED) on the Health Threat Index (HTI) of large trees. The table has four rows and five columns. Column headers are Variables, AICc, ΔAICc, df, and Weight. Row 1: Variables, ~FS*ED; AICc, 1062.1; ΔAICc, 0.0; df, 5; Weight, 0.88. Row 2: Variables, ~ED; AICc, 1067.1; ΔAICc, 5.0; df, 3; Weight, 0.07. Row 3: Variables, ~FS + ED; AICc, 1068.2; ΔAICc, 6.1; df, 4; Weight, 0.04. Row 4: Variables, ~FS; AICc, 1075.5; ΔAICc, 13.4; df, 3; Weight, 0.001. The model with the interaction between FS and ED has the lowest AICc value and the highest weight, indicating it is the most informative model.
In addition to Table 2, Figure 3 shows the HTI by ED for each fragment. The decrease in HTI with increasing distance is most evident in the largest fragment, PEMG, corroborating the significant interaction between FS and ED identified by the GLM.
Relationship between the Health Threat Index (HTI) and the distance class from the edge, modelled using a generalized linear models (GLM) with a negative binomial distribution, in eight fragments of the Semi-deciduous Seasonal Forest, Paraná, Brazil. The HTI is a unitary value ranging from 0 to 33 and is represented per tree. PEMG: Mata dos Godoy State Park; BUL: Bule Farm; IBI: Ibicatu State Park; ALV: Alvorada Farm; GRE: São Gregório I Farm; DOR: Doralice Farm; SAN: Santo Antônio Farm; and MOR: Morungaba Farm.

Figure 3. Long description
Panel PEMG: A scatter plot showing Health Threat Index (HTI) on the y-axis and edge distance in meters on the x-axis. Data points are scattered with no clear trend. Panel BUL: A scatter plot with HTI on the y-axis and edge distance in meters on the x-axis. Data points are sparsely distributed. Panel IBI: A scatter plot with HTI on the y-axis and edge distance in meters on the x-axis. Few data points are present, showing no clear pattern. Panel ALV: A scatter plot with HTI on the y-axis and edge distance in meters on the x-axis. Data points are sparsely distributed. Panel GRE: A scatter plot with HTI on the y-axis and edge distance in meters on the x-axis. Data points are scattered with no clear trend. Panel DOR: A scatter plot with HTI on the y-axis and edge distance in meters on the x-axis. Data points are scattered with no clear trend. Panel SAN: A scatter plot with HTI on the y-axis and edge distance in meters on the x-axis. Few data points are present, showing no clear pattern. Panel MOR: A scatter plot with HTI on the y-axis and edge distance in meters on the x-axis. Few data points are present, showing no clear pattern.
Health of large trees: 2019 vs. 2023
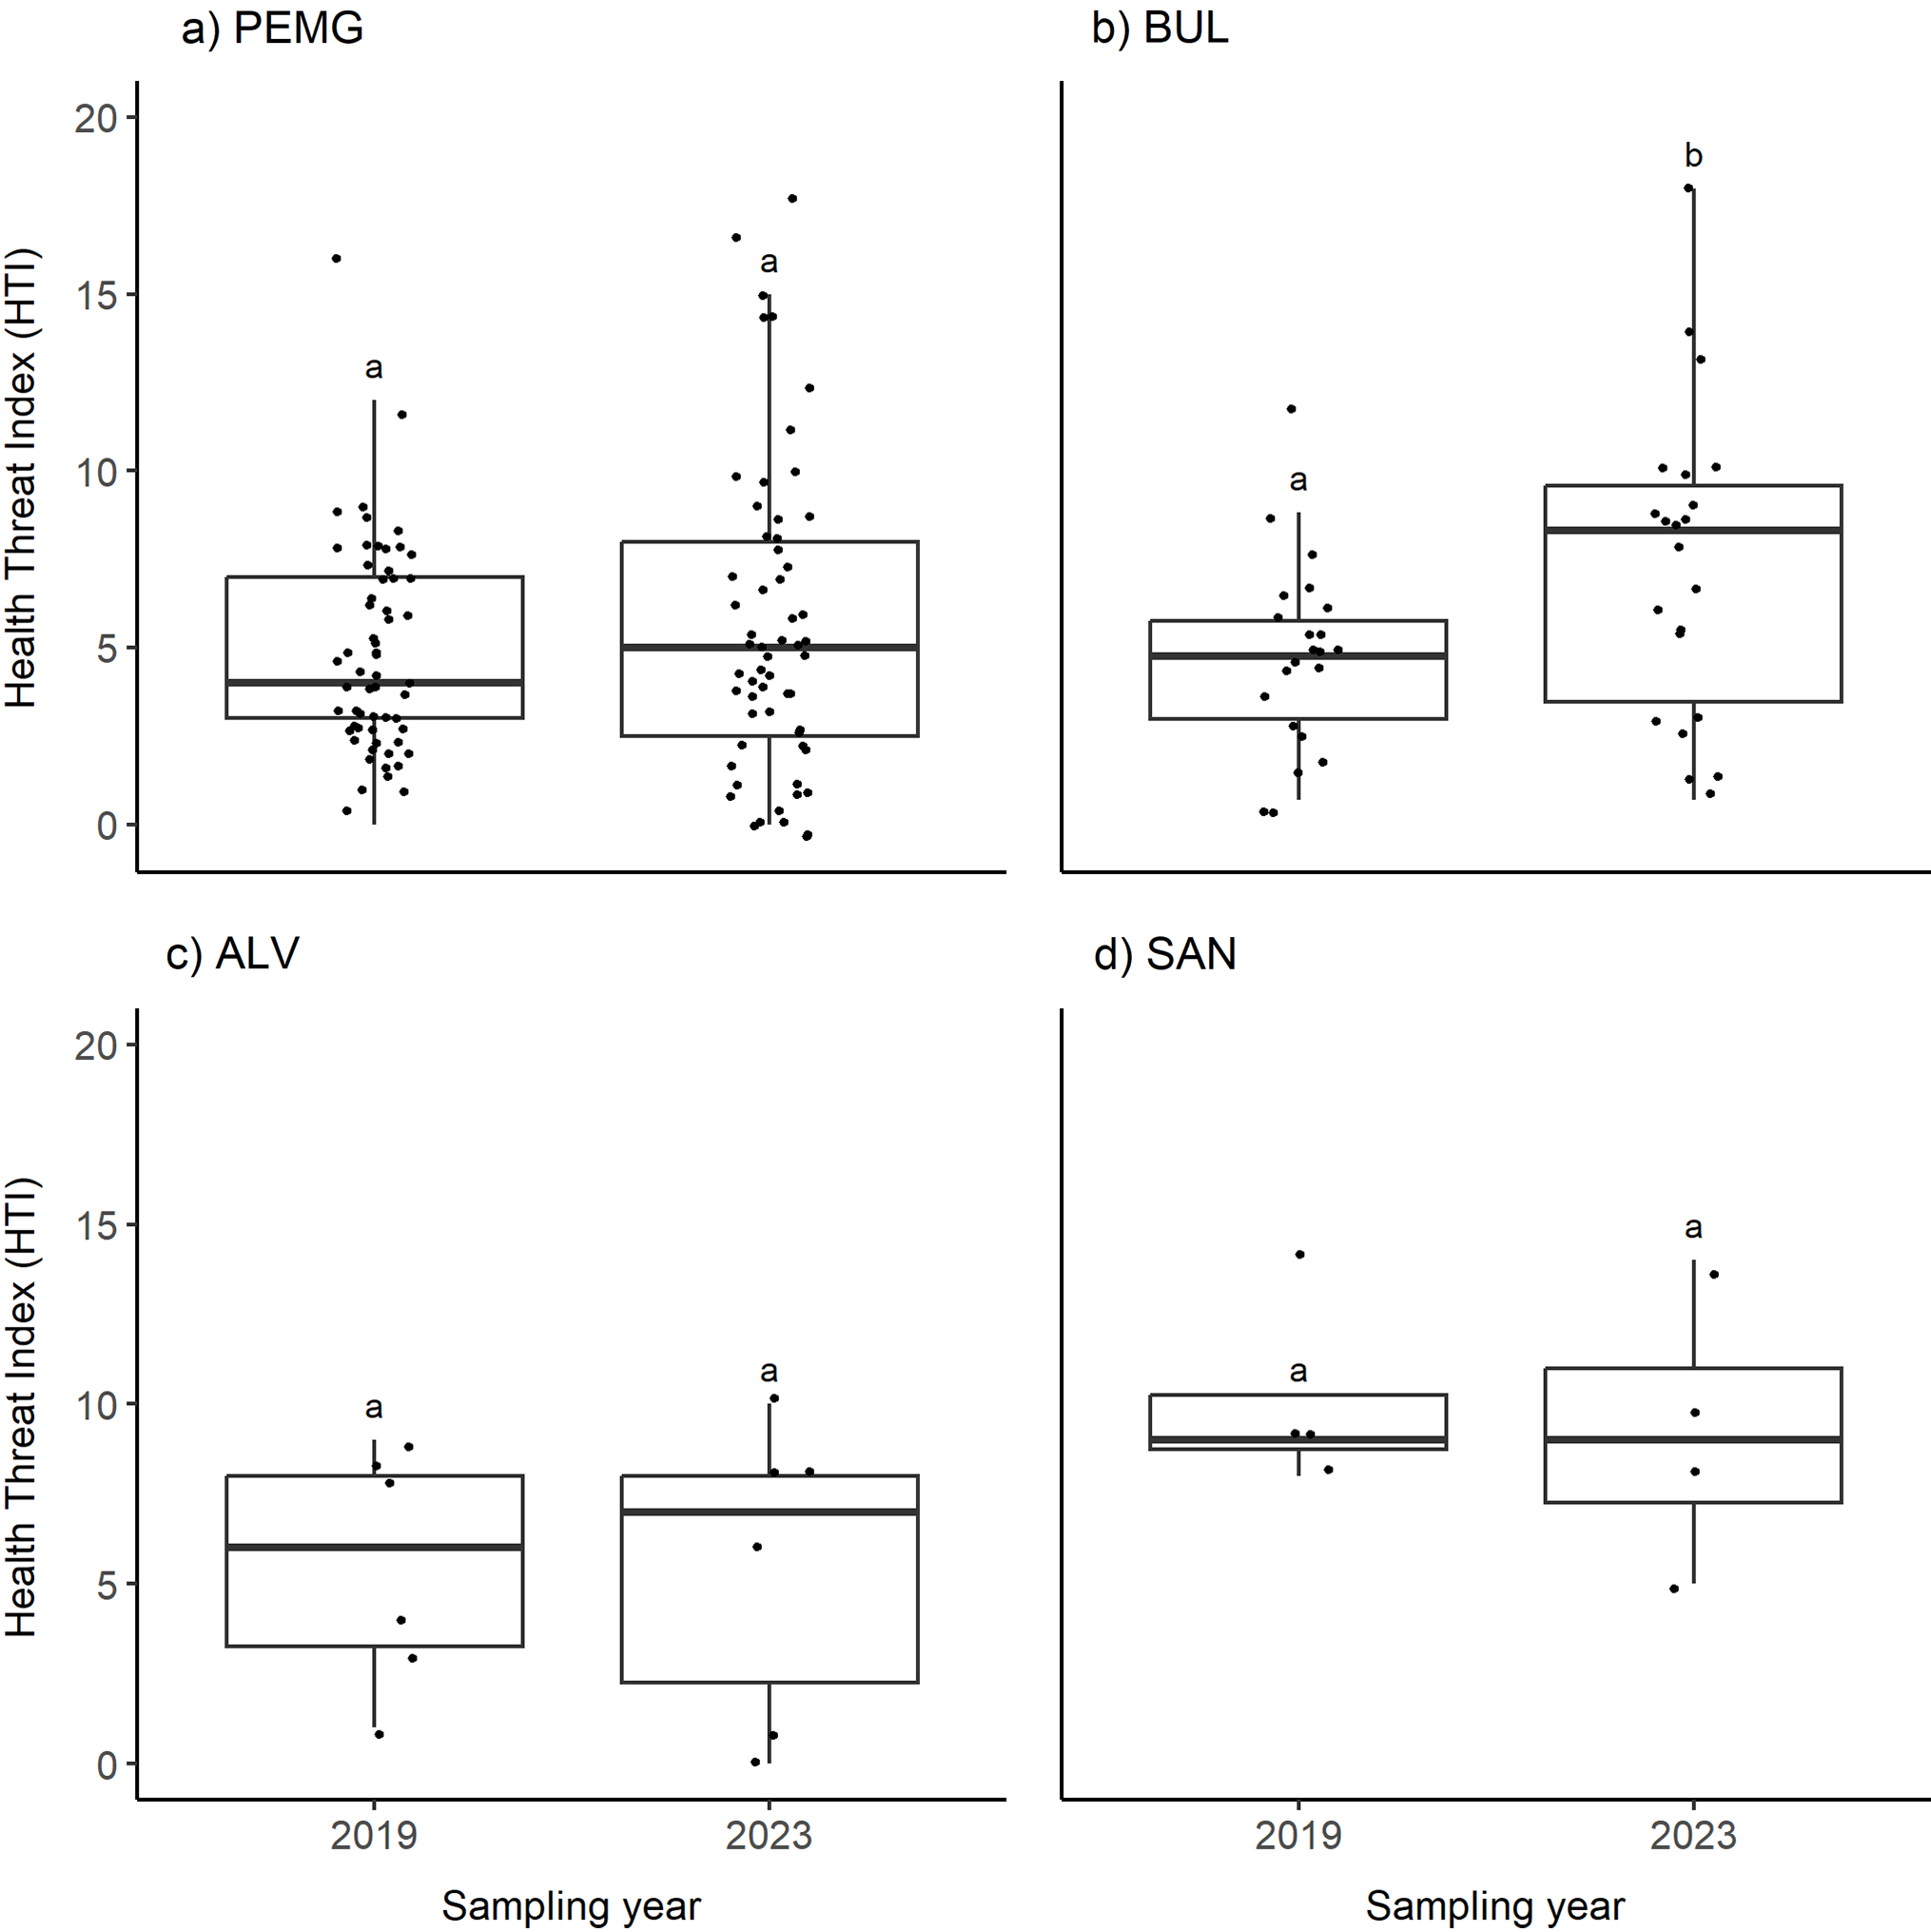
In the four forest fragments where the health of LTs was assessed in 2019 (Arcanjo et al. Reference Arcanjo, Taglianetti and Torezan2020) and reassessed in 2023, no statistically significant difference in HTI values was observed between the two assessments for PEMG, ALV, and SAN (p-value = 0.139; p-value = 1.000; p-value = 0.547, respectively; Table S6 and Figure 4). However, in BUL, the analysis revealed a significant increase in HTI values (p-value = 0.009; Table S6 and Figure 4).
Health Threat Index (HTI) of large trees (DBH ≥ 50 cm) sampled in 2019 and 2023 across 11 transects in four fragments of the Semi-deciduous Seasonal Forest, Paraná, Brazil. The HTI is a unitary value ranging from 0 to 33 and is represented per tree. (a) PEMG: Mata dos Godoy State Park; (b) BUL: Bule Farm; (c) ALV: Alvorada Farm; and (d) SAN: Santo Antônio Farm. Groups that do not share the same letter (above the boxplot) differ significantly (p < 0.05; paired t-test).

Health indicators in large trees: dead vs. alive
In the four fragments (PEMG, BUL, ALV, and SAN) that underwent two LT health assessments, a total of 10 LTs were identified as dead over the four-year period (Table S7).
In the individual analysis of the 11 indicators collected in 2019, liana infestation in the crown, partial crown death, and liana infestation in the stem were the most frequent indicators.
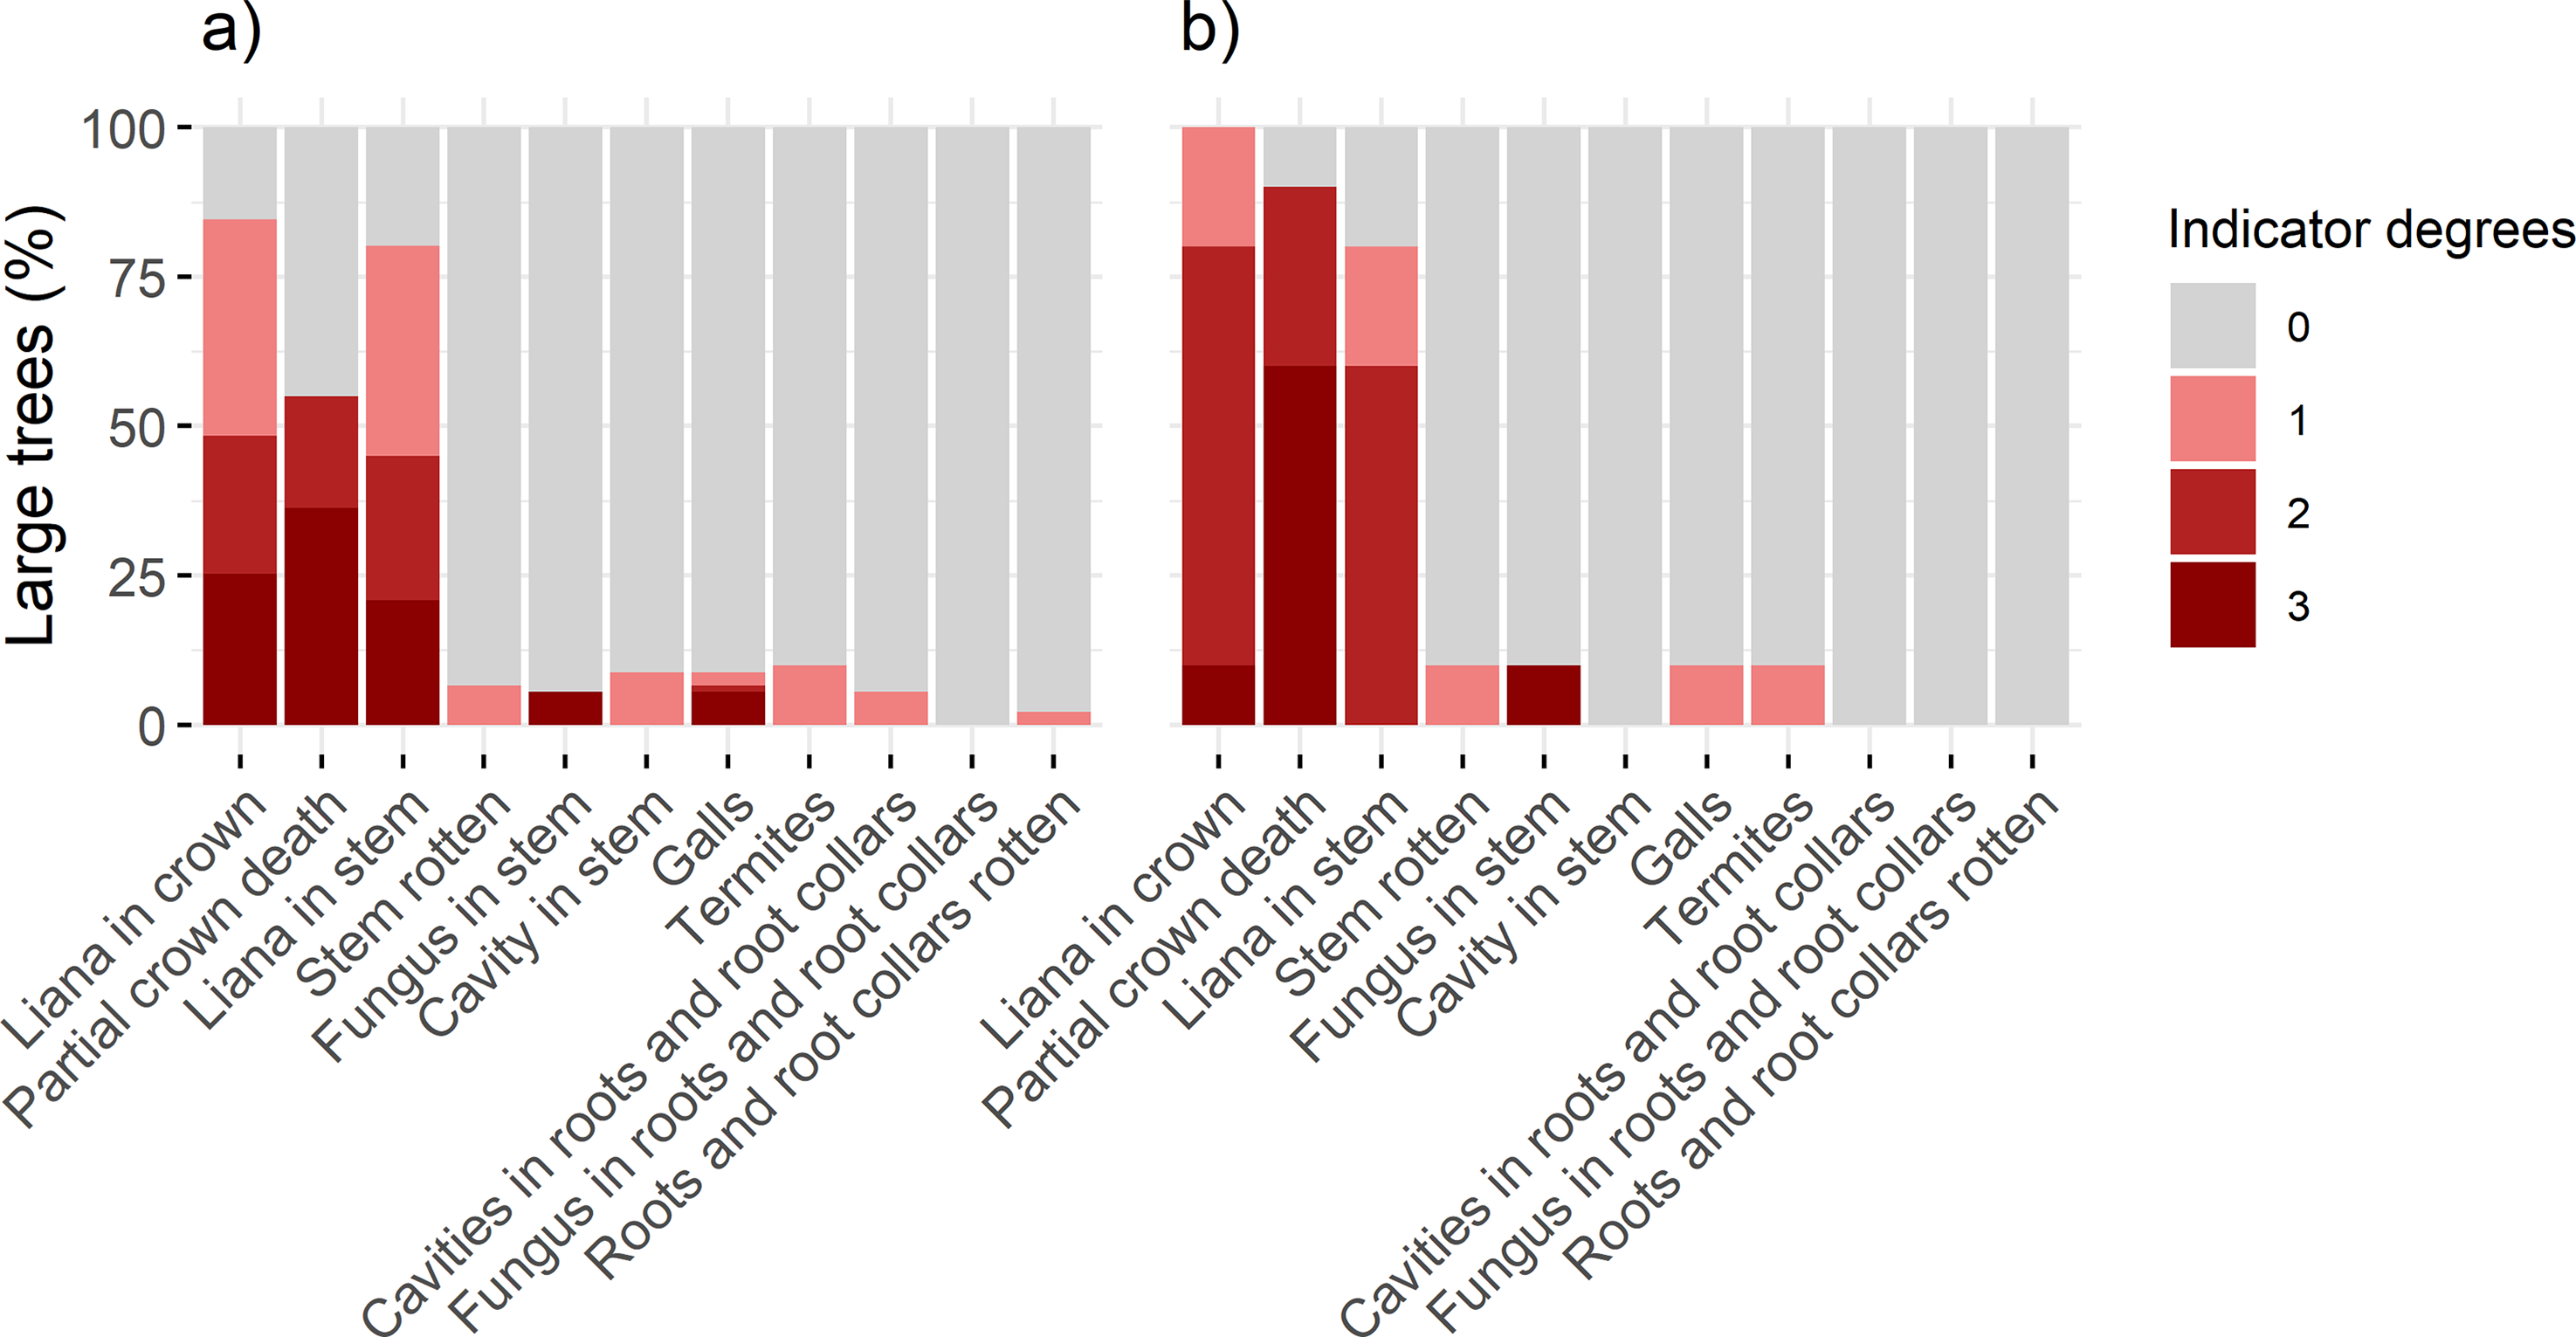
Regarding the presence of liana infestation in the crowns of LTs that remained alive in 2023, it was observed that in 2019, 84.6% exhibited this indicator at various degrees, while 100.0% of the LTs that died in 2023 had liana infestation in the crown in 2019. In 2019, 80.2% of the LTs that remained alive had liana infestation in the stem, and for the LTs that died in 2023, 80.0% had liana infestation in the stems in 2019 (Figure 5 and Table S8).
Frequency of health indicator grades in large trees (DBH ≥ 50 cm) sampled in 11 transects from four fragments of the Semi-deciduous Seasonal Forest, Paraná, Brazil. (a) Indicator grades in 2019 for trees that remained alive in the 2023 assessment (n = 91); (b) indicator grades in 2019 for trees that died in 2023 (n = 10).

Concerning partial crown death, it was found that in 2019, 54.9% of the LTs that remained alive had this indicator. However, among the LTs that died in 2023, these values were higher, reaching 90%, with a concentration in grade 3 (60.0%) (Figure 5 and Table S8).
As for the other health indicators (stem rotten, fungus in stem, cavity in stem, termites, galls, roots and root collars rotten, fungus in roots and root collars, cavities in roots and root collars), for LTs that remained alive in 2023, the maximum percentage of affected individuals was 9.9%, a value observed for termites. Among the individuals found dead in 2023, the maximum percentage of affected individuals was 10.0% for the indicators of stem rotten, fungus in stem, galls, and termites (Figure 5 and Table S8).
Discussion
For the eight evaluated fragments (PEMG, BUL, IBI, ALV, GRE, DOR, SAN, and MOR), the results suggested a higher incidence of health threats to the LTs within the first 50 m from the edge of the forest fragment. However, the influence of ED on the HTI depended on FS, with a clearer pattern observed in the largest fragment (PEMG). In the four forest fragments (PEMG, BUL, ALV, and SAN) that had two health assessments of LTs, one in 2019 and another in 2023, only the BUL fragment showed a significant increase in the HTI of the LTs over the four-year period. Also, in these fragments, regarding the LTs found dead in the 2023 assessment but alive in 2019, the health indicators that stood out as potential predictors of mortality were liana infestation in the crown and the presence of dead portions in the crown.
As observed by Kapos (Reference Kapos1989), microclimatic changes are most significant up to approximately 60 m from the edge towards the interior of the fragments. Therefore, the higher HTI values presented by the LTs within the first 50 m reflect less favourable environmental conditions for these individuals within this distance range. However, as the distance from the fragment edge increases, there is a reduction in the HTI values of the trees, showing that the edge effect is gradually attenuated as one moves inwards, as evidenced in previous works (Murcia Reference Murcia1995; Ries and Sisk Reference Ries and Sisk2004; Sampaio and Scariot Reference Sampaio and Scariot2011). This trend is best visualized in the PEMG, the largest sampled fragment (690 ha), which is better conserved (Torezan Reference Torezan2006) and has the highest number of evaluated LTs. According to the Area-Core model proposed by Ferreira and Laurance (Reference Ferreira and Laurance1997), areas smaller than 500 hectares experience a rapid intensification of edge effects, which may have hindered a more precise observation of the gradient of tree damage. Thus, the challenge in detecting edge effects in small fragments can be attributed to the synergy between edge and area effects, since high perimeter/area ratios result in these fragments lacking a core area (Malcolm Reference Malcolm1994). Therefore, for the fragments of BUL, IBI, ALV, GRE, DOR, and MOR, which have smaller areas and possibly an intensification of edge effects, the evaluated gradient of 250 m may be inadequate to reflect reductions in the HTI values of the LTs. Furthermore, in some of these fragments, the low density of LTs may have limited the detection of the influence of edge effects on these individuals.
In monitoring the LTs in four fragments (PEMG, BUL, ALV, and SAN) over a four-year interval, it is evident that only in the BUL fragment did a significant increase in the HTI values occur. The stability of HTI values in SAN and ALV is likely due to the fact that the few remaining LTs in these small fragments, which have a history of selective logging, already exhibited compromised health conditions at the beginning of the monitoring period. This may explain the lack of deterioration over the four years of evaluation. Additionally, small fragments are expected to have a scarcity or absence of species sensitive to edge effects (Laurance et al. Reference Laurance, Nascimento, Laurance, Andrade, Fearnside, Ribeiro and Capretz2006; Teixeira et al. Reference Teixeira, Soares-Filho, Freitas and Metzger2009), further reinforcing the degradation already established in these areas. On the other hand, BUL exhibits higher species richness among LTs, which implies greater variation in individual responses to environmental conditions due to interspecific differences in functional traits and disturbance sensitivity. This diversity also reflects the presence of species with a wide range of wood densities (Table S3), suggesting that the observed damage patterns are not restricted to a single functional strategy. This diversity may have contributed to the increase in HTI values over the four-year period, as species more sensitive to edge effects are still present in this fragment (Dantas et al. Reference Dantas, Alves Costa and Tabarelli2011).
Although PEMG also showed stable HTI values, the underlying reasons appear to differ from those observed in ALV and SAN. This is a large, well-preserved fragment, protected as a Conservation Unit since 1989 (Torezan Reference Torezan2006), which likely maintains more stable and favourable environmental conditions along the evaluated gradient. This preservation context may have helped maintain the health of LTs over the four years of monitoring, reinforcing the importance of Conservation UCs in safeguarding forest integrity (Ribeiro et al. Reference Ribeiro, Metzger, Martensen, Ponzoni and Hirota2009).
Monitoring trees over time plays a crucial role in identifying potential causes of their death, as well as allowing for the identification of distinct patterns characterizing a specific region (Laurance et al. Reference Laurance, Laurance, Nascimento, Andrade, Fearnside, Rebello and Condit2009). Thus, when individually analyzing the 11 health indicators of the LTs that died in the four fragments of the Semi-deciduous Seasonal Forest, it was observed that liana infestation and dead portions in the crown can be determinants of the tree mortality. This conclusion is supported by the HTI assessment conducted by Arcanjo et al. (Reference Arcanjo, Taglianetti and Torezan2020), which found that in 2019, 100% of the LTs that were found dead in 2023 had lianas in their crowns, and 90% exhibited some dead portions in the crown.
Several ecological functions make lianas important components of tropical forests. They provide food resources for fauna and serve as natural pathways between tree crowns, facilitating the movement of arboreal animals (Morellato and Leitão-Filho Reference Morellato and Leitão-Filho1996; Odell et al. Reference Odell, Stork and Kitching2019; Schnitzer et al. Reference Schnitzer, Michel, Powers and Robinson2020). Lianas can also contribute to gap regeneration (Schnitzer et al. Reference Schnitzer, Dalling and Carson2000) and influence the abundance and diversity of vertebrates and invertebrates, thereby affecting the composition of animal communities in tropical forests (Schnitzer Reference Schnitzer, Muller-Landa and Wright2024). Despite these roles, their marked increase in disturbed environments such as edges and forest fragments, driven by anthropogenic disturbances and climate change, has raised concerns about their negative effects on forest structure and functioning (Schnitzer Reference Schnitzer, Schnitzer, Bongers, Burnham and Putz2015; Schnitzer and Carson Reference Schnitzer and Carson2010). Lianas compete with trees for water, soil nutrients, and light (Schnitzer and Bongers Reference Schnitzer and Bongers2002; Schnitzer et al. Reference Schnitzer, Kuzee and Bongers2005), and they also reduce tree reproductive rates (Tabarelli et al. Reference Tabarelli, Mantovani and Peres1999). Upon reaching the crowns of trees, lianas form a dense cover of leaves that decreases light availability, negatively affecting tree growth (Ingwell et al. Reference Ingwell, Wright, Becklund, Hubbell and Schnitzer2010; Reis et al. Reference Reis, Marimon, Morandi, Elias, Esquivel-Muelbert, Marimon Junior, Fauset, de Oliveira, van der Heijden, Galbraith, Feldpausch and Phillips2020). Additionally, the dense mass of lianas on the crowns increases the load on the tree branches, resulting in increased mechanical stress (Schnitzer and Bongers Reference Schnitzer and Bongers2002), which can lead to damage to the branches or trunks of the supporting trees (Fontes et al. Reference Fontes, Chambers and Higuchi2018; Putz Reference Putz1984; Visser et al. Reference Visser, Schnitzer, Muller-Landau, Jongejans, de Kroon, Comita, Hubbell and Wright2018). Considering that lianas significantly increase near the edges of fragments and that LTs are particularly susceptible to infestation by these climbing plants (Putz Reference Putz1984), the presence of this indicator in all trees during the pre-mortem assessment suggests its association with the mortality of the LTs. This association has been highlighted by previous studies (Laurance et al. Reference Laurance, Andrade, Magrach, Camargo, Valsko, Campbell, Fearnside, Edwards, Lovejoy and Laurance2014; McDowell et al. Reference McDowell, Allen, Anderson-Teixeira, Brando, Brienen, Chambers, Christoffersen, Davies, Doughty, Duque, Espirito-Santo, Fisher, Fontes, Galbraith, Goodsman, Grossiord, Hartmann, Holm, Johnson, Kassim, Keller, Koven, Kueppers, Kumagai, Malhi, McMahon, Mencuccini, Meir, Moorcroft, Muller-Landau, Phillips, Powell, Sierra, Sperry, Warren, Xu and Xu2018), demonstrating that the proliferation of lianas can be identified as one of the main contributors to tree mortality.
Branch and trunk breakage, in addition to being caused by the weight of lianas, can also result from wind effects (Aleixo et al. Reference Aleixo, Norris, Hemerik, Barbosa, Prata, Costa and Poorter2019; Ribeiro et al. Reference Ribeiro, Chambers, Peterson, Trumbore, Marra, Wirth, Cannon, Négron-Juárez, Lima, de Paula, Santos and Higuchi2016). Due to their height and rigid, thick trunks, LTs are especially susceptible to toppling and breakage, particularly near the edges of fragments, where wind turbulence is intensified (Laurance et al. Reference Laurance, Ferreira, Rankin-de Merona and Laurance1998). Broken trees exhibit greater vulnerability to wind events and drought periods and have reduced growth rates due to the loss of photosynthetic area, which are factors that increase the risk of mortality (Fontes et al. Reference Fontes, Chambers and Higuchi2018). Over 90% of the individuals found dead in the second monitoring exhibited some portion of dead crown in the previous assessment, concentrated in more severe degrees of damage, with 60% of the trees found dead in 2023 having more than half of their crown dead in 2019. It is known that crown damage is the main determining factor for tree mortality (Arellano et al. Reference Arellano, Medina, Tan, Mohamad and Davies2019; Fontes et al. Reference Fontes, Chambers and Higuchi2018; Reis et al. Reference Reis, Marimon, Esquivel-Muelbert, Marimon and Morandi2022; Zuleta et al. Reference Zuleta, Arellano, Muller-Landau, McMahon, Aguilar, Bunyavejchewin, Cárdenas, Chang-Yang, Duque, Mitre, Nasardin, Pérez, Sun, Yao and Davies2021). Such damage, when more severe forms are present in the crown (>50% crown fragmentation), allows for the prediction of a decrease in growth rate and an increase in mortality probability (Rutishauser et al. Reference Rutishauser, Barthélémy, Blanc and Eric-Andre2011).
The other health indicators did not exhibit patterns that allow us to infer their relevance in the probability of tree mortality.
In this study, we observed a higher frequency of the assessed indicators within the first 50 m from the edge, with a gradual decrease in the HTI as LTs were farther from the edges, particularly in the largest fragment (PEMG). The second assessment of the health of LTs at the PELD-MANP sites provided initial insights into potential drivers of mortality for these trees. It was observed that the loads of lianas in the tree crowns, associated with crown breakage, seem to play a significant role in this process. Additionally, the resampling in the fragments showed that large and well-preserved areas, such as PEMG, may provide favourable conditions for the stability of the health of LTs over four years, even for species sensitive to edge effects. Targeted research, aimed at better understanding the main threats to LTs, is needed to develop effective conservation strategies. The lack of actions in this regard may lead to irreversible consequences, jeopardizing the survival of these important components in forest dynamics. Therefore, targeted management practices, such as localized liana cutting, should be tested to preserve tree health.
Supplementary material
The supplementary material for this article can be found at https://doi.org/10.1017/S0266467426100832.
Acknowledgements
We thank Alba L. Cavalheiro, Odair C. Pavão, Norival S. Cabo, and other members of the LABRE team for their help in the field and in laboratory activities.
Financial support
This study was part of the long-term ecological research site PELD MANP, supported by CNPq (grants 441540/2016-3, 441510/2020-5 and 445975/2024-5) and Fundação Araucária (41872.434.40722.27092013). The Coordenação de Aperfeiçoamento de Pessoal de Nível Superior – Brasil – CAPES provided a PhD scholarship for JOA (Finance Code 001).
Competing interests
The authors declare none.