Introduction
Sensitized nanostructured solar cells (SSCs) are considered to be one of the promising solar cell technologies in the near future. The dye-sensitized solar cell (DSSC; also called a Grätzel cell) is a prominent example of a general class of SSCs or sensitized bulk heterojunction solar cells. Sensitized solar cells consist of two continuous interpenetrating charge-conducting networks—one for electrons and one for holes. The interpenetrating network for electrons is typically a nanoporous (pores <100 nm) semiconducting metal oxide that serves as the host material. The network for holes constitutes the guest material that fills the pores of the host. The sensitizer (light absorbing material) is located at the extensive interface between the two networks. Sensitizers include dye moleculesReference O’Regan and Grätzel1 and quantized and nonquantized semiconductor structures (e.g., quantum dotsReference Robel, Subramanian, Kuno and Kamat2 and thin layersReference Levy-Clement, Tena-Zaera, Ryan, Katty and Hodes3) adsorbed or deposited onto the surface of the highly porous wide-bandgap nanocrystalline metal oxide films.
A characteristic feature of SSCs is that both light absorption and charge separation occur at the interface between the two interpenetrating conducting networks. In one scheme, the sensitizer could also serve as the charge-conducting phase.Reference Kaiser, Ernst, Fischer, Konenkamp, Rost, Sieber and Lux-Steiner4–Reference Wu, Jin, Hu and Bu6 In traditional DSSCs, the dye molecules are chemisorbed to the surface of titanium dioxide nanocrystalline films. The pores of the TiO2 film are filled with a liquid electrolyte containing the triiodide/iodide redox couple. Such cells have demonstrated solar conversion efficiencies over 11% under full sunlight (AM1.5 solar irradiance).Reference Grätzel7, Reference Chiba, Islam, Watanabe, Komiya, Koide and Han8 Increasing the light-harvesting efficiency of the sensitizer, the charge-injection (separation) efficiency at the heterojunction interface, and the charge-transport through the conducting networks to the charge-collecting electrodes could lead to still higher conversion efficiencies. A simple way to increase the light-harvesting efficiency of a DSSC is to increase the surface area of the nanoparticle film so as to accommodate more dye. This is usually done by increasing the thickness of a filmReference van de Lagemaat and Frank9 or decreasing the size of the crystallites comprising the film.Reference Zhu, Kopidakis, Neale, van de Lagemaat and Frank10 However, the increased surface area of a nanoparticle film also leads to slower transport and faster recombination.
As a result of the opposing effects of the light-harvesting and charge-collection processes, the theoretical solar conversion efficiency of a cell with a given dye is significantly greater than the conversion efficiency determined experimentally. For example, the highest reported certified efficiency (11.2%) was obtained with a cell sensitized with the so-called black dye (tri(cyanato)-2,2′,2′′-terpyridyl-4,4′,4′′-tricarboxylate)Ru(II)).Reference Chiba, Islam, Watanabe, Komiya, Koide and Han8 This cell produced a short-circuit photocurrent density (J sc) of 20.9 mA/cm2. In contrast, the theoretical maximum J sc for a cell with the same photocurrent threshold as the black dye (920 nm or 1.35 eV) is 34.4 mA/cm2, and the corresponding solar conversion efficiency is 19.6%.11 In practice, the cell efficiency can only be increased to a point where the gain in power generation from increased light harvesting equals the loss in power generation from increased recombination. Improving the light-harvesting efficiency of a cell containing a given sensitizer (e.g., black dye) without incurring a significant increase in recombination would require the development of more effective cell components. Such developments could lead to reduced recombination and improved light-harvesting and charge-injection efficiencies over the visible and near-infrared regions of the solar spectrum.
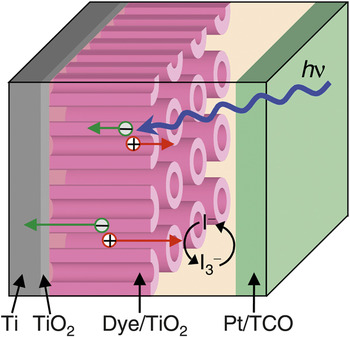
One strategy to reduce charge-carrier loss resulting from recombination in SSCs is to reduce the morphological disorder and dimensionality of the nanostructured films. The use of films constructed of oriented one-dimensional nanotube (NT)Reference Macak, Tsuchiya, Ghicov and Schmuki12–Reference Kuang, Brillet, Chen, Takata, Uchida, Miura, Sumioka, Zakeeruddin and Grätzel16 and nanowireReference Law, Greene, Johnson, Saykally and Yang17–Reference Feng, Shankar, Varghese, Paulose, Latempa and Grimes21 arrays, aligned orthogonally to the electron-collecting substrate, is representative of this approach. Figure 1 illustrates a DSSC incorporating an oriented TiO2 NT array. The attractiveness of NT arrays for SSCs include their large surface areas,Reference Zhu, Neale, Miedaner and Frank14, Reference Mor, Varghese, Paulose, Shankar and Grimes22, Reference Macak, Tsuchiya, Ghicov, Yasuda, Hahn, Bauer and Schmuki23 direct charge-conducting pathways,Reference Mor, Varghese, Paulose, Shankar and Grimes22–Reference Zhu, Vinzant, Neale and Frank24 and linear pore arrangement, which could facilitate infiltration of solid/semi-solid charge conductors.Reference Mor, Shankar, Paulose, Varghese and Grimes25
Schematic diagram of dye-sensitized solar cells using oriented TiO2 nanotube arrays. Photoexcited dyes inject electrons into the TiO2 and redox species (triiodide/iodide) in the electrolyte transport holes from oxidized dye molecules to the counter electrode. The injected electrons diffuse through the TiO2 network to the collecting transparent conducting oxide (TCO) substrate. Reprinted with permission from Reference Reference Zhu, Neale, Miedaner and Frank14. ©2007, American Chemical Society.

Nanotube fabrication and morphology
Titania nanotubes (NTs) have been prepared by several methods, including electrochemical anodization,Reference Gong, Grimes, Varghese, Hu, Singh, Chen and Dickey26, Reference Beranek, Hildebrand and Schmuki27 hydrothermal synthesis,Reference Kasuga, Hiramatsu, Hoson, Sekino and Niihara28, Reference Chen, Zhou, Du and Peng29 and template-assisted synthesis.Reference Hoyer30, Reference Sander, Cote, Gu, Kile and Tripp31 Electrochemical anodization of Ti metal is a relatively simple approach for altering the morphological properties of NT arrays, such as their pore diameter, wall thickness, intertube spacing, and tube length.Reference Cai, Paulose, Varghese and Grimes32–Reference Paulose, Shankar, Yoriya, Prakasam, Varghese, Mor, Latempa, Fitzgerald and Grimes34 The electrochemical anodization of titanium metal to form ordered titanium oxide nanostructures was first reported in 1999.Reference Zwilling, Darque-Ceretti, Boutry-Forveille, David, Perrin and Aucouturier35 In the past several years, the electrochemical parameters controlling the morphological properties of the NT arrays have been extensively studied.Reference Mor, Varghese, Paulose, Shankar and Grimes22, Reference Macak, Tsuchiya, Ghicov, Yasuda, Hahn, Bauer and Schmuki23 The electrochemical setup for preparing the titanium oxide arrays consists of either twoReference Mor, Varghese, Paulose, Shankar and Grimes22 or three electrodesReference Macak, Tsuchiya, Ghicov and Schmuki12 in a fluoride-containing electrolyte. In either setup, the anodization of the Ti metal occurs at the working electrode. Figure 2 shows typical scanning electron microscopy (SEM) images of self-aligned anodized NT arrays.Reference Prakasam, Shankar, Paulose, Varghese and Grimes36 The bottom of the NTs (Figure 2a) are closed, whereas the top of the NT structures (Figure 2b) are fully open. The side views of the arrays (Figure 2c and 2d) indicate that individual NTs are spatially separated. Both bottom and top images (Figure 2a and 2b) show that the NTs are closely packed in approximately hexagonal symmetry. Information about the morphological properties of the NT structures (e.g., pore diameter, wall thickness, center-to-center NT spacing, and NT length) is normally obtained from analyses of such SEM images. By varying electrochemical and chemical parameters (e.g., applied voltage, duration of anodization, temperature, solution pH, electrolyte composition, and concentration), one can control the morphological properties. For instance, depending on the conditions of synthesis, the pore diameter can range from 10 to 250 nm,Reference Ghicov and Schmuki37–Reference Shankar, Mor, Prakasam, Yoriya, Paulose, Varghese and Grimes39 the wall thickness from 5 to 34 nm,Reference Mor, Shankar, Paulose, Varghese and Grimes33, Reference Shankar, Mor, Fitzgerald and Grimes38 and the film thickness from a few hundred nanometers to more than 1000 μm.Reference Cai, Paulose, Varghese and Grimes32, Reference Ghicov and Schmuki37, Reference Paulose, Prakasam, Varghese, Peng, Popat, Mor, Desai and Grimes40
Illustrative scanning electron microscopy images of (a) bottom, (b) top, and (c and d) side views of nanotube films that were prepared by anodizing Ti foils in a fluoride-containing electrolyte. Reprinted with permission from Reference Reference Prakasam, Shankar, Paulose, Varghese and Grimes36. ©2007, American Chemical Society.

The self-ordering and growth mechanisms of titanium oxide NTs are similar to the ones determining the growth of ordered porous alumina.Reference Berger, Tsuchiya and Schmuki41 Although the mechanism for forming titanium oxide NT arrays from the electrochemical anodization of titanium is not fully understood, it is generally accepted that the formation of the oxide layer and its electric field-assisted dissolution occur concomitantly and that the pore growth proceeds from the pore bottom toward the oxide-metal interface.Reference Mor, Varghese, Paulose, Shankar and Grimes22, Reference Macak, Tsuchiya, Ghicov, Yasuda, Hahn, Bauer and Schmuki23 In fluoride-containing electrolytes, the net ionic reactions for the dissolution of titanium oxideReference Bright and Readey42 and the oxidation of titanium metal are described byReference Kim, Noh, Zhu, Halverson, Neale, Park, Hong and Frank43


Other variations of these reactions have also been proposed to account for the oxidation and dissolution processes.Reference Cai, Paulose, Varghese and Grimes32, Reference Macak, Tsuchiya and Schmuki44 The anodization mechanism has also been modeled theoretically.Reference Su and Zhou45, Reference Bhargava, Nguyen and Devine46 Further details about the self-ordering anodization process for forming TiOx NTs are described elsewhere.Reference Mor, Varghese, Paulose, Shankar and Grimes22, Reference Macak, Tsuchiya, Ghicov, Yasuda, Hahn, Bauer and Schmuki23 The morphology and growth rate of NTs depend strongly on the distribution of electric field across the oxide layer between Ti and NTs.Reference Macak, Tsuchiya, Ghicov, Yasuda, Hahn, Bauer and Schmuki23, Reference Prakasam, Shankar, Paulose, Varghese and Grimes36 For example, the pore diameter of the NTs increases linearly with the applied voltage.Reference Cai, Paulose, Varghese and Grimes32, Reference Bauer, Kleber and Schmuki47–Reference Xie, Adams, Blackwood and Wang49 For a given electrolyte and anodization potential, the length of the NT increases with the anodization timeReference Zhu, Neale, Miedaner and Frank14, Reference Cai, Paulose, Varghese and Grimes32, Reference Xie, Adams, Blackwood and Wang49, Reference Chen, Chung, Chen, Lu, Lan, Chen, Luo, Hung and Diau50 until equilibration between oxide formation and the dissolution process is reached.Reference Ghicov, Tsuchiya, Macak and Schmuki51
Comparison of nanotube and nanoparticle films
Oriented TiO2 NT arrays (Figures 1 and 2) have several structural features that are advantageous for sensitized solar cells: (1) direct (monolithic) electron conducting pathways, (2) a linear pore system for facilitating ion conduction, and (3) large surface areas for accommodating the sensitizer. With a sufficient pore diameter and intertube spacing, both the interior and exterior surfaces of NT walls are available for dye adsorption and are accessible to ions in the electrolyte.Reference Zhu, Neale, Miedaner and Frank14 In addition, the roughness factor (RF; ratio of the total internal surface area to the projected surface area) of NT films with thicknesses in the region of 14–20 μm can be as much as 1800–3000,Reference Shankar, Basham, Allam, Varghese, Mor, Feng, Paulose, Seabold, Choi and Grimes52 which is comparable to that of the TiO2 nanoparticle (NP) films used in the state-of-the-art DSSCs.Reference O’Regan and Grätzel1, Reference Nazeeruddin, Kay, Rodicio, Humphrybaker, Muller, Liska, Vlachopoulos and Grätzel53 Over the past several years, the solar conversion efficiency of TiO2 NT-based DSSCs containing the conventional liquid triiodide/iodide electrolyte have steadily climbed from an initial 1–3% levelReference Macak, Tsuchiya, Ghicov and Schmuki12–Reference Zhu, Neale, Miedaner and Frank14 to the 7–9% level,Reference Chen, Chung, Chen, Lu, Lan, Chen, Luo, Hung and Diau50, Reference Lin, Yu and Chien54, Reference Wang and Lin55 which approaches the 11–12% efficiencies of the state-of-the-art TiO2 NP-based DSSCs.Reference Grätzel7, Reference Chiba, Islam, Watanabe, Komiya, Koide and Han8, Reference Yu, Wang, Yi, Zu, Zhang, Zhang and Wang56
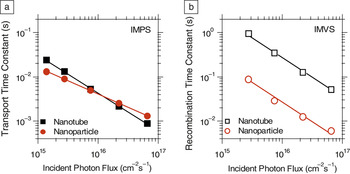
To date, the number of published studies focusing on NT preparation far exceeds those concerned with the charge-transport and recombination properties of TiO2 NT-based DSSCs.Reference Mor, Shankar, Paulose, Varghese and Grimes13–Reference Jennings, Ghicov, Peter, Schmuki and Walker15, Reference Zhu, Vinzant, Neale and Frank24Figure 3 compares the light-intensity dependence of the transport and recombination time constants of DSSCs containing NP and NT films. The film thicknesses (ca. 4 μm) and porosities (65 ± 5%) were about the same.Reference Zhu, Neale, Miedaner and Frank14 The average nanocrystallite sizes (26 ± 2 nm), as determined by XRD, were also similar. Figure 3a shows that transport time constants (τc) of electrons in the NT and NP films display similar power-law dependence on the incident light intensity (I 0). For NP films, this power-law dependence has normally been attributed to electrons undergoing multiple trapping and detrapping during their transit through a film.Reference Cao, Oskam, Meyer and Searson57–Reference Bisquert and Vikhrenko63 The light-intensity dependence of the transport time constants for NT films suggests that similar mechanistic factors determine transport in NT films. However, because the slopes of the plots differ, the distribution and density of transport-limiting traps in the NT and NP films also likely differ.Reference van de Lagemaat and Frank9, Reference Nelson, Haque, Klug and Durrant59Figure 3b shows that the recombination time constants (τr) for the NT arrays are 10 times longer than those for the NP films, suggesting that fewer potential recombination sites exist in the NT films than in NP films. The transport and recombination measurements indicate that the charge-collection efficiency for the NT films is higher than that for the NP films. The electron diffusion length in TiO2 NT films is reported to be on the order of 100 μm, implying that the charge-collection efficiencies of NT-based DSSCs are high.Reference Jennings, Ghicov, Peter, Schmuki and Walker15
Light intensity dependence of (a) transport and (b) recombination time constants for nanotube- and nanoparticle-based dye-sensitized solar cells. The nanotube and nanoparticle films have similar transport times, whereas recombination is 10 times slower in the nanotube films. IMPS, intensity-modulated photocurrent spectroscopy; IMVS, intensity-modulated photovoltage spectroscopy. Reprinted with permission from Reference Reference Zhu, Neale, Miedaner and Frank14. ©2007, American Chemical Society.

At present, there is no definitive explanation for why electron transport is not significantly faster and recombination is one order of magnitude slower in NT films than in NP films. There is evidence that certain traps play a role in determining the dynamics of transport and recombination.Reference Zhu, Vinzant, Neale and Frank24, Reference Richter and Schmuttenmaer64, Reference Fabregat-Santiago, Barea, Bisquert, Mor, Shankar and Grimes65 Terahertz spectroscopy measurements of dye-sensitized TiO2 NT arrays suggest that exciton-like trap states close to the conduction band slow transport on the picosecond to femtosecond time scales.Reference Richter and Schmuttenmaer64 It has also been reportedReference Fabregat-Santiago, Barea, Bisquert, Mor, Shankar and Grimes65 that the density and distribution of electron trapping sites depend on the concentration of protons in solution. These studies provide valuable insight into the transport and recombination mechanisms of TiO2 NT films and suggest that further studies are needed.
Analyses of photocurrent measurements indicate that the light-harvesting efficiency is 20% higher in NT-based DSSCs than in NP-based DSSCs.Reference Zhu, Neale, Miedaner and Frank14 Because both NT and NP films have the same amount of dye loading, the higher light harvesting was attributed to stronger internal light-scattering effects in the NT films.Reference Zhu, Neale, Miedaner and Frank14 Consistent with this observation, a recent study has demonstrated that a TiO2 NT layer has a similar light scattering effect as that of the conventional submicron-sized TiO2 particle layer when deposited on top of the TiO2 NP film in a bilayer structure of a TiO2 photoelectrode in DSSCs.Reference Nakayama, Kubo and Nishikitani66 Also, polarized micro-Raman spectroscopy measurements indicate increased light scattering along the cylindrical NT structure.Reference Likodimos, Stergiopoulos, Falaras, Kunze and Schmuki67 Another study showed that improving the orientational order of the NT arrays by using the supercritical CO2 drying technique enhanced the light-harvesting and charge-collection properties of TiO2 NT-based DSSCs.Reference Zhu, Vinzant, Neale and Frank24 Other approaches to increase order in NT films have also been investigated.Reference Shin and Lee68–Reference Macak, Albu and Schmuki72 Preparing NT arrays on nonplanar substrates has been suggested to increase the amount of internal light scattering in a film.Reference Shankar, Basham, Allam, Varghese, Mor, Feng, Paulose, Seabold, Choi and Grimes52 Fabricating TiO2 NT films on a transparent conductive oxide (TCO) substrate rather than on the commonly used nontransparent Ti substrate is still another way to improve light absorption.Reference Mor, Shankar, Paulose, Varghese and Grimes13, Reference Kim, Noh, Zhu, Halverson, Neale, Park, Hong and Frank43, Reference Ghicov, Alba, Macak and Schmuki73
Annealing effect on nanotube microstructure and charge transport
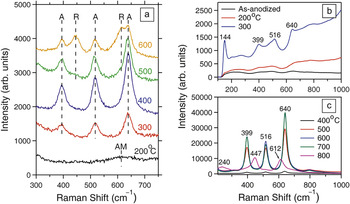
As-grown titanium oxide arrays are amorphous and must be thermally converted to the anatase phase of TiO2 to have electronic properties (e.g., electron conductivity and energetic band position) suitable for SSC applications. The crystalline structure, crystallite size, and NT structure depend strongly on the annealing temperature, its duration, and surrounding environment (e.g., air, O2, Ar, and N2).Reference Lai, Sun, Chen, Zhuang, Lin and Chin48, Reference Likodimos, Stergiopoulos, Falaras, Kunze and Schmuki67, Reference Varghese, Gong, Paulose, Grimes and Dickey74–Reference Zhu, Neale, Halverson, Kim and Frank78Figure 4a shows the Raman spectra of NT films on a Ti substrate annealed at temperatures ranging from 200 to 600°C.Reference Zhu, Neale, Halverson, Kim and Frank78 When annealed at 200°C, NT films display a broad band of Raman shift, similar to that of the as-deposited amorphous NT films. At an annealing temperature (T a) of 300°C, the NTs display three bands that are characteristic of the TiO2 anatase phase. Heating the film to 400°C causes significant growth in these bands. High-resolution TEM imagesReference Zhu, Neale, Miedaner and Frank14 indicate that at 400°C, the NTs are fully crystalline anatase. Thus, increasing T a from 200 to 400°C transformed the as-deposited NT film from the amorphous state (200°C) to partially crystalline anatase (300°C) to fully crystalline anatase TiO2 (400°C). When the NT film is annealed at 500°C, two additional bands associated with the TiO2 rutile phase are observed. The intensities of these rutile bands increase substantially when T a is elevated from 500 to 600°C. Consistent with these observations, several studies have found that anatase starts to form at about 300°C, and rutile is produced at 450°C or higher temperatures.Reference Macak, Tsuchiya, Ghicov, Yasuda, Hahn, Bauer and Schmuki23, Reference Lai, Sun, Chen, Zhuang, Lin and Chin48, Reference Likodimos, Stergiopoulos, Falaras, Kunze and Schmuki67, Reference Varghese, Gong, Paulose, Grimes and Dickey74–Reference Alivov, Pandikunta, Nikishin and Fan77 XRD studies showed that the rutile crystallites formed in the NT walls originated from the formation of rutile in the Ti substrate.Reference Zhu, Neale, Halverson, Kim and Frank78 In the absence of Ti substrate, the anatase-to-rutile phase transformation is found to occur at temperatures greater than 600°C.Reference Zhu, Neale, Halverson, Kim and Frank78 For instance, Figure 4b and 4c shows that in the absence of the Ti substrate, freestanding NT films display a pure anatase phase at annealing temperatures below 700°C. The rutile phase is observed when the freestanding NT films were annealed at 800°C.Reference Wang, Zhao, Lin and Lin76 It has also been shown in the case of NT arrays prepared on Ti substrates that once rutile is present in the NT walls, the rutile crystallites further catalyze the anatase-to-rutile transformation, resulting in a significant breakdown of the NT walls at temperatures below 600°C.Reference Zhu, Neale, Halverson, Kim and Frank78 For freestanding NT films, the breakdown occurred at 800°C.Reference Wang, Zhao, Lin and Lin76
Effect of annealing temperature on the crystallinity of nanotube films. (a) Raman spectra of nanotube films on Ti substrates annealed at 200–600°C. A, anatase; R, rutile; AM, amorphous. Reprinted with permission from Reference Reference Bauer, Kleber and Schmuki47. ©2010, American Chemical Society. (b, c) Raman spectra of freestanding nanotube films annealed at 200–800°C. Reproduced with permission from Reference Reference Wang, Zhao, Lin and Lin76. ©2009, Royal Society of Chemistry.

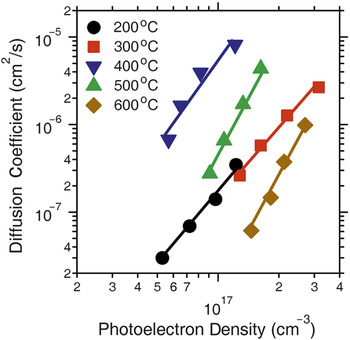
Figure 5 shows the effect of T a on the electron diffusion coefficient (D) as a function of the photoelectron density (n) in DSSCs incorporating NT films prepared on Ti substrates. At a fixed n, D varies significantly with T a. The electron diffusion coefficient is constant from 200 to 300°C. It increases by one order of magnitude from 300 to 400°C and then declines by two orders of magnitude from 400 to 600°C. The changes of D with annealing temperature are related to the effect that T a has on NT morphology and crystal structures. When T a increases from 200 to 300°C, D changes very little, implying that the amorphous component of the NTs determines the behavior of D at 300°C, and that the anatase TiO2 crystallites are more or less isolated from one another in an amorphous matrix. Recently, it has been reported that the amorphous phase retards electron transport in dye-sensitized titanium oxide NT films.Reference Martinson, Elam, Liu, Pellin, Marks and Hupp79 When T a is elevated from 300 to 400°C, D increases by more than one order of magnitude, owing to the presence of fewer traps in the higher crystalline material. When T a is increased from 400 to 600°C, transport becomes slower, a phenomenon that correlates with the formation of rutile crystallites in the anatase NT walls and the breakdown of the walls.Reference Zhu, Neale, Halverson, Kim and Frank78
Photoelectron density dependence of the electron diffusion coefficient for dye-sensitized solar cells containing nanotube films annealed at 200–600°C. At a fixed photoelectron density, the electron diffusion coefficient depends strongly on the annealing temperature. Reprinted with permission from Reference Reference Zhu, Neale, Halverson, Kim and Frank78. ©2010, American Chemical Society.

These results indicate that it would be worthwhile to develop strategies to increase the crystallinity of the NTs while maintaining the integrity of the NT architecture. In this regard, it was recently reported that rapid infrared annealing of anodized films for a relatively short period (e.g., several minutes) leads to the crystallization of the NT walls to anatase and suppresses the growth of rutile from the Ti substrate.Reference Allam and Grimes80 Even more encouraging, an anodization method has been developed for crystallizing TiO2 NT arrays without thermal annealing.Reference Allam, Shankar and Grimes81 In this approach, the Ti metal was pretreated (oxidized) in H2O2-containing electrolytes and then anodized potentiostatically in fluoride-containing media.
Semiconductor sensitized heterojunctions
Using inorganic semiconductor sensitizers could potentially enhance the light absorption properties of solar cells, especially in the near infrared region of the solar spectrum. In general, inorganic semiconductors can be introduced into the nanoporous TiO2 network in three forms: (1) nanocrystals linked to the TiO2 surface, (2) conformal semiconductor layers covering the TiO2 surface, and (3) semiconductors completely filling the TiO2 pore system. In the latter form, the semiconductor could be used as both the sensitizer and hole conductor. Various semiconductors (e.g., CdS,Reference Sun, Yu, Pan, Gao, Chen and Peng82–Reference Shin, Il Seok, Im and Park85 CdSe,Reference Kongkanand, Tvrdy, Takechi, Kuno and Kamat86–Reference Chen, Paulose, Ruan, Mor, Varghese, Kouzoudis and Grimes88 CdTe,Reference Gao, Li, Sun, Chen, Tang and Peng89, Reference Seabold, Shankar, Wilke, Paulose, Varghese, Grimes and Choi90 Sb2S3,Reference Moon, Itzhaik, Yum, Zakeeruddin, Hodes and Grätzel91 In2S3,Reference Sarkar, Kim, Goldstein, Neale, Zhu, Elliot, Frank and George92 CuInS2,Reference Nanu, Schoonman and Goossens93, Reference Nanu, Schoonman and Goossens94 and CuInSe2Reference Wang, Zhu, Neale and Frank5) have been deposited into TiO2 nanoporous films (including TiO2 NTs) by a variety of means, such as chemical bath deposition,Reference Sun, Yu, Pan, Gao, Chen and Peng82, Reference Shen, Yamada, Tamura and Toyoda87, Reference Moon, Itzhaik, Yum, Zakeeruddin, Hodes and Grätzel91 sensitization with pre-synthesized nanocrystals,Reference Kongkanand, Tvrdy, Takechi, Kuno and Kamat86, Reference Gao, Li, Sun, Chen, Tang and Peng89 successive ionic layer adsorption and reaction,Reference Baker and Kamat84 spray pyrolysis,Reference Shin, Il Seok, Im and Park85, Reference Nanu, Schoonman and Goossens94 atomic layer deposition,Reference Sarkar, Kim, Goldstein, Neale, Zhu, Elliot, Frank and George92, Reference Nanu, Schoonman and Goossens93 and electrodeposition.Reference Wang, Zhu, Neale and Frank5, Reference Banerjee, Mohapatra, Das and Misra83, Reference Chen, Paulose, Ruan, Mor, Varghese, Kouzoudis and Grimes88, Reference Seabold, Shankar, Wilke, Paulose, Varghese, Grimes and Choi90, Reference Macak, Gong, Hueppe and Schmuki95 Among these techniques, electrochemical deposition is a facile and versatile technique for depositing semiconductors in insulating nanoporous films. However, it has been synthetically challenging to electrochemically deposit a semiconductor throughout the entire pore network of TiO2 films when they are electrically conducting. The challenge arises from the small pore size and electrical conductivity of TiO2. This combination typically results in the p-type semiconductor forming an overlayer that blocks the pores, preventing complete pore filling.Reference Wang, Zhu, Neale and Frank5, Reference Chen, Paulose, Ruan, Mor, Varghese, Kouzoudis and Grimes88, Reference Seabold, Shankar, Wilke, Paulose, Varghese, Grimes and Choi90, Reference Macak, Gong, Hueppe and Schmuki95
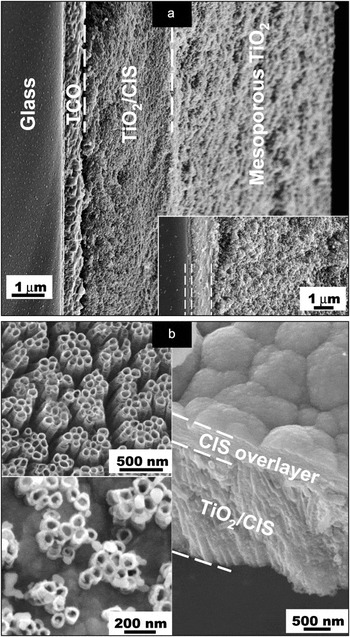
To address this issue, a general approach for electrochemically growing p-type semiconductors in the nanopores of electrically conducting TiO2 films was recently developed.Reference Wang, Zhu, Neale and Frank5 The critical parameter determining the spatial growth profile of the semiconductor in the pores is the ambipolar diffusion length (L amb). The ambipolar diffusion length, which describes the average distance electrons travel in the TiO2 network starting from the conducting substrate before reacting with the precursor ions in the electrolyte, can be tuned by changing the composition of the deposition solution. When L amb is much less than the film thickness L film, the growth of the semiconductor begins at the interface between the conducting substrate and the TiO2 film and progresses upward to fill the pore network completely. As an illustration, Figure 6 shows the electrochemical deposition of p-CuInSe2 (CIS) in nanoporous TiO2 NT and NP films from an absolute ethanol solution containing the semiconductor precursor ions. Analyses of the capacitance–voltage data showed that for this solution condition, L amb is about 1/30 of the film thickness (8 μm), which corresponds to about 300 nm. This estimate indicates that the interfacial electron transfer reaction is constrained within a narrow spatial region close to the TiO2/conducting substrate interface. In concurrence with this estimate, Figure 6a shows that during the early stage (inset), the growth of the p-CuInSe2 phase in a NP film is constrained to the spatial region near the conducting substrate. The main SEM image (Figure 6a) shows that at a later time, the CIS phase fills the bottom third of the NP film. Figure 6b shows the spatial growth of CIS in TiO2 NT films. The upper left image shows an empty TiO2 NT array. The lower left image in Figure 6b shows that the CuInSe2 partially fills the NT array during an early stage. The right SEM image shows CIS completely filling the pores and forming a thin overlayer on top of the NTs at a later time. In contrast, capacitance–voltage measurements indicate that adding a small amount of water (5 vol%) to the ethanol deposition solution containing the semiconductor precursor species extends L amb to values comparable to or greater than the 8-μm film thickness. As a result, CIS deposits form on the outer surface the TiO2 films,Reference Wang, Zhu, Neale and Frank5 implying that when L amb ≥ L film, CIS builds up near the top of the film, which impedes complete pore filling.
Scanning electron microscopy images of CIS (p-CuInSe2) deposition in the TiO2 nanoparticle and oriented nanotube films for the cases where the CIS deposition solution contains absolute ethanol. (a) Cross-sectional view of CIS/TiO2 nanoparticle film. Lower right inset shows CIS/TiO2 nanoparticle film after a short deposition time. TCO, transparent conductive oxide. (b) Upper left inset shows a surface view of nanotube array before deposition. Lower left inset shows a partially filled nanotube array during an early stage of deposition. Right image shows a cross-sectional view of a CIS/TiO2 nanotube film with a CIS overlayer during a later stage of deposition. Reprinted with permission from Reference Reference Wang, Zhu, Neale and Frank5. ©2009, American Chemical Society.

A two-step electrochemical deposition approach has also been developed to avoid the formation of a pore-blocking layer.Reference Seabold, Shankar, Wilke, Paulose, Varghese, Grimes and Choi90 In this approach, the pores were filled by alternately dipping the TiO2 electrodes in precursor solution followed by electrodeposition in an inert electrolyte. Using this approach, CdTe was successfully deposited within the pores of polycrystalline TiO2 NTs.Reference Seabold, Shankar, Wilke, Paulose, Varghese, Grimes and Choi90
Summary
Oriented nanotube (NT) arrays prepared by electrochemical anodization show considerable promise as a film architecture for dye- and semiconductor-sensitized solar cells (DSSCs). The efficiencies of TiO2 NT-based DSSCs are approaching those of the traditional TiO2 NP-based DSSCs. Further improvement in the efficiency of TiO2 NT-based devices will rely on scientific advances in several key areas, such as (1) a better understanding of trap-controlling transport and recombination, (2) development of synthetic methods to increase the crystalline order of NT structures, (3) improvement of the light absorption properties of molecular and semiconductor sensitizers, (4) establishment of a more complete understanding of the optical properties of NT arrays, and (5) design of more effective light-trapping strategies for devices.
Acknowledgments
This work was supported by the Division of Chemical Sciences, Geosciences, and Biosciences, Office of Basic Energy Sciences (A.J.F.), and the Division of Photovoltaics, Office of Utility Technologies (K.Z.), U.S. Department of Energy, under contract No. DEAC36-08G028308.