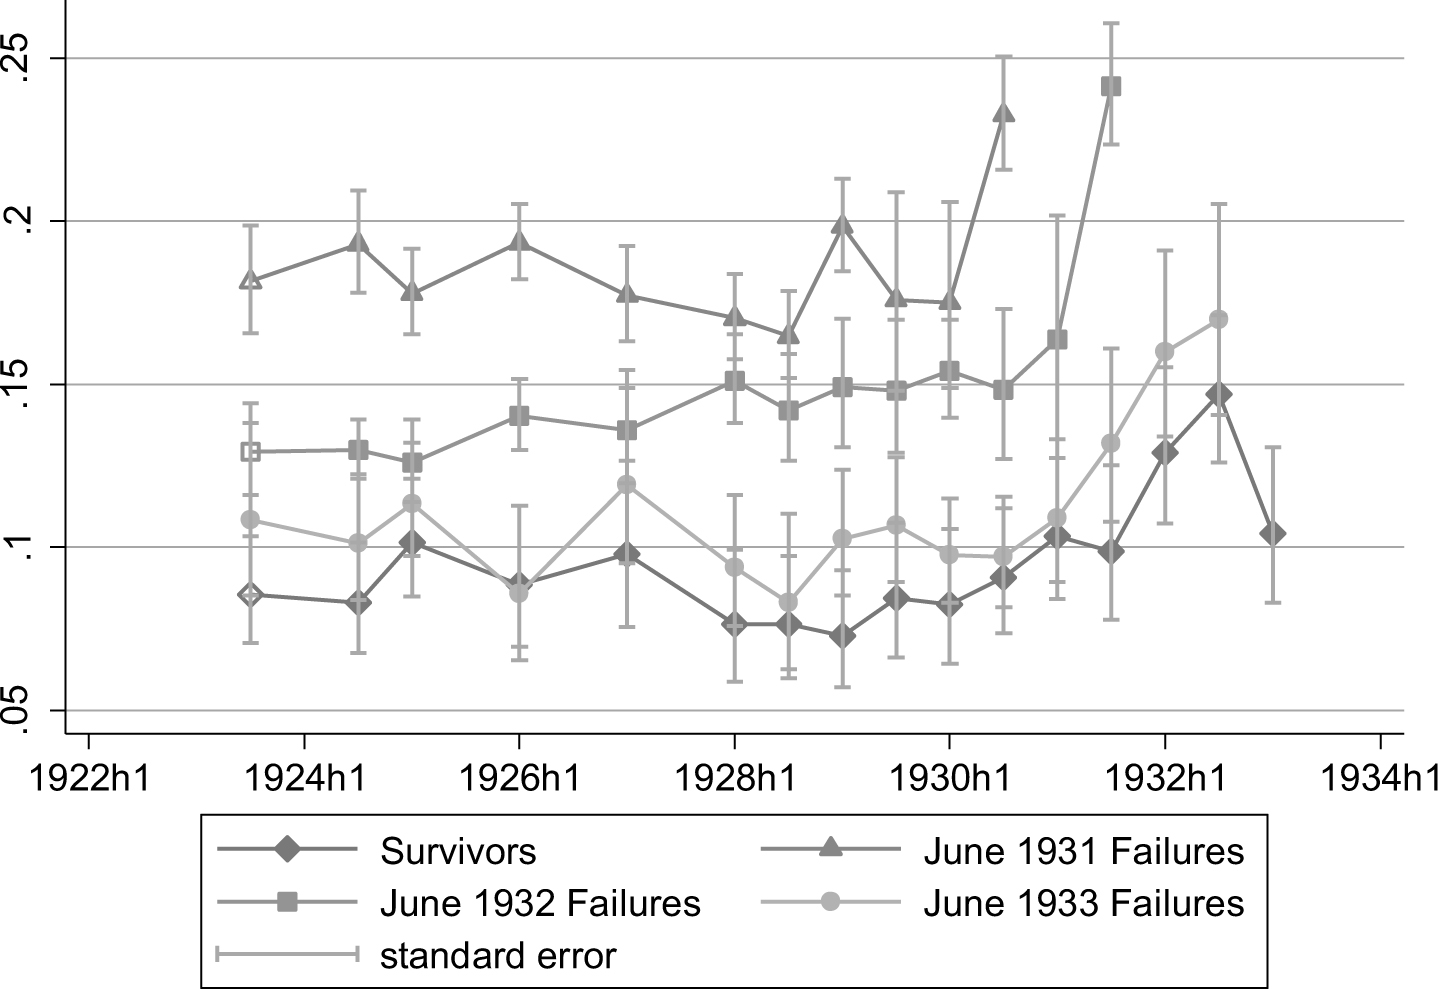
The recent financial crisis has revived interest in the causes of bank failures. A lively and ongoing debate on Depression banking panics in the United States has drawn increasing attention to the significance of illiquidity and falling asset values as causes of bank failure. On the one hand, there is compelling evidence that falls in the value of bank assets had a significant impact on the likelihood of survival (Calomiris and Mason Reference Calomiris and Joseph R.1997, Reference Calomiris and Joseph R.2003; Esbitt Reference Esbitt1986; Guglielmo Reference Guglielmo1998; Temin Reference Temin1976; Thomas Reference Thomas1935; White Reference White1984). On the other hand, there is also evidence that liquidity mattered (Friedman and Schwartz Reference Friedman and Anna J.1963; Wheelock Reference Wheelock1991; Wicker Reference Wicker1996). For instance, Mark Carlson, Kris J. Mitchener, and Gary Richardson (Reference Carlson, Mitchener and Richardson2011) and Richardson and William Troost (Reference Richardson and Troost2009) show that liquidity provision by the central bank reduced the risk of bank failure. In the same vein, Mitchener and Richardson (Reference Mitchener and Richardson2013) show that interbank deposit withdrawals unrelated to target banks' internal conditions increased their probability of failure.
These results highlight the fact that both insolvency risk (falls in asset values) and illiquidity risk can contribute to bank failure risk. In fact, deposit withdrawals rarely occur in the absence of a shock to asset values. As depositors are usually risk-intolerant, even small shocks to insolvency risk can cause solvent banks to fail through large deposit withdrawals (Calomiris and Gorton Reference Calomiris, Gorton and Hubbard1991). Most authors of empirical studies of these questions agree that insolvency risk rose for all banks in the Depression and that it was one of the main factors behind the mass withdrawals witnessed at the time. Even Milton Friedman and Anna J. Schwartz (Reference Friedman and Anna J.1963) concede that the “contagion of fear” leading to banking panics partly originated in agricultural regions where output had fallen since the end of WWI.Footnote 1
The central problem is thus not so much to determine which of these two factors caused banks to fail; rather it is to determine the relative importance of each. Within this framework, a pertinent question to ask is how important endogenous illiquidity risk was, above and beyond any observed exogenous increase in insolvency risk. Bank failures could have occurred either because the exogenous shock to assets was very large, or because only a small shock occurred but those banks were highly illiquid. For instance, imagine two banks which have identical declines in their asset values and have the same leverage, which means they have identical increases in insolvency risk. As a consequence, both banks experience similar deposit outflows. But one of them has enough cash to handle those withdrawals, while the other does not, and consequently fails. This would be an example of cross-sectional differences in survival primarily driven by liquidity risk. Note that what is driving failure risk here is not exogenous liquidity risk (deposit withdrawals) but endogenous liquidity risk: the fact that the second bank was less liquid ex ante than the first one.
The aim of this article is to answer this question for Great Depression Chicago, which had one of the highest urban bank failure rates in the country.Footnote 2 It extends the existing literature on Chicago (notably Calomiris and Mason Reference Calomiris and Joseph R.1997) by using extant balance sheet data from as early as 1923 to focus specifically on the long-run relative importance of each pre-crisis financial ratio in predicting failure.Footnote 3 Importantly, this study makes explicitly clear that some pre-crisis balance sheet items are linked to banks' liquidity, not just to banks' future probability of incurring losses. For example, cash holdings are obviously linked to banks' capacity to meet cash withdrawals. Similarly, long-term loans can be riskier from a liquidity point of view, because of the increased maturity mismatch. Some balance sheet items are thus intrinsically less liquid than others, regardless of their quality. With this in mind, I separate bank failures into three cohorts ordered through time (1931, 1932, and 1933 failures) and examine the evolution of their balance sheets over the whole decade of 1923–1933.
My first finding is that, while depositors ran on all banks, what really differentiated banks' probability of failure was the size of their real estate loan investments in the pre-crisis period. Examining cohorts of bank failures graphically, I show that they are most clearly ordered in terms of their mortgage holdings: the more a bank held in mortgages, the earlier it failed. The ordering is not so clear for other balance sheet items, such as capital, reserves, stocks and bonds, and other loans. This is confirmed econometrically by an ordered logistic model, which suggests that mortgages have the largest predictive power.
Importantly, the results emphasize mortgages' inherent lack of liquidity as a determinant risk factor. There are three reasons to think that the quality of mortgages did not play a significant role. First, most mortgages had a 50 percent loan-to-value (LTV) ratio, while land values fell by less than 50 percent in Chicago before 1933. This means that banks cannot have incurred any significant losses on defaulting loans. Second, mortgages had longer contract maturities (three to five years) than other loans, and even longer de facto maturities. Long maturities, the absence of secondary markets and the impossibility of rediscounting these loans at the Federal Reserve meant that they were inherently less liquid than other types of loans. Third, I show that locational differences in land values within Chicago did not have a differential impact on bank failure rates.
The view that illiquid mortgages were the main cause of failure is supported by evidence that all banks engaged in fire sales of other loans and securities. In this process, mortgages could not be liquidated. Indeed, real estate loans increased as a share of total assets for all banks during the Depression, at the same time as assets as a whole were declining. Other types of loans, such as loans on collateral security and “other loans,” were promptly liquidated.
These findings suggest significant policy implications from a regulatory point of view. They show that long-term investments in illiquid assets play an important role in bank failure. This does not rule out a role for lenders-of-last-resort as a within-crisis solution. But it does suggest a role for regulatory authorities in crisis prevention. Regulatory measures may include, for instance, renewed emphasis on cash ratios or other liquidity requirements. This is all the more important given that central banks cannot always accurately predict the quality of banks' collateral (especially in the case of assets maturing at a much later date), making central banks' task during a crisis a highly complex and possibly imperfect one (Goodhart Reference Goodhart2010).Footnote 4
Making banks responsible for their liquidity risk management—not just for their credit risk management—is an idea that has only taken hold in the past few years (Goodhart Reference Goodhart2008). While it was considered an important aspect of bank regulation from the nineteenth century to the early twentieth century in the United States, it was then more or less abandoned, to be replaced since the 1980s by a much more pressing focus on credit risk, and, in particular, capital requirements. Liquidity requirements were indeed almost absent from the Basel I and Basel II regulations, and only recently made a comeback in the Basel III regulations in light of recent events.Footnote 5
The results of this article also invite a reassessment of the role of real estate in the Great Depression. While largely unmatched, Chicago's real estate boom resembled both in character and magnitude the suburban booms of other major cities in the East North Central region. This region also experienced one of the highest bank suspension rates in the country.Footnote 6 A number of recent articles have shown that, in the aggregate, the direct contribution of real estate to the decline in economic activity was small (Field Reference Field, Fishback, Price and White2014; White Reference White, Fishback and Snowden2014).Footnote 7 This article assesses its possible indirect contribution via the banking channel.Footnote 8
CHICAGO BANKS IN THE BUILDING BOOM
In the 1920s Chicago experienced one of the largest real estate booms in the country, partly as a result of circumstances created by WWI. In the first place, a near embargo on labour and building material created a housing shortage which realtors were eager to compensate for after the war (U.S. Congress 1921). In addition, the war led to a substantial boom in agricultural goods and land, which quickly gave way to a deep recession in farming areas when the war came to an end. As a flourishing business centre lying next to the vast but weakened agricultural lands of the Midwest, Chicago profited from this situation perhaps more than any other city in the United States.
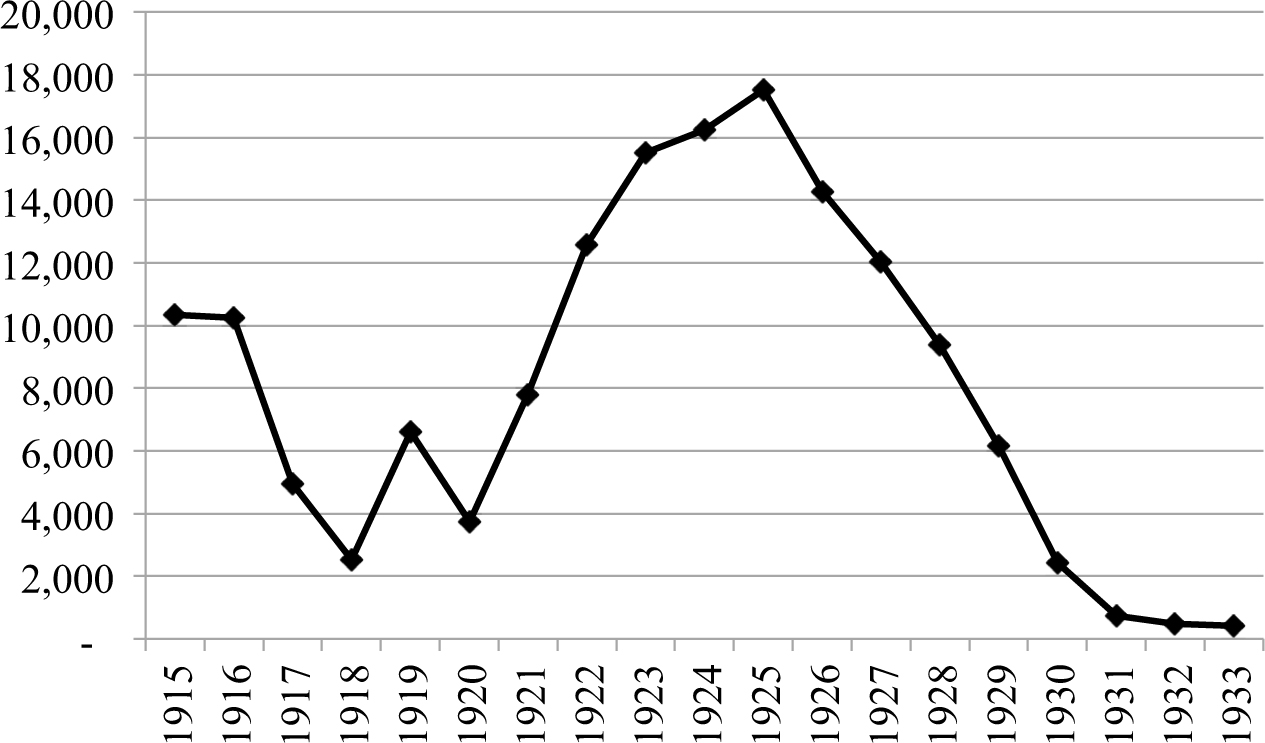
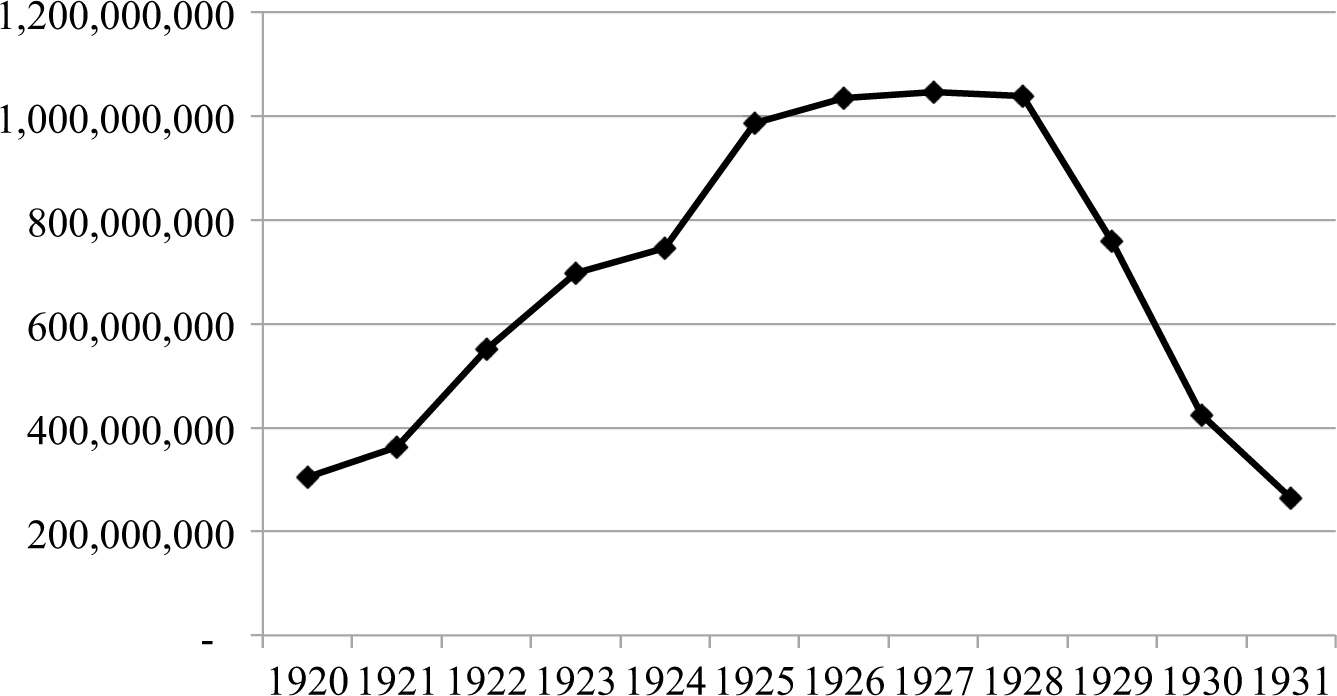
Progress in economic activity and the near-constant arrival of new inhabitants in search of higher wages brought an excitement to the city that led to a significant construction boom (see James Reference James1938, p. 939; Allen Reference Allen1931; Sakolski Reference Sakolski1966). Figure 1 shows that building construction reached a peak in 1925–1926. From 1918 to 1926 the population of Chicago increased by 35 percent, while the number of lots subdivided in the Chicago Metropolitan Region increased by 3,000 percent (Hoyt Reference Hoyt1933, p. 237).Footnote 9
ANNUAL NUMBER OF NEW BUILDINGS IN CHICAGO

Commercial banks were not the only real estate lenders, but they played an important role in allowing this boom to develop.Footnote 10 Granted, nationally-chartered banks were heavily restricted by law in terms of mortgage lending, and their assets made up nearly 40 percent of all bank assets (University of Illinois Bulletin 1929). First National rivaled in size the largest bank in Chicago, Continental Illinois, which was state-chartered. As a contemporary made clear, “by the summer of 1929 … the Continental Illinois and the First National towered over the Chicago money market like giants” (James Reference James1938, p. 952).Footnote 11 Nevertheless, a huge number of small unit banks swarmed around the city, most of them state-chartered and therefore only lightly constrained by law (White Reference White1983). As F. Cyril James put it, “around these great banks of the Loop, there nestled, however, some 300 outlying commercial banks, each of which appeared microscopic [alongside] the Continental or the First although, in the aggregate, they handled a considerable proportion of the city's business.” In December 1929, state banks made up 95.5 percent of all banks in the city (University of Illinois Bulletin 1929).
These small banks were usually unable to branch, due to restrictive state banking laws in Illinois. Consequently most of them catered to their local communities, investing in local projects, often in real estate. This is suggested by James (Reference James1938, p. 954), who notes: “each of these banks represented a financial centre for the community it served, and anything that concerned the bank was of outstanding local importance.” Similarly, Homer Hoyt (Reference Hoyt1933, p. 249) emphasizes that “outlying banks furnished depositories for local funds and collected neighbourhood savings for reinvestment in local building projects” (see also James Reference James1938, pp. 944, 953, 954, 993; Hoyt Reference Hoyt1933, p. 270). James also speculated that the soundness of the banks was “intimately related to the building boom” (James Reference James1938, p. 953).Footnote 12
Soon after the Depression started, several waves of banking crises shook the country. Chicago was probably one of the worst hit cities (Wicker Reference Wicker1996). Deposit withdrawals began as early as 1930, gained pace in early 1931 and redoubled in 1932, especially during the summer, as was documented by Charles W. Calomiris and Joseph R. Mason (Reference Calomiris and Joseph R.1997). A significant number of banks survived the first waves of panic but many failed later on. The last banking panic was in 1933; it eliminated a few more banks before giving way to a long-needed respite.
DATA
The principal aim of this article is to understand the specific factors that might have led banks to fail in these different waves, and in particular to examine what might have contributed to the timing of their failure. In this section I provide details on the data used and the underlying empirical framework.
The Statements of State Banks of Illinois are the most detailed and accessible semi-annual source of balance sheet data, though they only report on state-chartered banks (both members and non-members of the Federal Reserve System).Footnote 13 These banks generally reported at the end of June and December of each year, which allows me to look at balance sheets in all years from 1923 up to 1933 for the first time. The years 1920–1922 are recession years and are not examined in this study (see James Reference James1938, p. 939; Hoyt Reference Hoyt1933, p. 236). The full dataset includes: December 1923, December 1924, June 1925, June 1926, June 1927, June and December 1928, June and December 1930, June and December 1931, June and December 1932, and June 1933. All Statements give asset book values. I also make use of Rand McNally Bankers' Directory, a recognized source for tracking down bank name changes and consolidations (see the Appendix for more detail).
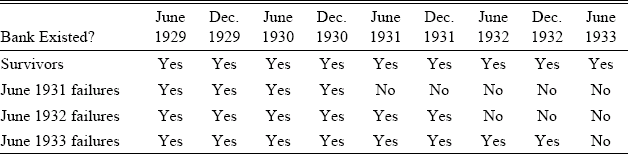
I divide banks into four cohorts: survivors, June 31 failures, June 32 failures, and June 33 failures. The survivor category tracks each bank and only includes the banks present at every point in time from June 1929 to June 1933. This system allows me to create a balanced sample over the Depression period.Footnote 14
The choice of the windows of failure was necessarily somewhat arbitrary, but not entirely so. Chicago was hardest hit by banking crises in the spring of 1931 and in the spring and early June of 1932 (Wicker Reference Wicker1996, pp. 68–69, 112). Thus selecting the banks that failed between January and June 1931 and banks that failed between January and June 1932 allows me to include banks that were especially affected by banking crises as well as non-panic failures. There is no 1930 cohort because the wave of bank failures following that of Caldwell and Company in November 1930 was mainly confined to the southern regions of Tennessee, Arkansas, and Kentucky (Wicker Reference Wicker1996, p. 58). By contrast the early 1933 crisis was nationwide, prompting me to analyze the few banks that failed in Chicago at the time (ibid, p. 108).Footnote 15 In general, while some banks failed before—and between—these cohorts, I selected the cohorts that seemed most important to explain Chicago bank failures.
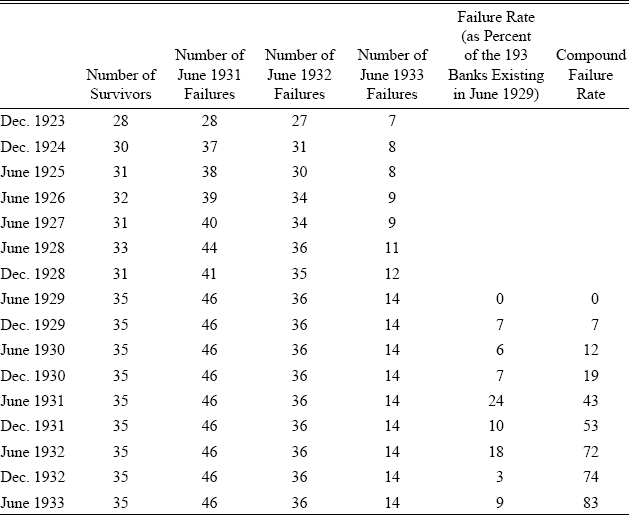
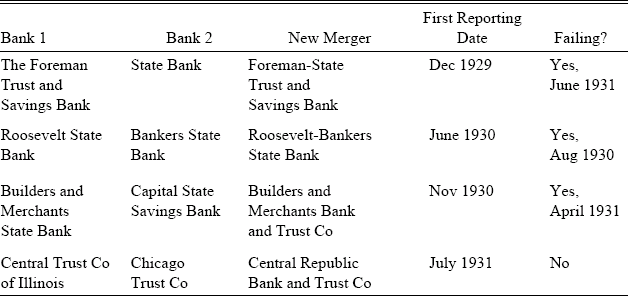
Table 1 shows the different cohorts and the corresponding reporting dates. Following Eugene N. White (Reference White1984), I exclude the few banks that closed and later reopened. Including them in the analysis does not significantly change the results. Often some cohort banks were not present in every year from 1923 to 1928. For example, there are 46 June 1931 failures, but only 39 of them were present in June 1926.Footnote 16 The resulting variation in sample sizes will not directly affect the econometric analysis of the pre-1929 period, since ordered logistic regression only uses cross-sections in one particular year. Table 2 shows the sample sizes for each cohort at various points in time.Footnote 17
CLASSIFICATION OF GREAT DEPRESSION COHORTS

Source:
Statements.
SURVIVORS AND FAILURES

Notes:
The 193 banks in total for June 1929 mentioned in the sixth column include those that are not part of any cohort, for example, those that failed between the chosen windows of failure. The actual bank total for June 1929 as the sum of each cohort is 131.
Source:
Statements.
A consolidation was “the corporate union of two or more banks into one bank which continued operations as a single business entity and under a single charter” (Richardson Reference Richardson2007). During the Depression, mergers were described colloquially as “shotgun weddings,” whereas takeovers were part of the “purge and merge system” (James Reference James1938, p. 994). Merger and takeover are usually considered in the literature as major signs of weakness. I follow Calomiris and Mason (Reference Calomiris and Joseph R.2003) in counting as failures banks that were taken over by other banks. This occurred in 14 cases from June 1929, though the results are robust to a different treatment.
The treatment of mergers that ended up failing can be tricky because it is not clear which of the two parties in the merger was the weakest. A healthy bank may have merged with a less healthy bank which then dragged the former into bankruptcy. So instead of categorizing such mergers as a failure of both banks at the time of merger, when possible I kept both banks alive by splitting the merger's balance sheet in parts proportional to the size of each bank. I expressed the failure of a merger as the failure of the two merged banks.Footnote 18
EMPIRICAL RESULTS
A study of Chicago bank balance sheets shows that deposit losses alone cannot explain bank failures. An analysis of the same balance sheets, using an ordered logistic model, shows that mortgage lending is an important part of the explanation. In this section I deal with these two points in turn.
Deposit Losses
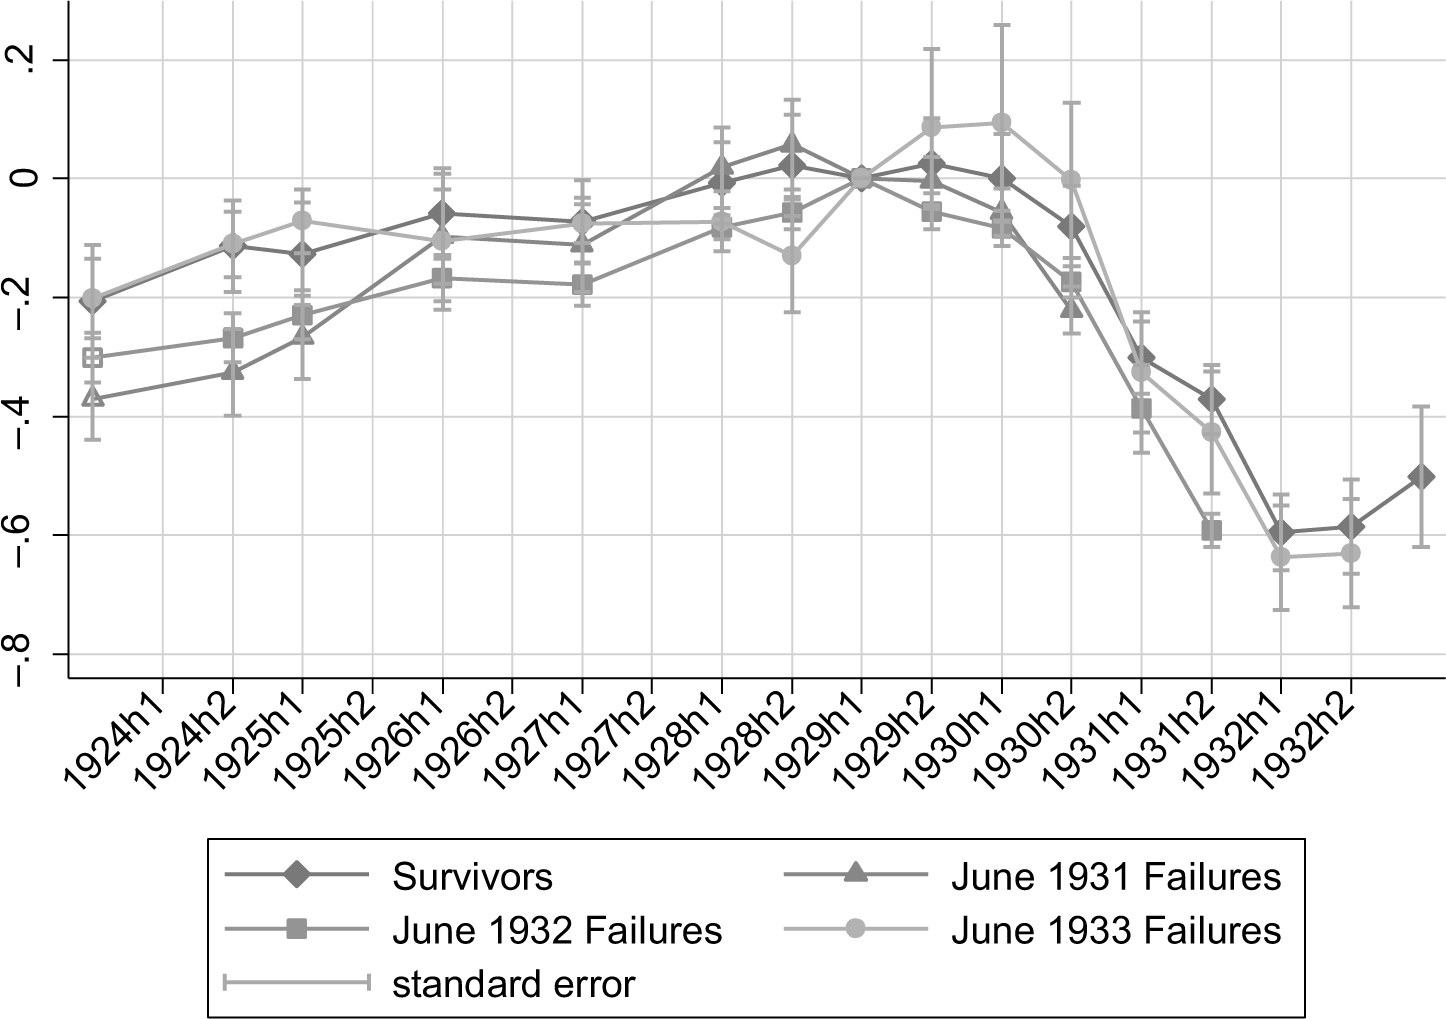
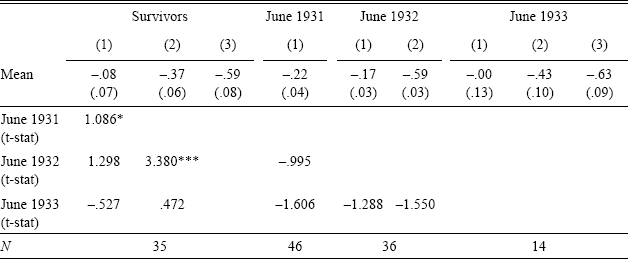
First, consider deposit losses. Key variables used here are the cumulative rates of decline in depositsFootnote 19 from the end of June 1929 to December 1930, from June 1929 to December 1931, and from June 1929 to December 1932. The deposit data is based on the last call before failure, which for some failures was almost six months before their failure date. The deposit losses of banks failing during any of the major panics of April 1931 and June 1932 incurred during this period are therefore not reflected in the variables.Footnote 20 Figure 2 shows the cumulative growth rate of total deposits, and Appendix Table 2 shows each cohort mean as well as tests of differences between them.
MEAN CUMULATIVE GROWTH RATE OF TOTAL DEPOSITS (BASE TIME: JUNE 1929)
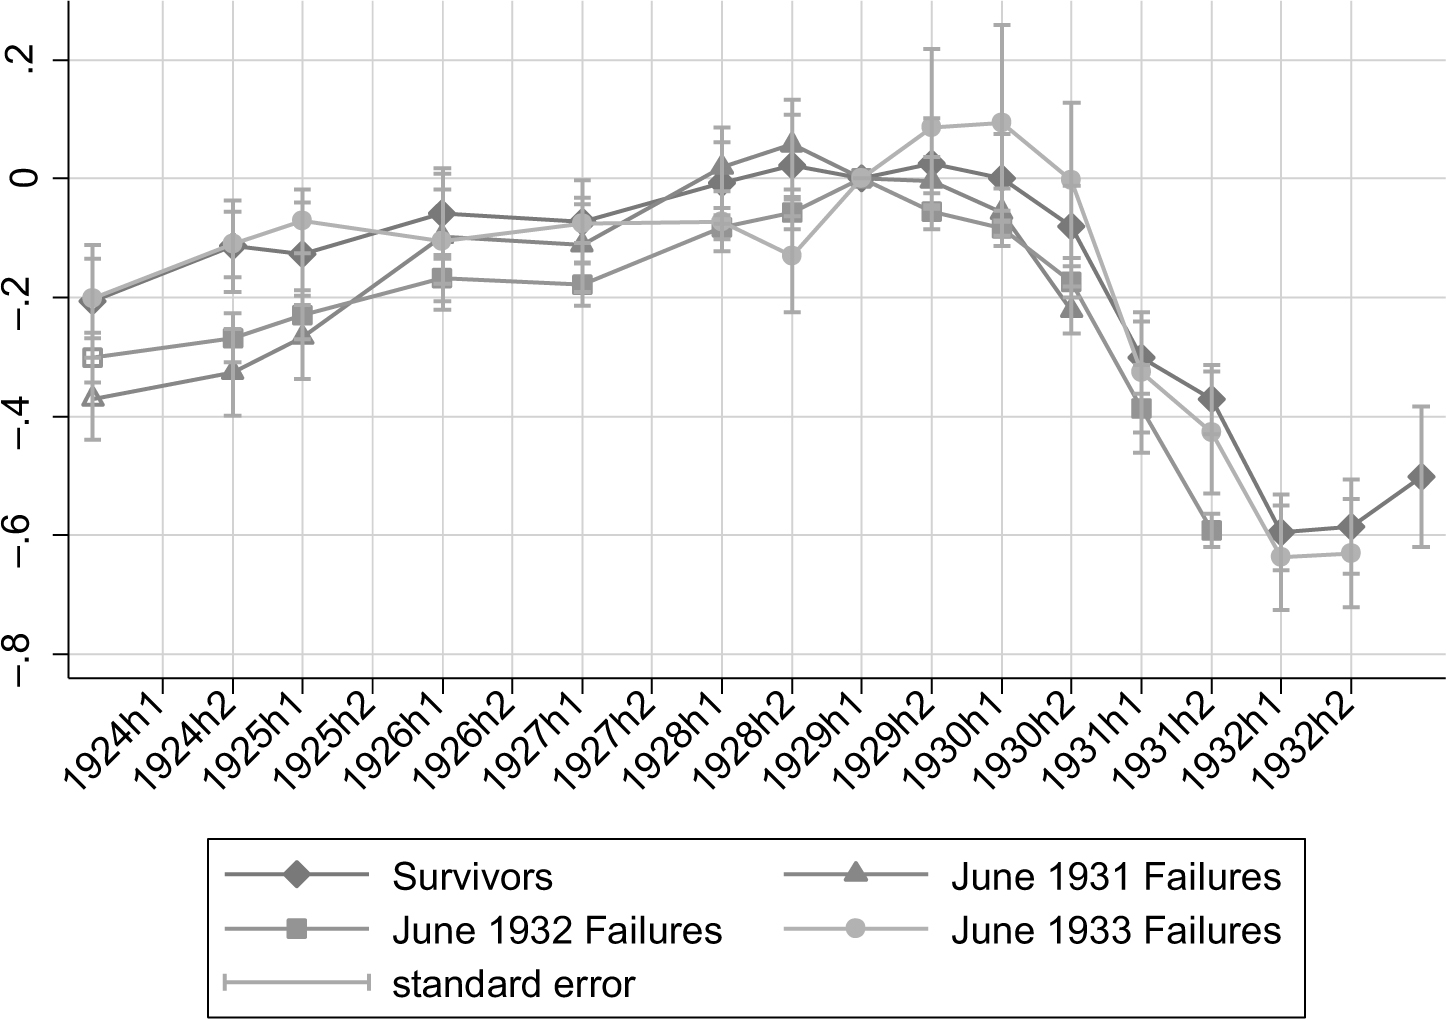
Clearly, all banks lost tremendous amounts of deposits. By December 1930 the first failure cohort had lost on average 22 percent of their deposits, and in December 1931 the second, third, and survivor cohorts had lost respectively, 59 percent, 43 percent, and 37 percent. Looking at December 1930, the difference in deposit losses between the first failure cohort and survivors is only borderline significant, and is not significant when compared to other failure cohorts. On the other hand, a year later the magnitude of the second failure cohort's withdrawals significantly differs from survivors'; this may be due to a learning effect.Footnote 21 Yet even in this case deposit losses were very large for survivors (around 37 percent compared to 59 percent for June 1932 failures). More importantly, by June 1932, survivors themselves had lost 60 percent of total deposits.Footnote 22 This suggests that all banks suffered a severe liquidity shock, and that differences in cumulative deposit withdrawals cannot easily explain bank failure.
Ex Ante Balance Sheet Ratios
If deposits cannot by themselves explain why some banks failed and others did not, other aspects of bank balance sheets should help explain this difference. This section examines some of the most important pre-crisis ratios that are related to bank health. Graphical analysis and a logit model suggest that real estate loans were more significant than other ratios—such as capital, government bonds, and other loans—as predictors of bank failure. I deal in turn with the graphical analysis and the logit model. Note that geometric means are used throughout due to the ratios' right skew.Footnote 23
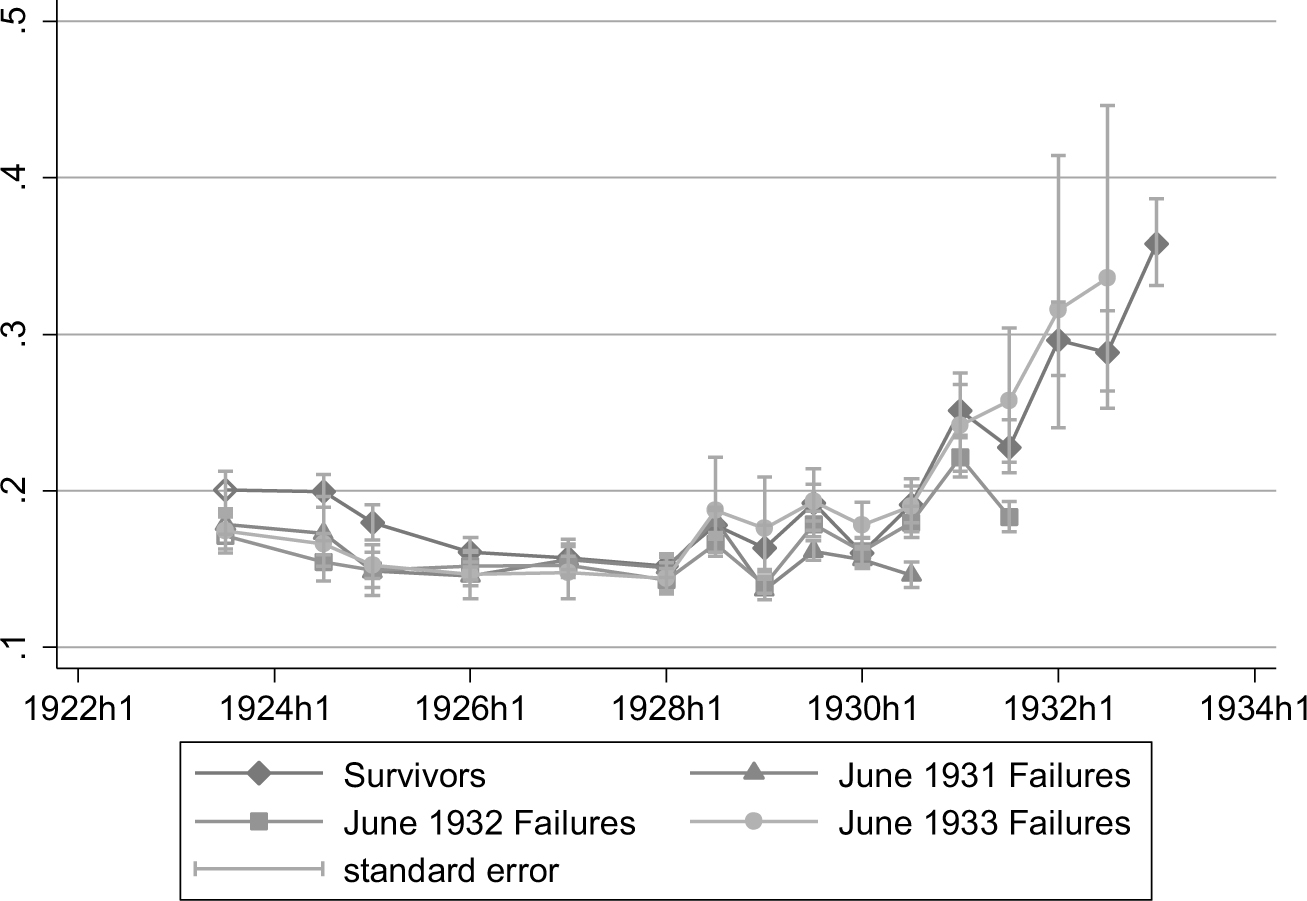
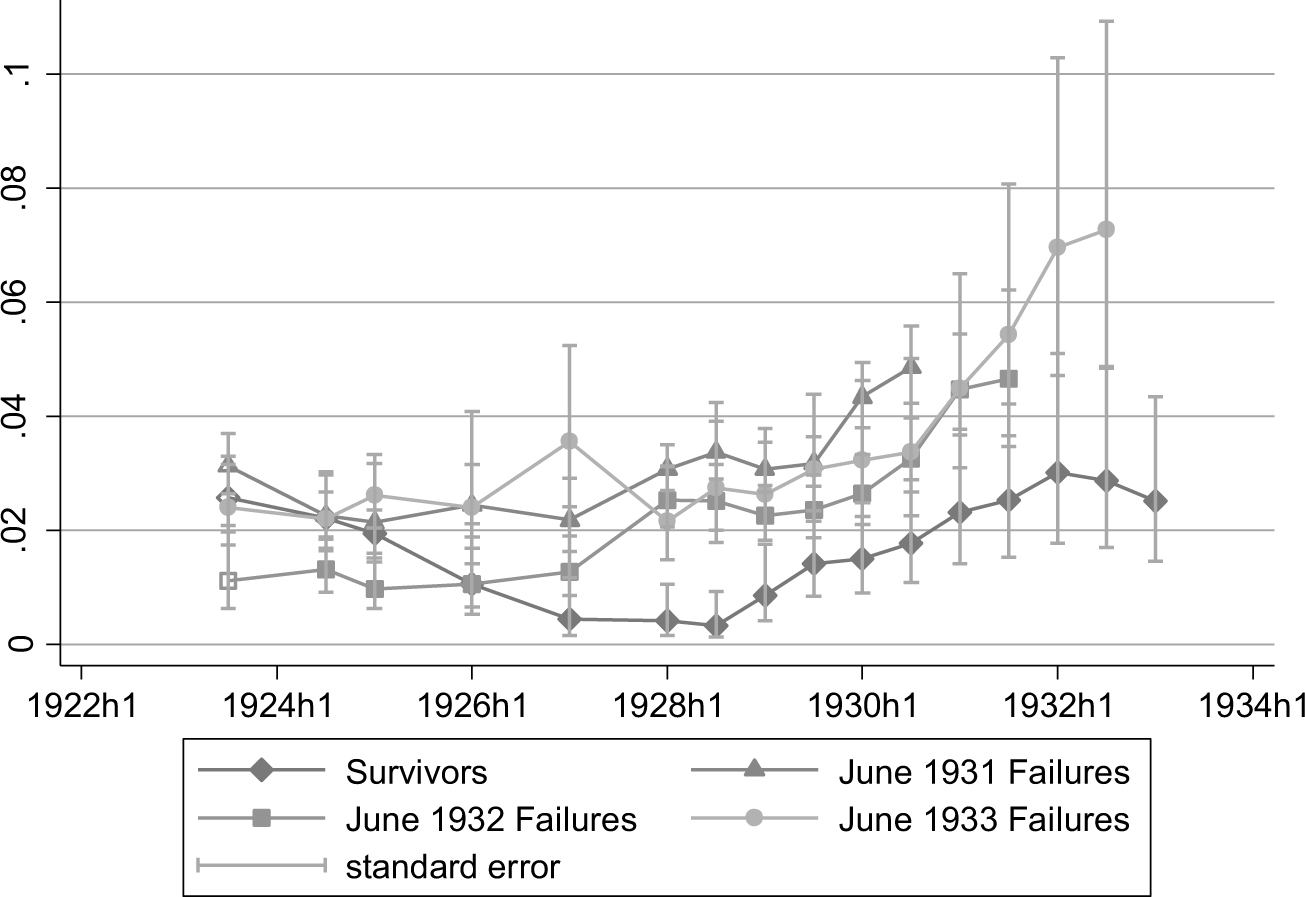
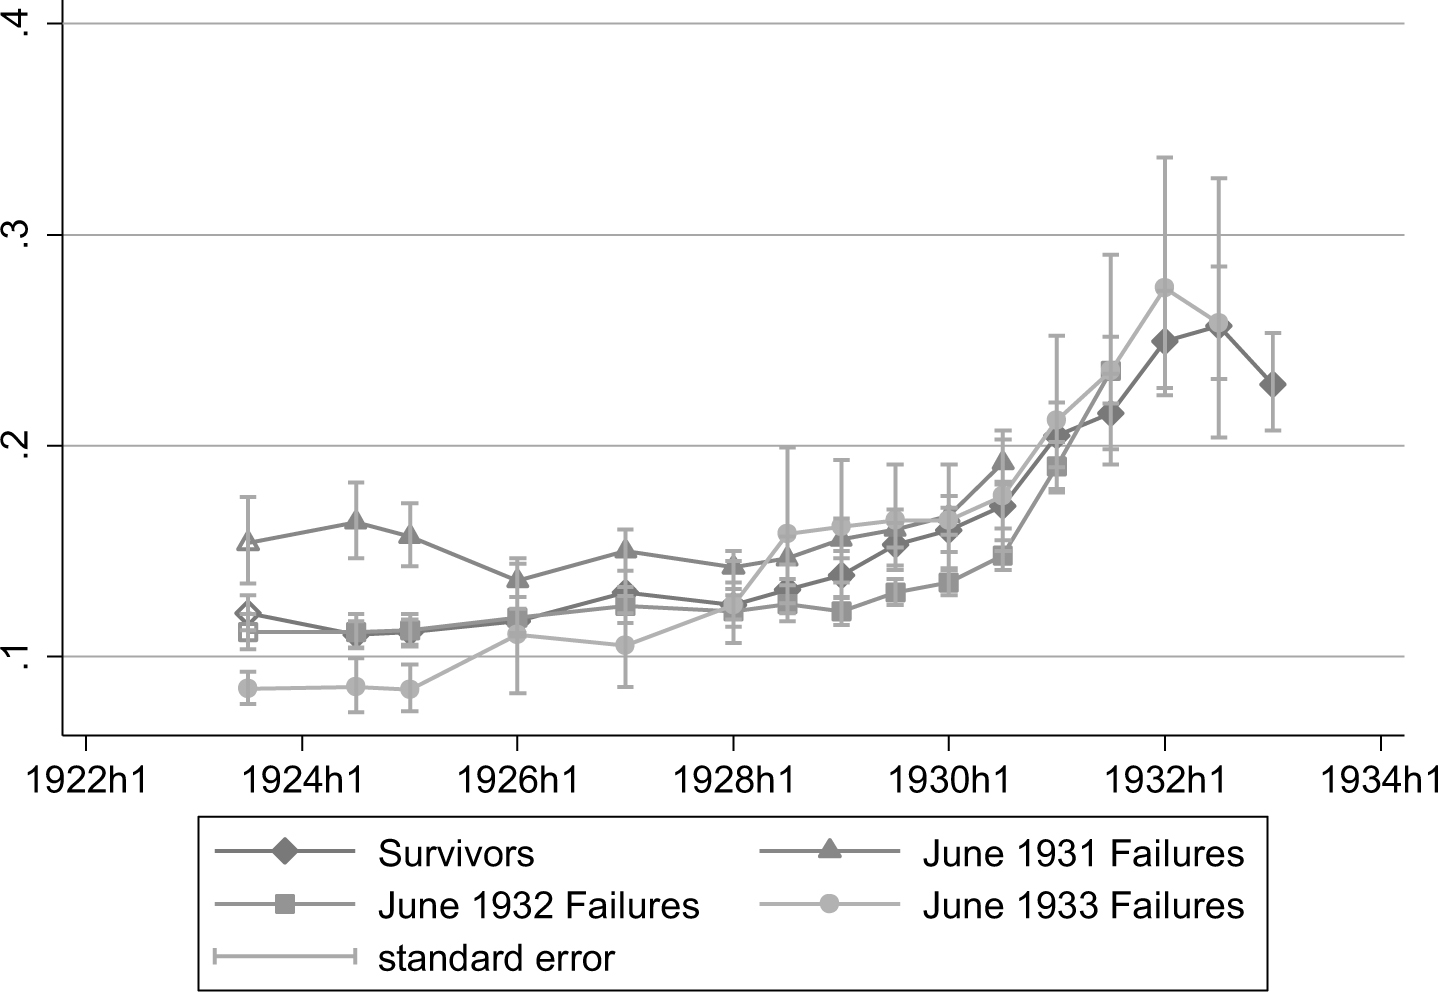
Figure 3 shows the share of real estate loans (both residential and commercial) to total assets by cohort from 1923 onwards.Footnote 24 In the pre-Depression era, survivors often had the lowest mortgage share during most of the 1920s, followed closely by June 1933 failures. June 1932 failures had a substantially higher share, and the June 1931 failures' share was even higher. Interestingly, some form of divergence between June 1932 failures and survivors from around 1926 onwards is also noticeable, and this difference becomes significantly larger starting in June 1928. This is evidence that the banks which failed earlier were those that had invested more in real estate loans as early as 1923. In other words, the share of mortgages at least partly explains not only the event of failure but also its timing. No other balance sheet item is as clearly graphically ordered as mortgage holdings (see Figures 4 and 6 in the last section, and Appendix Figures 1, 2, 3, 4, 5, 6, and 7).
RESTATE LOANS TO TOTAL ASSETS (ALL CATEGORIES)

CAPITAL TO TOTAL ASSETS
NEW MORTGAGES AND TRUST DEEDS, COOK COUNTY, ILLINOIS ($)
LOANS ON COLLATERAL SECURITY TO TOTAL ASSETS
It is interesting to note that some of the banks that invested the least in real estate were also very large banks: in June 1929 Continental Illinois had .7 percent, Central Trust Company of Illinois around 2 percent, Harris Trust and Savings .05 percent, and the Northern Trust Company .7 percent.Footnote 25 This in itself suggests the necessity of using a regression framework, which would allow me to test the importance of mortgages in predicting bank failure while controlling for other factors such as bank size.
A simple way to do so is to introduce an ordered logistic model, which for this study presents several advantages over other estimation procedures. While in binary logistic models the outcome variable can only take one of two values (“survivor” or “failure”), ordered logistic regression allows the outcome variable to include several categories of failure, as well as the survivor one. And while a discrete-time hazard framework necessarily takes into account within (i.e., post-1929) Depression variables, ordered logistic models allow me to focus exclusively on the impact of pre-Depression variables on the outcome.Footnote 26 This matters because external shocks may affect bank variables during the Depression, whereas ex ante variables are more likely to reflect banks' pre-Depression portfolio decisions, which are the subject of this study. I report discrete-time hazard estimations in the Appendix for reference.
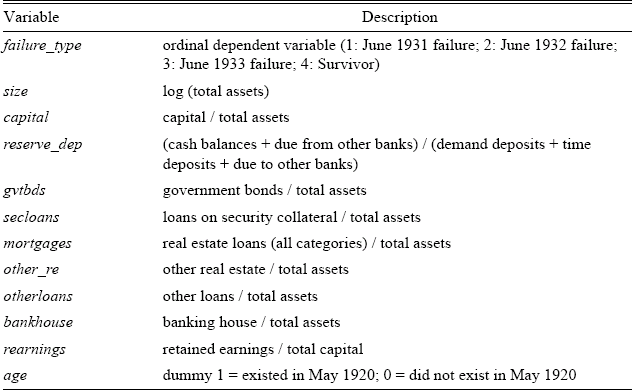
The dependent variable in the ordered logit model is thus an ordinal variable (failure_type) in which each category represents a bank's failure type. The categories are ordered so that the first category is June 1931 failure (1), the second category is June 1932 failure (2), the third category is June 1933 failure (3), and the last category is Survivor (4). Formally, I estimate a probabilistic model of bank failure such that

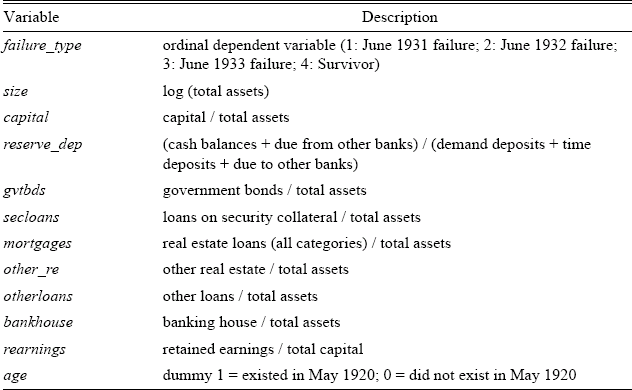
where size is a value of bank assets, capital is the capital ratio, reserve_dep is the reserve-deposit ratio, gvtbonds is the share of U.S. government bonds, secloans represents loans on security collateral (short-term loans backed by stock-market securities), mortgages is the share of real estate loans, other_re is the share of repossessed real estate after foreclosure, otherloans is the share of other loans, bankhouse is the share banking house, furniture and fixtures (bank expenses), rearnings is retained earnings to net worth (a common measure of bank profitability),Footnote 27 and age is a dummy variable equal to one if a bank already existed in May 1920 and zero otherwise. A detailed description of each variable can be found in Table 3.
VARIABLE DEFINITIONS
Notes:
All variables except for size and age have been multiplied by 100 to ease interpretation of the odds ratios. The variable mortgages contains both residential and commercial mortgages, as no decomposition was available on the original bank statements.
Source:
Statements.
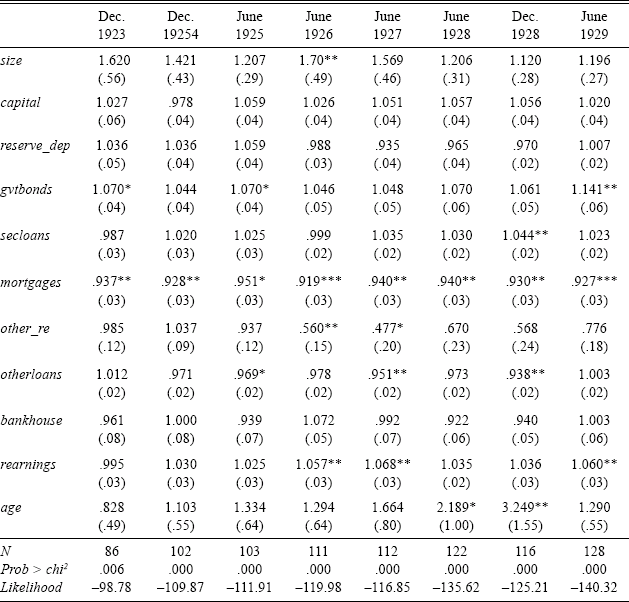
Table 4 presents the results for this model, in odds ratios. Each column represents a separate regression in which predictors are restricted to one particular year. For instance, the 1923 column helps find out which 1923 variables best predict failure during the Depression.
ORDERED LOGISTIC MODELS OF BANK FAILURE (ODDS RATIOS), 1923–1929 (DEPENDENT VARIABLE: FAILURE_TYPE)

Sources:
*** significant at α= 0.01.
** significant at α= 0.05.
* significant at α= 0.10.
Notes:
The dependent variable (failure_type) is an ordinal one, ordered in the following way: 1. June 1931 failure; 2. June 1932 failure; 3. June 1933 failure; 4. Survivor. Each column represents a separate model run with variables taken each year before the start of the Depression. The table shows odds ratios, with standard errors based on the original coefficients in parentheses. An odds ratio above one increases the likelihood of survival, whereas an odds ratio below one decreases it. Each variable except for size and age has been multiplied by 100 so that a one unit increase can be interpreted as a one percentage increase in the ratio.
Source:
Statements.
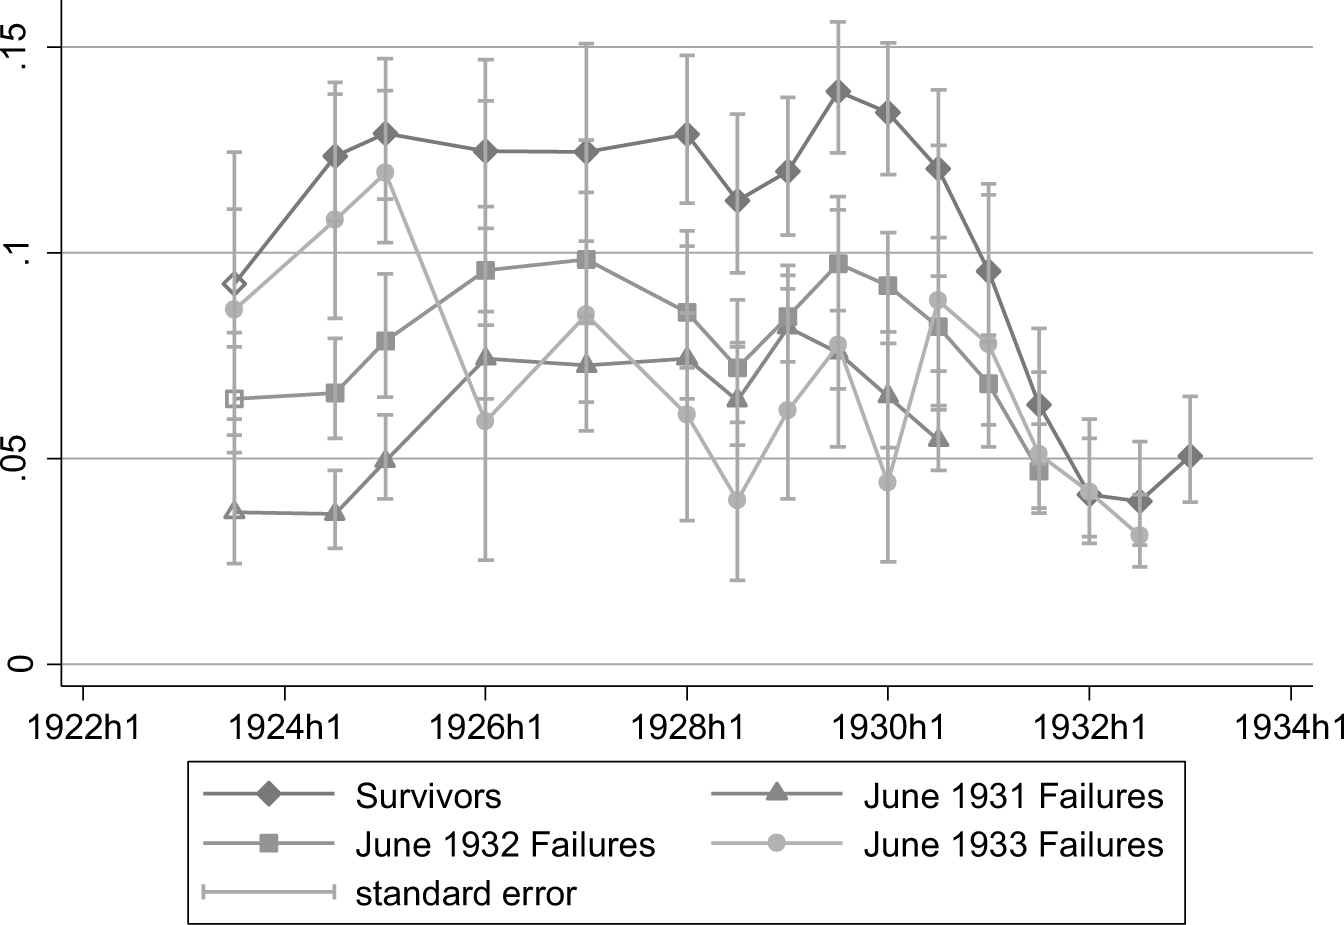
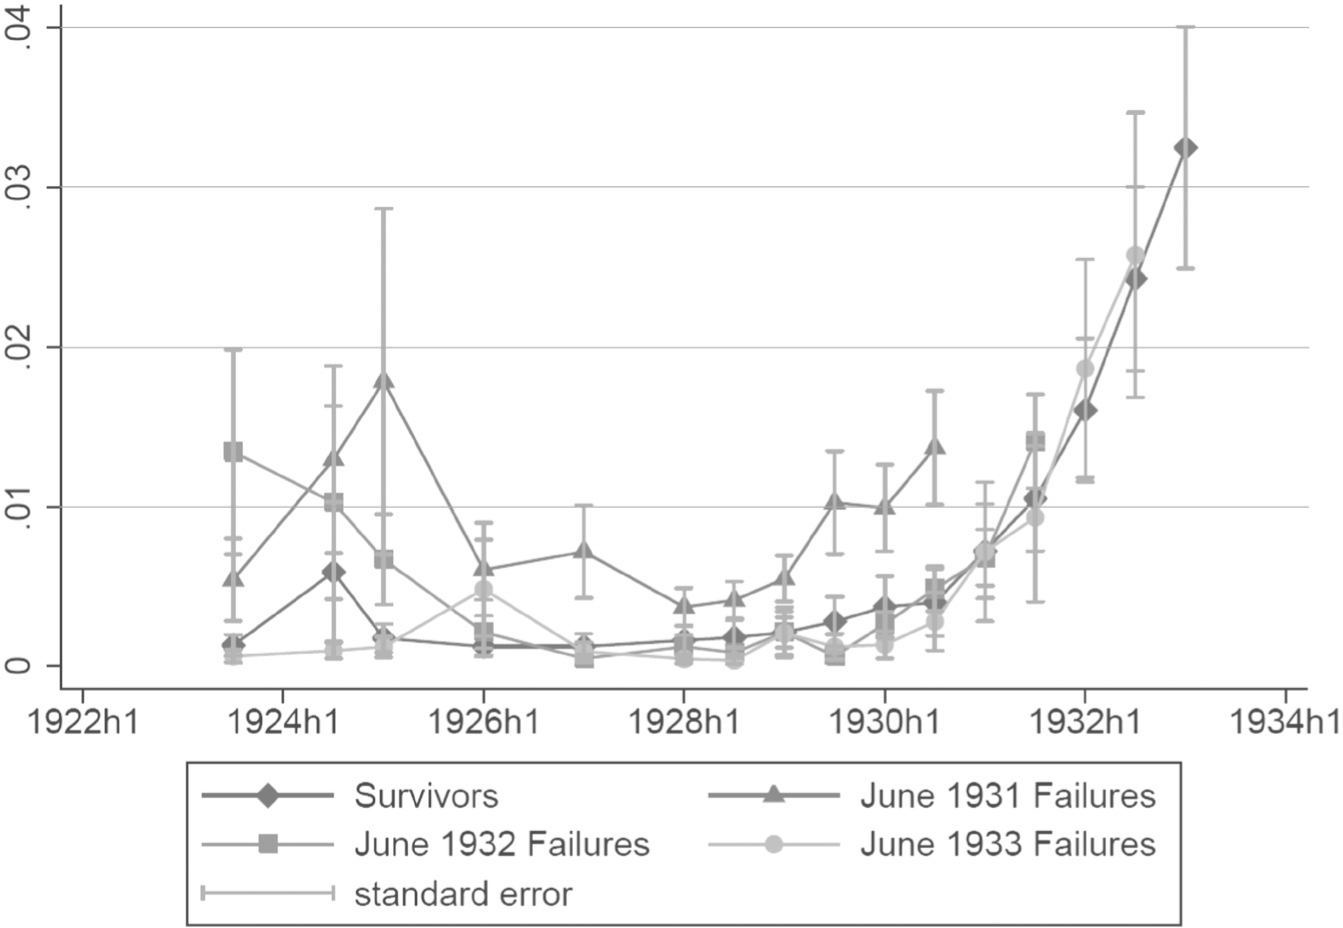
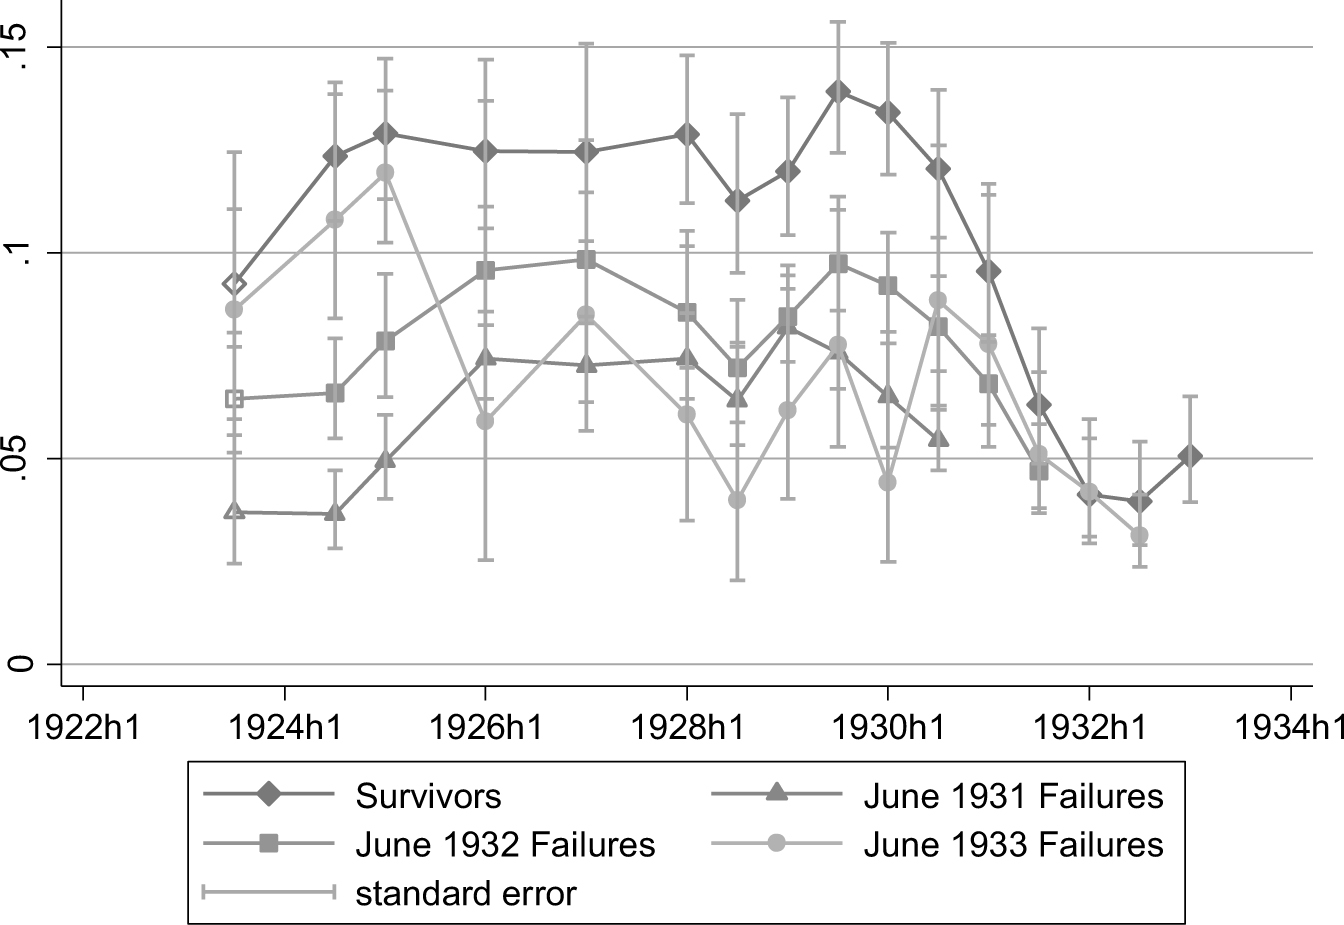
Clearly, many ratios predict failure quite well throughout the pre-Depression period. In particular, government bonds, other loans and especially retained earnings to net worth significantly each reduce the likelihood of failure. The relative importance of the latter is also illustrated in Appendix Figure 5, which is quite reminiscent of that of real estate loans, differing mainly in that the last failing cohort behaves quite differently from survivors after 1926.
Of greater interest is the role of the real estate loan share. This variable stands out as the most important overall. Already in December 1923, for a 1 percent increase in the proportion of mortgages to total assets, the odds of surviving versus failing (all failure categories combined) were .94 times lower, holding other variables constant in the model.Footnote 28 This coefficient retains its significant predictive power compared to all other variables throughout the 1920s, up to the eve of the Depression. No other variable is as consistently significant as the real estate loan share throughout the period.Footnote 29
Note that in Chicago, depositors in theory could know which banks held the most in mortgages thanks to official publications of balance sheet summaries every six months. The fact that differences in withdrawals did widen to some extent after June 1931 may be explained by a learning effect on the part of creditors. As creditors witnessed withdrawals and the failure of banks with the largest amounts of mortgages in the first episode, they withdrew more from banks with larger amounts of such assets subsequently. However this information effect cannot entirely explain, for instance, why survivors themselves ended up losing nearly 60 percent of their deposits.
THE ROLE OF MORTGAGES
The previous section established that widespread withdrawals affected all banks and that mortgage holdings predict the timing of bank failure. It remains to determine exactly how mortgage holdings led to failure. This could have happened either through mortgages' quality or their inherent lack of liquidity, and there are three reasons to prefer the latter explanation.
First, LTV ratios for commercial bank mortgages at the time rarely exceeded 50 percent, which is particularly low by today's standards. In Chicago in particular, a survey conducted in 1925 indicates that the average LTV on residential properties varied from 41.3 percent to 50.5 percent (Bodfish and Bayless Reference Bodfish and Bayless1928).Footnote 30 This has been emphasized by both Alexander J. Field (Reference Field, Fishback, Price and White2014) and White (Reference White, Fishback and Snowden2014). Given that land values in Chicago did not fall by more than 50 percent until 1933, and that most Chicago banks failed before then (see Table 2), banks could not have made any substantial losses on these loans, even after foreclosure. Hoyt (Reference Hoyt1933, p. 399) documents the fall in land values, using sales and real estate brokers' opinions rather than assessments for tax purposes. He shows that values in Chicago as a whole fell by 5 percent in 1929, 20 percent in 1930, 38 percent in 1931, 50 percent in 1932, and 60 percent in 1933. We cannot know whether the bulk of the “1933” decline occurred before or after the national bank holiday in March 1933. Hoyt actually asserts that “the decline in the value of improved properties from 1928 to 1933 was 50 per cent,” not 60 per cent (Hoyt Reference Hoyt1933, p. 172).
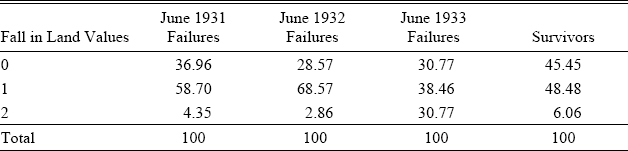
Second, Hoyt (Reference Hoyt1933, pp. 259, 267)'s geographical data on land values suggests that these were uncorrelated with bank failure rates. Although Hoyt's land value variable is categorical, his maps are sufficiently detailed to allow efficient matching with my balance sheet data. Using banks' contemporary addresses in Chicago, I thus generated a new categorical variable, valuefall, which includes three categories of cumulative fall in residential land values per front foot from 1926 to 1931 (from lowest to highest) in each bank's location.Footnote 31 As mentioned earlier, most banks catered to their own neighbourhoods, so that land values in their own location would likely have had the highest impact on their health. Hoyt chose 1931 to illustrate the geographical pattern of falls in land values in the city because this was when the first sharp decline in values occurred (ibid., p. 266). It is reasonable to assume that subsequent falls in land values followed the initial geographical pattern in terms of differences in intensity.
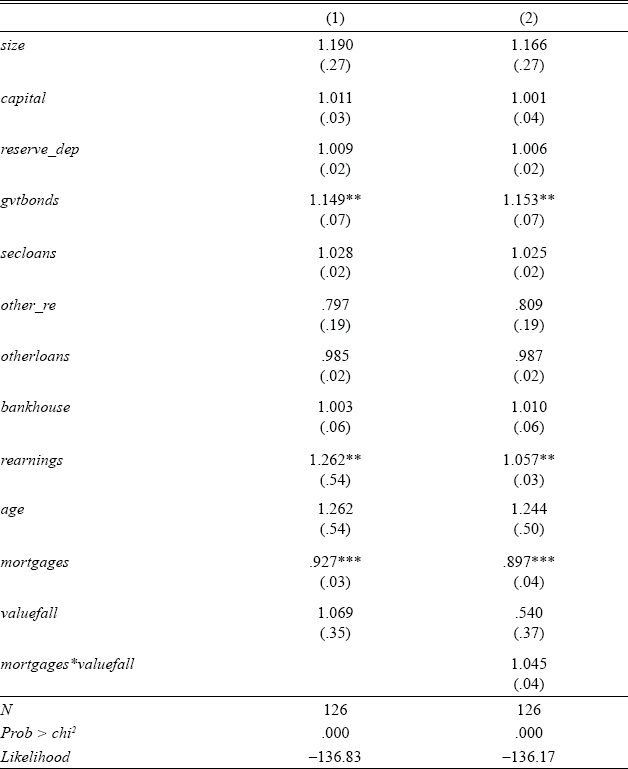
Table 5 shows the percentage of banks in each cohort by category of value decline. There are few differences within the three failing cohorts, so that falls in land values do not point to any possible correlation between falls in land values between 1926 and 1931 and those cohorts' timing of failure. In addition, although survivors seem to have experienced less of a decline in values than all other cohorts together, many survivors were very large banks from the Loop, where land values were more stable throughout the period. Controlling for size may therefore be important when assessing the role of land value falls. More generally, should there be any relationship between land values and bank failures, it may not be a directly causal one: locations experiencing a larger fall in land values may also be areas in which banks simply made larger amounts of mortgages in the 1920s, which may lead land values to be related to bank failures only indirectly and not through loan losses. Controlling for other financial ratios may therefore also be important. Table 6 reports estimates of the same ordered logistic model as before, only with 1929 balance sheet variables on the right-hand side and the added valuefall variable. In the second column, this variable is interacted with mortgages to see whether declines in land values had a stronger effect on banks that had invested more in real estate loans. Neither the valuefall variable nor its interaction term are significant.
PERCENTAGE OF BANKS BY COHORT FALLING INTO ONE OF THE THREE CATEGORIES OF CUMULATIVE VALUE DECLINE FROM 1926 TO 1931 (LOWEST TO HIGHEST)

Source:
Hoyt (Reference Hoyt1933, pp. 259, 267) and Statements.
ORDERED LOGISTIC MODEL OF BANK FAILURE (ODDS RATIOS), (DEPENDENT VARIABLE: FAILURE_TYPE; EXPLANATORY VARIABLES: JUNE 1929 BALANCE SHEET ITEMS AND VALUEFALL)

Sources:
*** significant at α + 0.01.
** significant at α + 0.05.
* significant at α + 0.10.
Notes:
The variable valuefall is a categorical variable consisting in three categories of intensity in cumulative falls in land values from 1926 to 1931 based on Hoyt (Reference Hoyt1933), from lowest to highest (see text for further details on the computation of this variable). Odds ratios with standard errors based on the original coefficients in parentheses. An odds ratio above one increases the likelihood of survival, whereas an odds ratio below one decreases it. Each ratio variable has been multiplied by 100 so that a one unit increase can be interpreted as a one percentage increase in the ratio.
Source:
Statements.
A simple t-test reveals that deposit losses among all cohorts are uncorrelated with falls in land values. This holds for deposit losses up to December 1930 (Prob > F + 0.701) as well as for deposit losses up to December 1931 (Prob > F + 0.080).
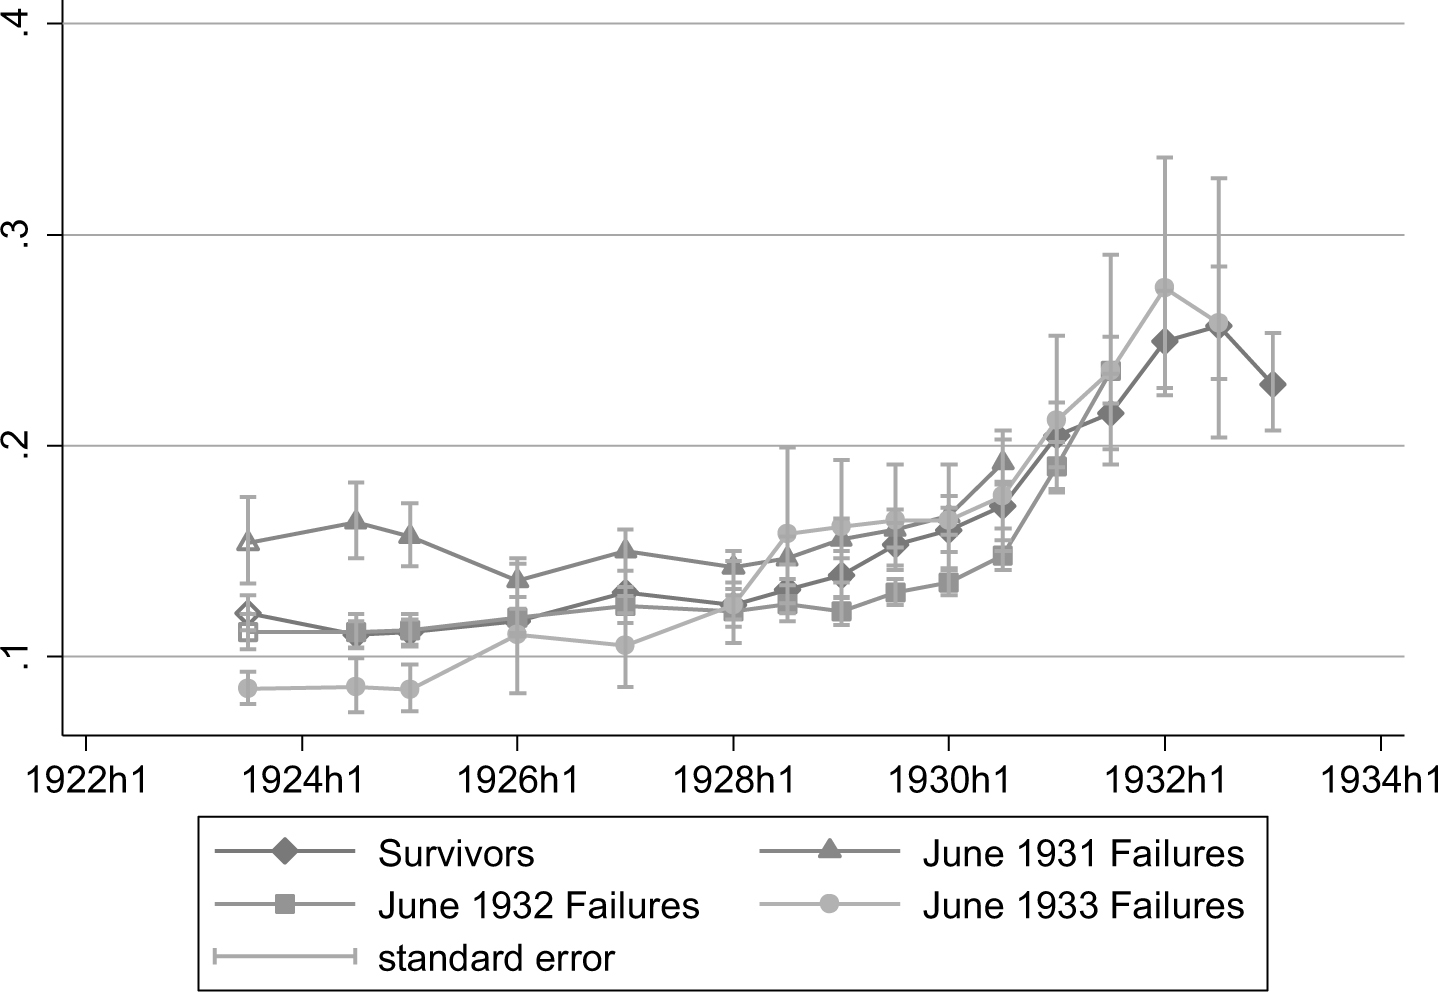
The fact that banks' losses did not have a large impact on bank failure can also be seen in the low predictive power of capital ratios throughout the period (see Table 4). As Figure 4 suggests, June 1931 failures had the highest ratio of capital to total assets through most of the 1920s, despite being the first cohort to fail.
The third and final reason to favour liquidity over quality as an explanation of bank failures is that mortgages were particularly difficult to liquidate. In the interwar period mortgages could neither be sold in the secondary market nor rediscounted at the Federal Reserve. In early 1932 the Reconstruction Finance Corporation (RFC) proposed to lend against “ineligible” collateral, which could include high quality real estate loans. Nevertheless loans against such assets remained proportionately small because the RFC preferred loans with maturities of fewer than six months (Calomiris et al. Reference Calomiris, Mason and Weidenmier2013) and refused to lend against real estate loans' book value, likely taking into account their uncertain quality paramount to their long maturity (Wigmore Reference Wigmore1995, p. 324). In general the RFC remained very cautious and lent against mainly high-quality and liquid collateral, until 1933 when it switched to preferred stock purchases in financial institutions (Calomiris and Mason Reference Calomiris, Joseph R., Ito and O2004; Calomiris et al. Reference Calomiris, Mason and Weidenmier2013; James Reference James1938; Mason Reference Mason2001).Footnote 32
A more fundamental cause of the illiquidity of mortgages was their long contract maturity relative to other loans, usually between three and five years. Their de facto maturity in the 1920s was even longer as it was customary for banks to renew mortgages. As Raymond Saulnier, director of the Financial Research Programme at the National Bureau of Economic Research (NBER), made clear in his 1956 study of 1920s mortgage lending in the United States, “the much lauded feature of full repayment by maturity has been won at the price of extended maturities” (see Morton Reference Morton1956, p. 8; Chapman and Willis Reference Chapman and Willis1934, p. 602).Footnote 33 This created strong expectations of renewal on the part of borrowers. After three or five years, having only made the initial down payments and interest payments, they expected to be given another three to five years to make the final “balloon” payment. An informed commentator from the 1950s gave a vivid description of the phenomenon:
What usually happened was that the average family went along, budgeting for the interest payments on the mortgage, subconsciously regarding the mortgage itself as written for an indefinite period, as if the lender were never going to want his money back (…). This impression was strengthened by the fact that lenders most frequently did renew the mortgage over and over again when money was plentiful (Federal Home Loan Bank Board 1952, pp. 2–5).
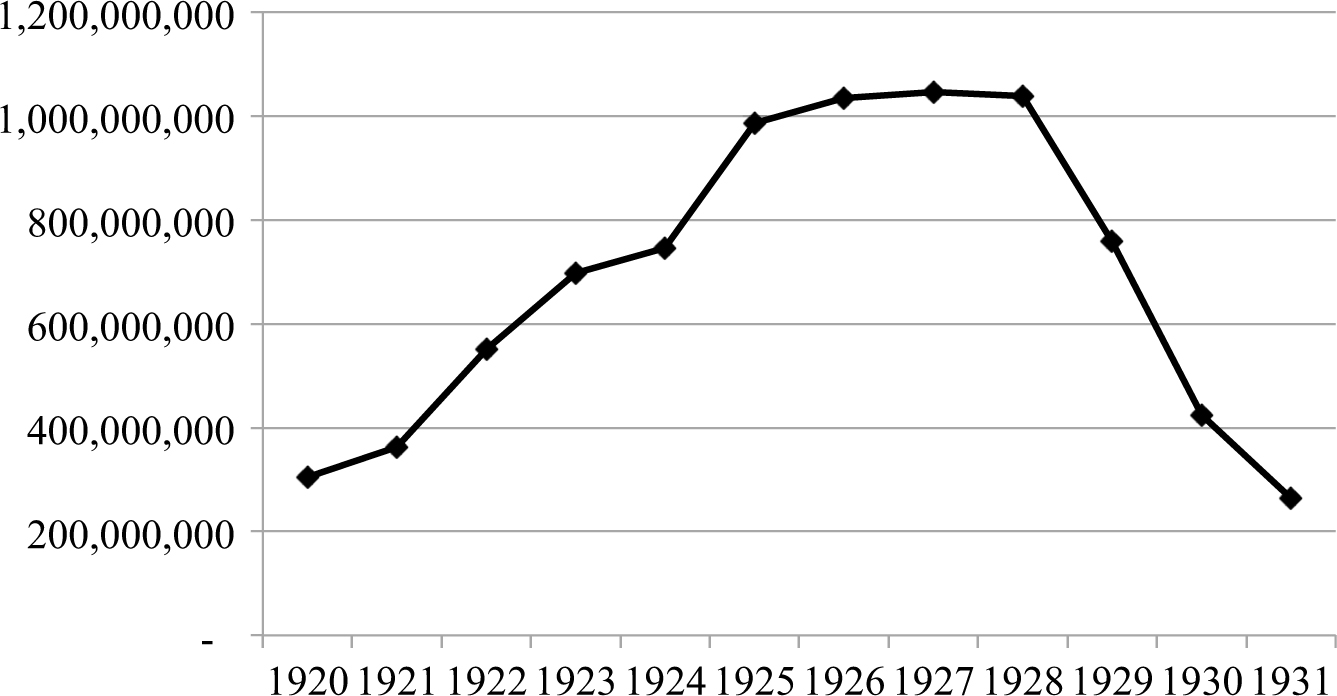
While many loans were made in the boom years of 1925 to 1927 (see Figure 5), those maturing between 1929 and 1930 were likely renewed and would not actually come due before 1932–1935.Footnote 34 Loans maturing for the first time during the Depression would come up for expected renewal, and banks under liquidity pressure would urge unprepared borrowers to pay back their loans. Both cases could create a liquidity shortage, and in the latter, banks may have even been induced to foreclose.
Foreclosure likely would not entail any significant loss thanks to the 50 percent LTV. After foreclosure either the property could be auctioned off to external buyers or, if there were no buyers, the property was repossessed by the bank at an appraisal price. Such repossessed property then sat on the bank's books as non-performing assets (called “other real estate”) until they could be sold again later. The foreclosure price could potentially be lower than the current “market” price. Nevertheless in Depression Chicago transactions were few, foreclosures widespread (Hoyt Reference Hoyt1933, pp. 266–72), and sales prices were probably themselves affected by foreclosures in surrounding areas (this theoretical point is made by Campbell, Giglio, and Pathak Reference Campbell, Giglio and Pathak2011; see also Genesove and Mayer Reference Genesove and Mayer2001). This suggests that gaps between foreclosure and sales prices may not have been very large.
The problem with foreclosures lay elsewhere: the foreclosure process in Illinois lasted more than 18 months on average (Child Reference Child1925; Gries and Ford Reference Gries and Ford1932; Hoppe Reference Hoppe1926; Johnson Reference Johnson1923).Footnote 35 As the vice-president of the banking department of the First National Trust and Savings Bank in Chicago put it:
As to retaining homes, I have heard a lot of talk about foreclosures and that the banks are calling loans and insisting upon repayment and that the borrowers are unable to refund elsewhere, and they are doing this because they are trying to keep their assets liquid. In our State it takes us, at a minimum, 18 months to foreclose a loan, and it will probably be closer to two years and a half, before we acquire title. We are certainly not maintaining our liquid condition by foreclosing loans” (U.S. Congress 1932, part 2, p. 269).
Corroborating evidence can be found in Federal Home Loan Bank Board (1934), which mentions “the dangers attendant on the mortgagee's refusal to renew,” and in Federal Home Loan Bank Board (1952), which reports: “The time of stress came in 1929–30; the short-term mortgage came to maturity against a situation of tight credit and, in many cases, of no credit (…). All too often the lender (…) did not want to renew the loan to the home-owner no matter how high the premium or rate of interest.”Footnote 36
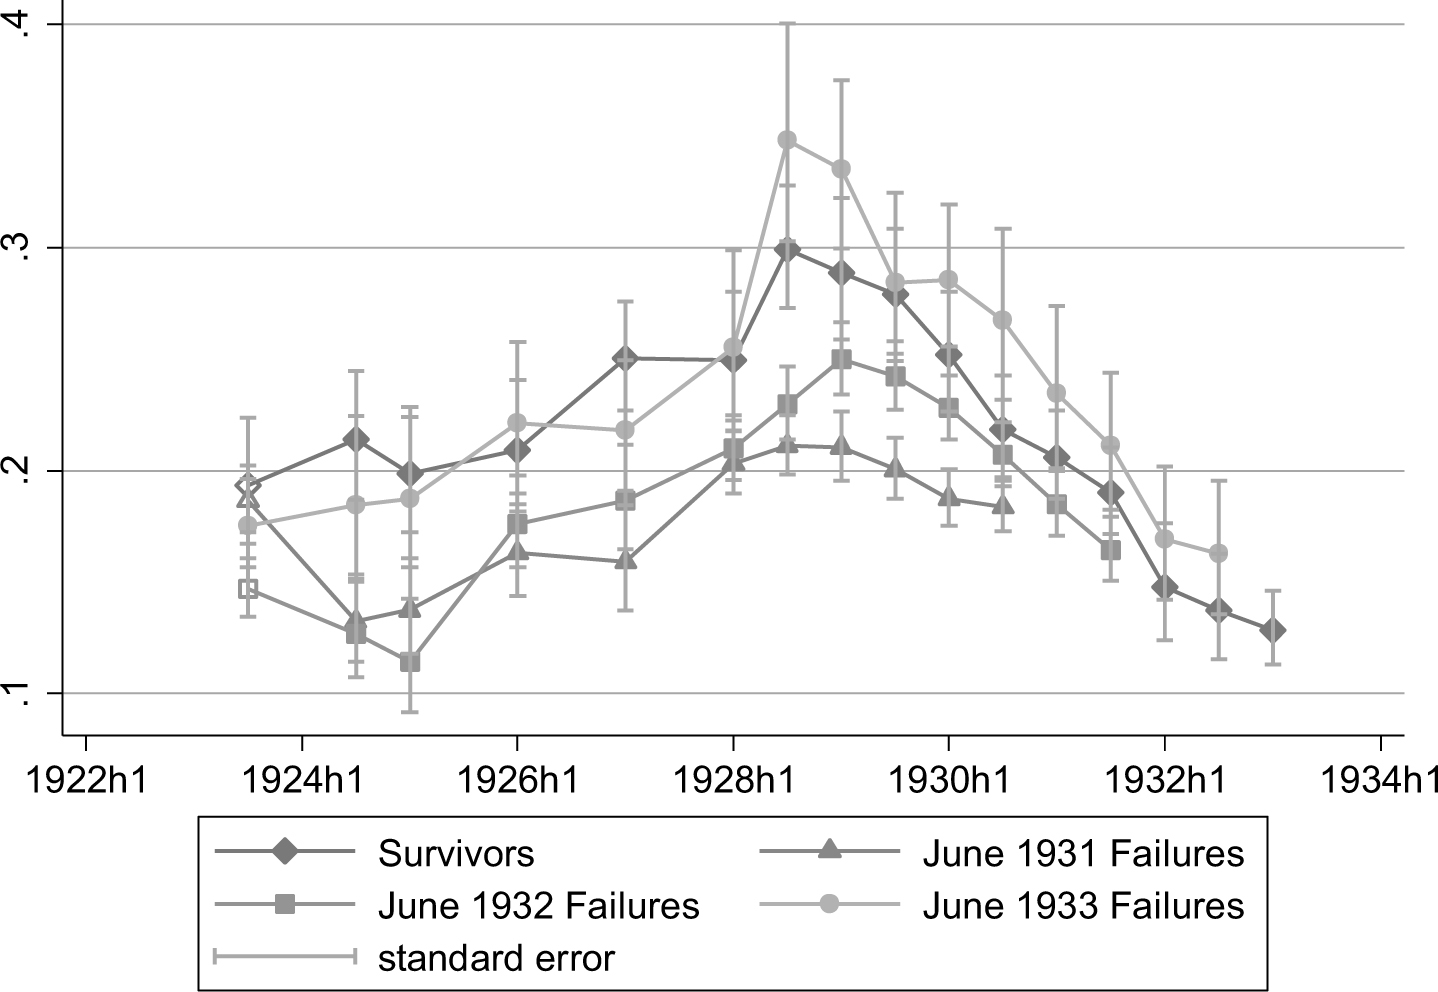
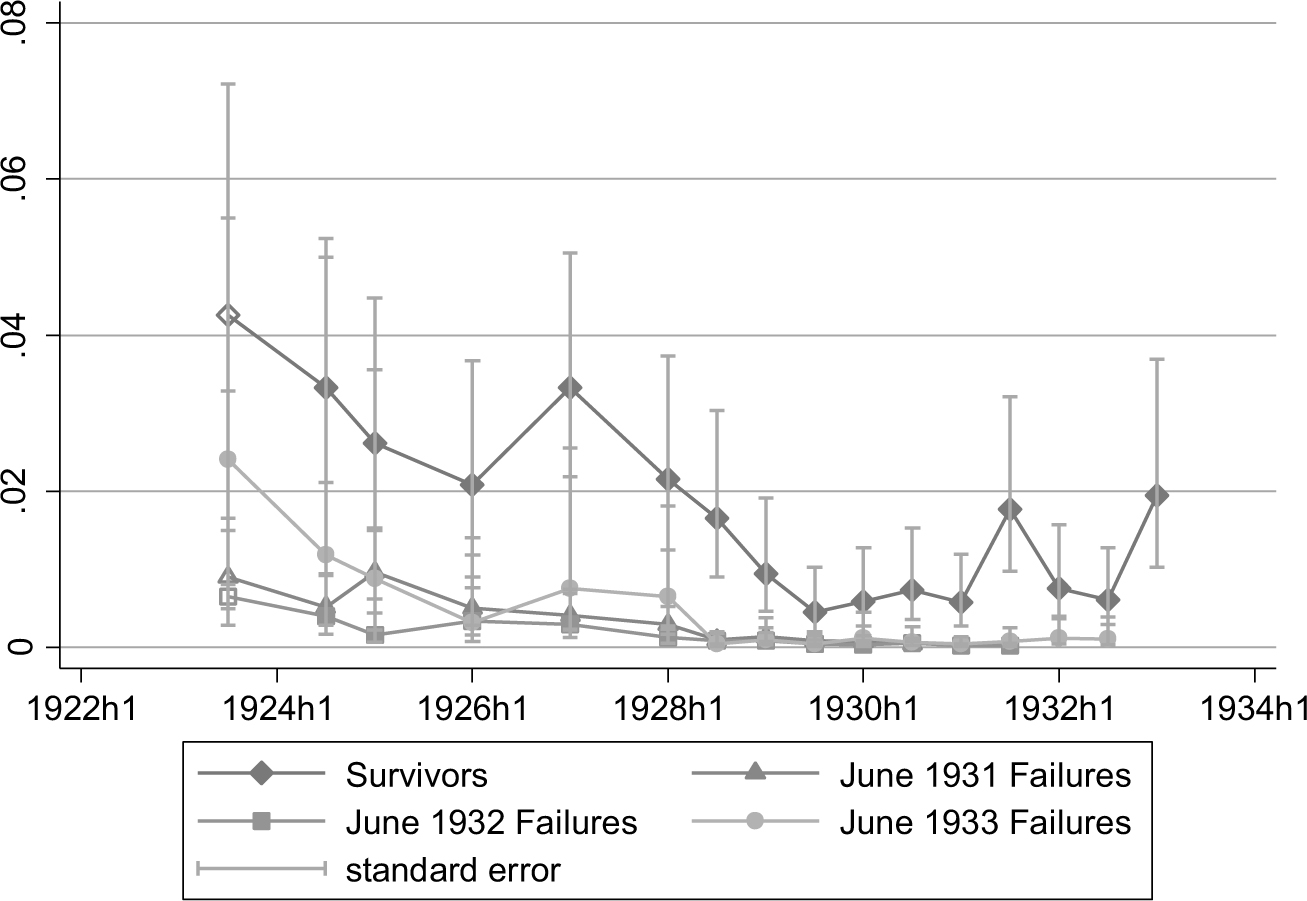
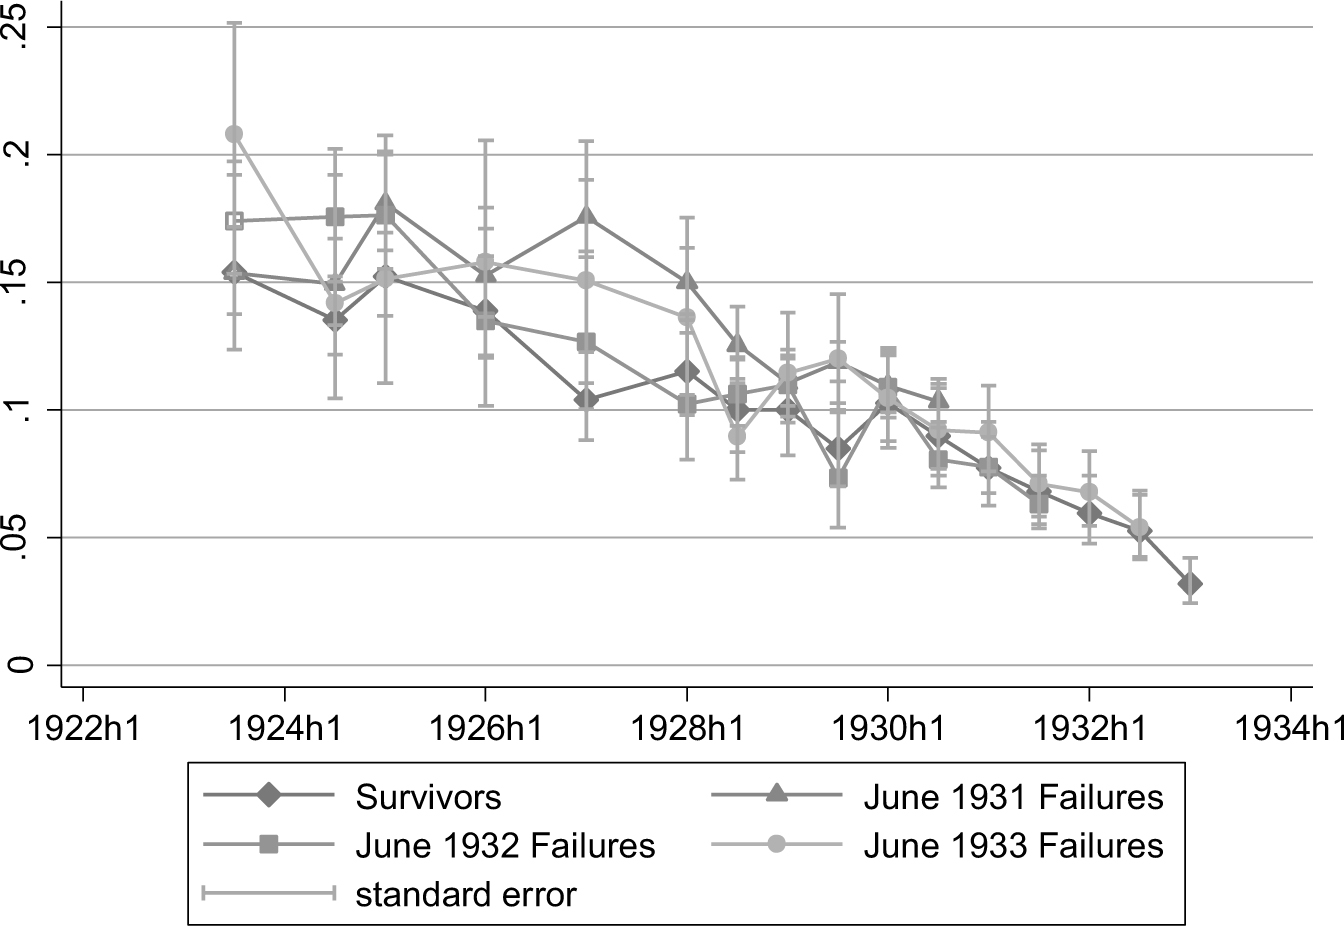
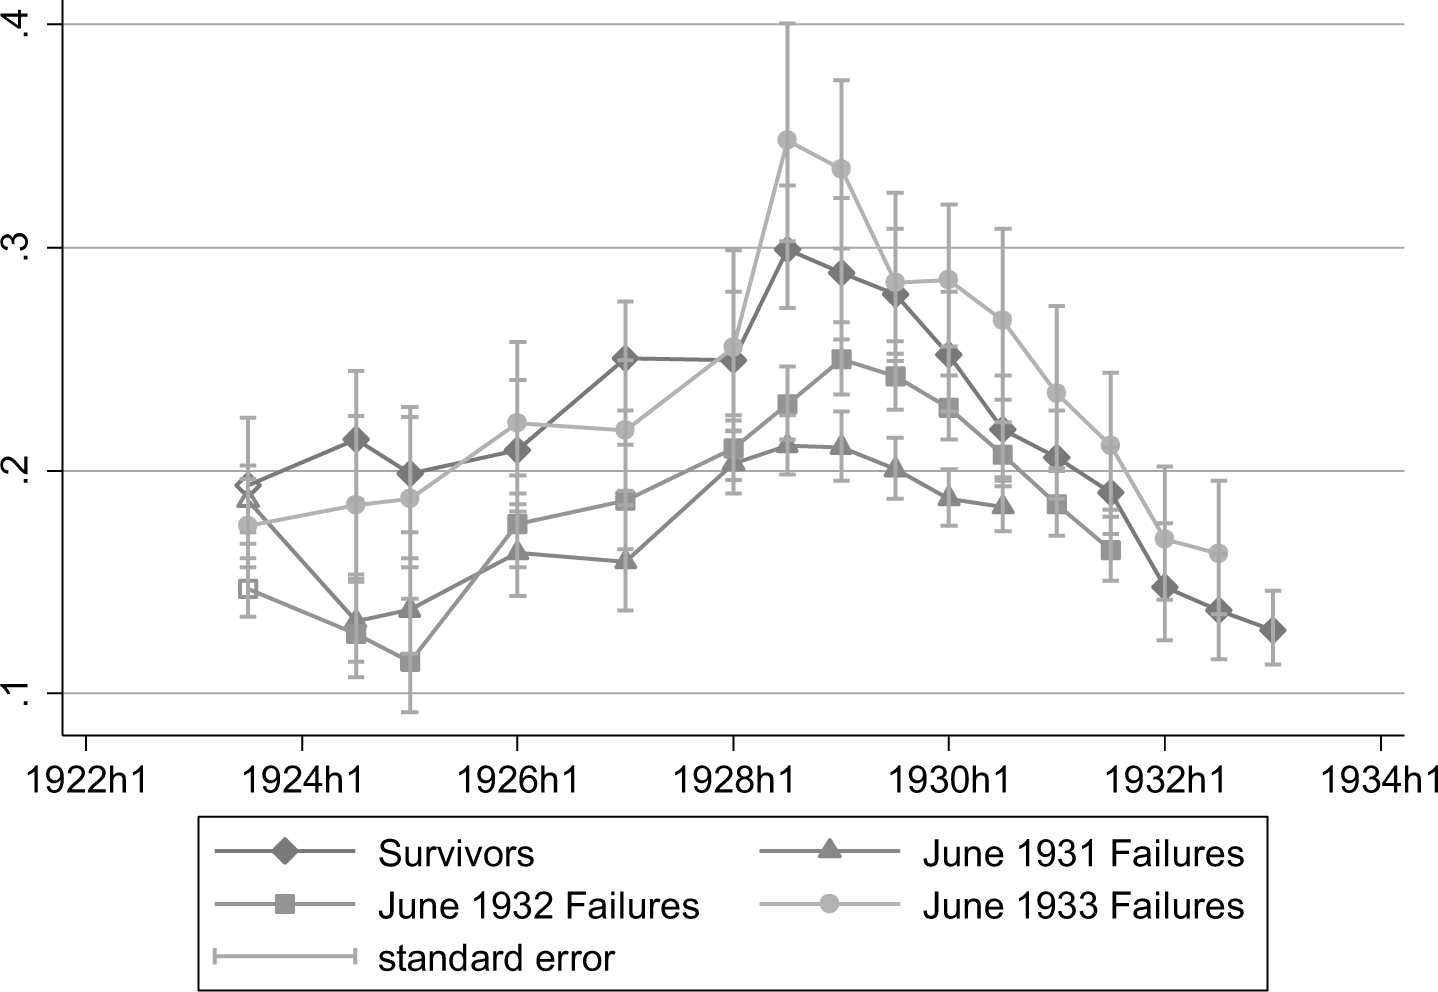
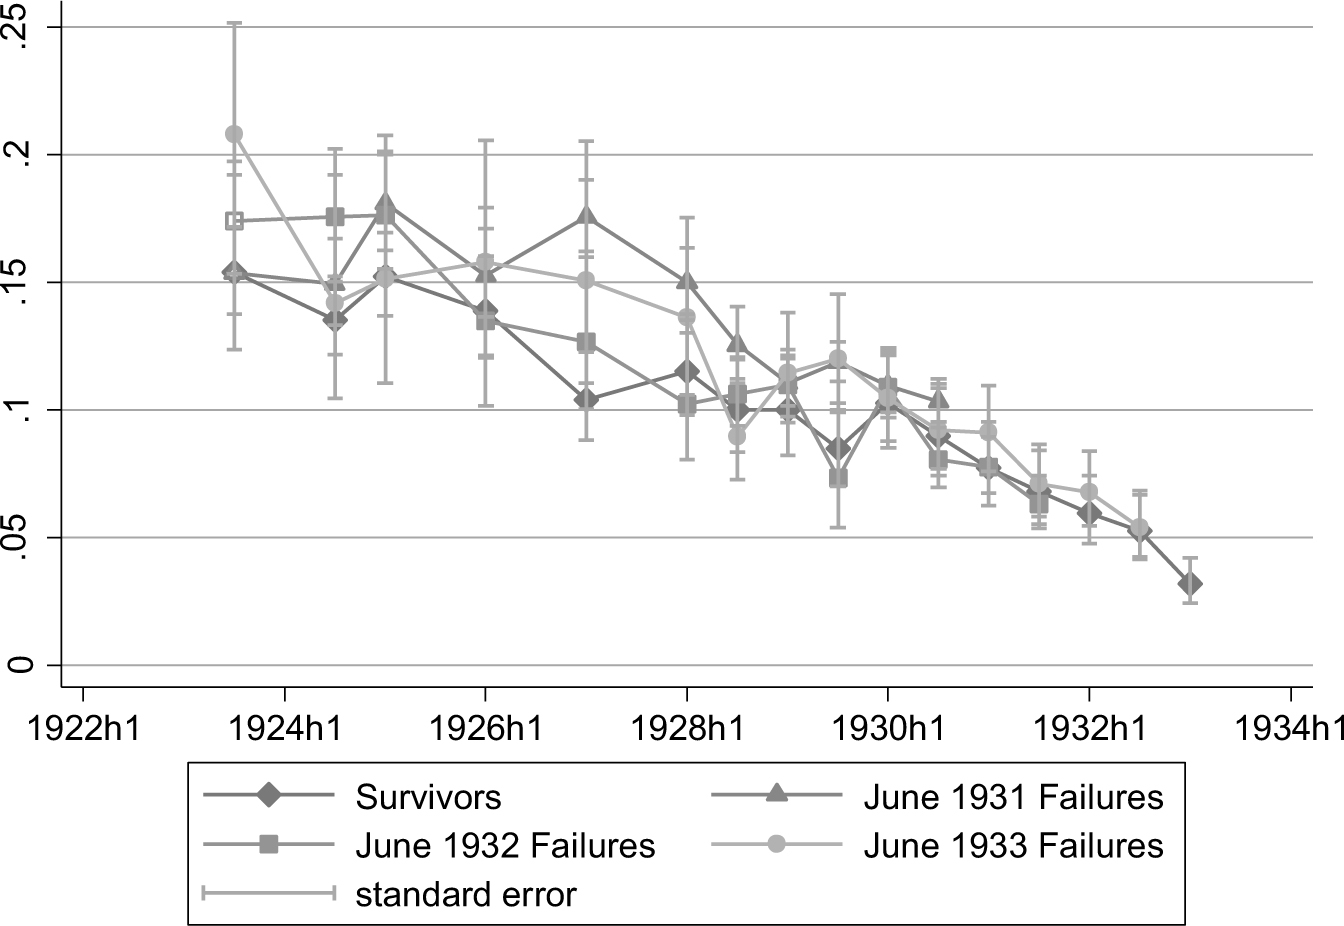
Long maturities and long foreclosure times posed a tremendous challenge to banks. Their effect on bank balance sheets can be seen in Figures 3 and 6 and Appendix Figure 6. Figure 3 showed how real estate loans increased as a share of total assets for all banks during the Depression, at the same time as assets as a whole were diminishing.Footnote 37 By contrast, other types of loans were promptly liquidated in this period. Figure 6 shows the falling share of loans on collateral security owned by banks, while Appendix Figure 6 shows a similar decline in other loans as a share of total assets.Footnote 38 Compared to other assets, therefore, mortgages were particularly difficult to liquidate.Footnote 39
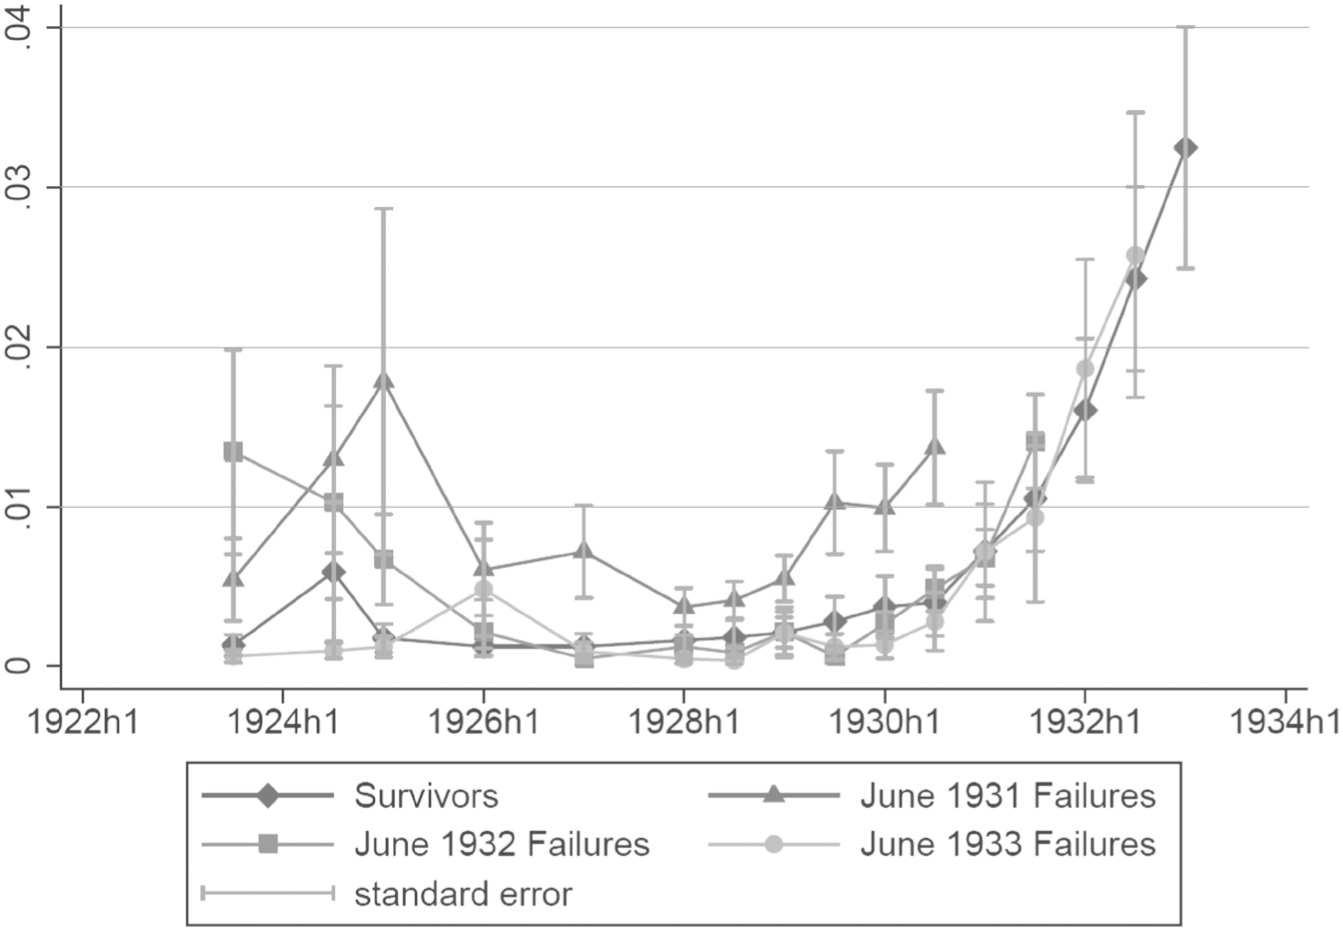
The fate of the variable “other real estate” may seem inconsistent with this conclusion. Other real estate is an asset consisting of property repossessed by banks after real estate foreclosures and before it can be resold. One might question the importance of this variable in explaining bank failures given the very low percentages shown in Appendix Figure 8, which never go much beyond 3 percent, and given the low significance of this variable in the ordered logit model. This can be explained, first, by the fact that mortgages' impact on bank failure could have been strong without any foreclosures taking place. When foreclosures did occur, it is precisely their very lengthy process that would have created liquidity problems for banks. Each cohort's last data point represents its status at the last call before failure, and each call occurred only every six months. This means that if many banks failed between April and June, which was the case for the first two failing cohorts, it is likely that much of their repossessed property would not have been recorded by December before this date. Thus, the lengthy foreclosure process increases the odds that many of the effects of foreclosure are not visible on this graph (Child Reference Child1925; Hoppe Reference Hoppe1926; Johnson Reference Johnson1923).
CONCLUSION
This study of the long-term behaviour of Chicago banks in the 1920s has yielded new insights into the causes of bank failures in the 1930s. I have argued that banks' long-term investments in illiquid assets (especially mortgages) severely weakened their position when they faced large withdrawals on their deposits. Though restricted to Chicago, these results reassert the role that liquidity issues played in the Great Depression, both on the liability and the asset sides of the balance sheet. More specifically, they suggest that a solvent but ex ante less liquid bank is not necessarily healthy, and that liquidity risk management is just as important as credit risk management when the risk of bank runs is greater than zero.
This article has also reassessed the role that mortgage investments played in the Great Depression via the banking channel. Parallels with the recent crisis may be drawn, despite major differences in mortgage contracts then and now. In both cases, banks suffered tremendous liquidity shocks on the uninsured liability side of their balance sheets. These shocks highlighted the impact of maturity mismatches between long-term assets and short-term liabilities (Brunnermeier Reference Brunnermeier2008; Gorton and Metrick Reference Gorton and Metrick2012). Securitization can potentially increase the liquidity of mortgages by making them more salable and by distributing different kinds of risks to different types of investors. But securitization needs to be undertaken in the right way (see Postel-Vinay 2Reference Postel-Vinay014a).
Central banks can in theory help during a liquidity crisis by following Bagehot's rule and lending on good collateral. Although central banks play an essential role during crises, it is always difficult for them to gauge the precise quality (credit risk) of an asset—especially if the asset is a long-term one, thereby creating more uncertainty about its long-term value (Goodhart Reference Goodhart2008, Reference Goodhart2010). By lending against such doubtful collateral as mortgage-backed securities, the Federal Reserve has had a controversial role in the recent crisis (Bordo and Landon-Lane Reference Bordo and Landon-Lane2010; Schleifer and Vishny Reference Schleifer and Vishny2011; Gorton and Metrick Reference Gorton and Metrick2013; Stein Reference Stein2013).Footnote 40
Because central bank help will likely never be entirely adequate, it is important for commercial banks to attend to the inherent liquidity of their portfolios. Of course, nowadays assets' liquidity increasingly depends on their underlying quality as their tradeability varies with their perceived quality. Nevertheless some assets, especially longer-term ones, are still inherently less liquid than others either because of the slow underlying cash flow itself or because of the uncertainty attached to their long maturity.
No bank will ever be perfectly hedged in terms of its maturity profile, but promoting liquidity in a preventive regulatory framework, perhaps through countercyclical cash ratios, would be a good start. In this article, cash did not matter in the sense that differences in mortgage holdings made a larger difference. But we may conjecture that, had banks holding more mortgages also held more cash, they would not have responded so badly to bank runs.Footnote 41
Appendix
Sources, Name Changes, and Consolidations
This study uses the Statements of State Banks of Illinois. The Reports of Condition from the Office of the Comptroller of Currency focus on all member banks (both state and national) nationwide at disaggregated levels, and contain very detailed information on individual banks, including qualitative information. For my study these reports would have proved insufficient: the extant reports for state member banks are available for the same dates as the Statements and are less complete since they include only state member banks, and for national member banks the only available reports are for December 1929 and December 1931.Footnote 42 Focusing on state banks should not be a problem since in December 1929 state banks made up 95.5 percent of all banks in the city (University of Illinois Bulletin 1929) and 87.6 percent of all suspensions, whereas national banks accounted for only 12.4 percent of suspensions (White Reference White1984).
Creating cohorts is one way of keeping track of the same sample of banks over time, whether failures or survivors. Name changes were corrected in 26 instances, but I still had to make decisions about whether to include a merger or acquisition in the failing or surviving categories. Most authors include such consolidations as failures; that is, a bank that was taken over is usually considered a failure, and so are both of the banks that merged, even when the merger itself ended up surviving the Depression. For instance, Calomiris and Mason (Reference Calomiris and Joseph R.2003) specify that their data “contain almost seventy different ways a bank can exit the dataset, ranging from all imaginable types of mergers and acquisitions to relatively simple voluntary liquidations and receiverships; […] together, we term [them] failures.” The Reports of Condition they used were more detailed in this respect, and I do not have data on “all types of mergers and acquisitions.” Nevertheless, the Rand McNally directory gives sufficient detail at least on whether a merger or a simple takeover occurred.
As in Calomiris and Mason (Reference Calomiris and Joseph R.2003) I thought it reasonable to count as failures banks that were taken over by other banks. This occurred in 14 cases since June 1929. The banks that were taken over before June 1929 are not taken into account in the sense that only the resulting consolidation should be part of a cohort. Exactly the same applies to pre-June 1929 mergers: only the resulting merger can be part of a cohort and thus only this bank will be tracked as early as possible in the 1920s. Appendix Table 1 shows the state mergers that occurred since June 1929 and whether the merger ended up failing or not.
For the mergers that had failed by June 1933, there is no apparent dilemma regarding how to classify the original consolidating banks. That is, when a merger ended up failing, the two original banks' data could be kept until they merge under a new name, at which point the new merger's data could be excluded from the dataset, making the two original banks failures at the time of consolidation. Yet this decision sounds slightly arbitrary given the fact that a healthy bank may have merged with a less healthy bank which may have dragged the former into bankruptcy. In the first and third cases shown in Appendix Table 1, it was actually possible to divide the merger's balance sheet in two proportional parts and make the two original banks continue until the time the merger itself fails. In the second case, the merger itself fails in August 1930 so it could not be part of any cohort. Results are robust to different categorizations.
STATE MERGERS BETWEEN JUNE 1929 AND JUNE 1933
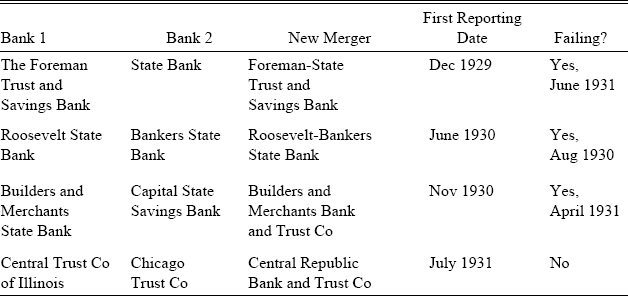
In the dataset only one state merger actually survived in Chicago: the Central Republic Bank and Trust Co., a July 1931 consolidation of Central Trust Co. of Illinois, Chicago Trust Co. and a national bank, the National Bank of the Republic. As in the previous cases, it was decided that both state banks would be kept “alive” by taking the items on the balance sheet of the new merger and splitting them into parts proportional to each original bank's share of the total.Footnote 43
Finally, it seems necessary to specifically discuss the case of the Continental Illinois Bank and Trust Company, which was the largest bank in Chicago in 1929, and which with the First National Bank (as its name indicates, a national bank) “towered over the Chicago money market like giants” (James Reference James1938, p. 952). Together they were responsible for about half the business transacted in the city (ibid.). Initially this bank was not included in the sample, for the simple reason that it apparently failed in December 1932 and thus could not be part of a particular cohort. However, it was soon discovered that the “failure” of the bank was in fact due to a rare phenomenon at the time: the fact that it adopted a national charter. The Chicago Tribune titled in October 1932 “CONTINENTAL GETS NATIONAL BANK CHARTER” which was at the time seen as a strange kind of event (Chicago Tribune, 1932). One of the reasons this happened, as the article explained, is that national banking laws were in the process of being changed to allow branching everywhere, including in states that technically forbade it. As the crisis made clear to some bank managers the potential benefits of branching, it is not surprising that a strong bank like Continental Illinois sought a national charter, and was granted one.Footnote 44 The bank was thus manually categorised as a survivor.
Deposit Losses
Appendix Table 2 reports tests of differences between mean deposit growth rates.
TESTS OF DIFFERENCES BETWEEN MEAN DEPOSIT GROWTH RATES

Additional Financial Ratios
Appendix Figures 1, 2, 3, 4, 5, 6, and 7 show the reserve-deposit ratio, U.S. government bonds, banking house, borrowed funds, retained earnings to net worth, other loans, and other real estate. The relative importance of government bonds, which was also noted in Table 4, can likely be explained by its important role in liquidity maintenance during crises.
CASH RESERVES TO TOTAL DEPOSITS (CASH, OTHER CASH RESOURCES, DUE FROM OTHER BANKS)
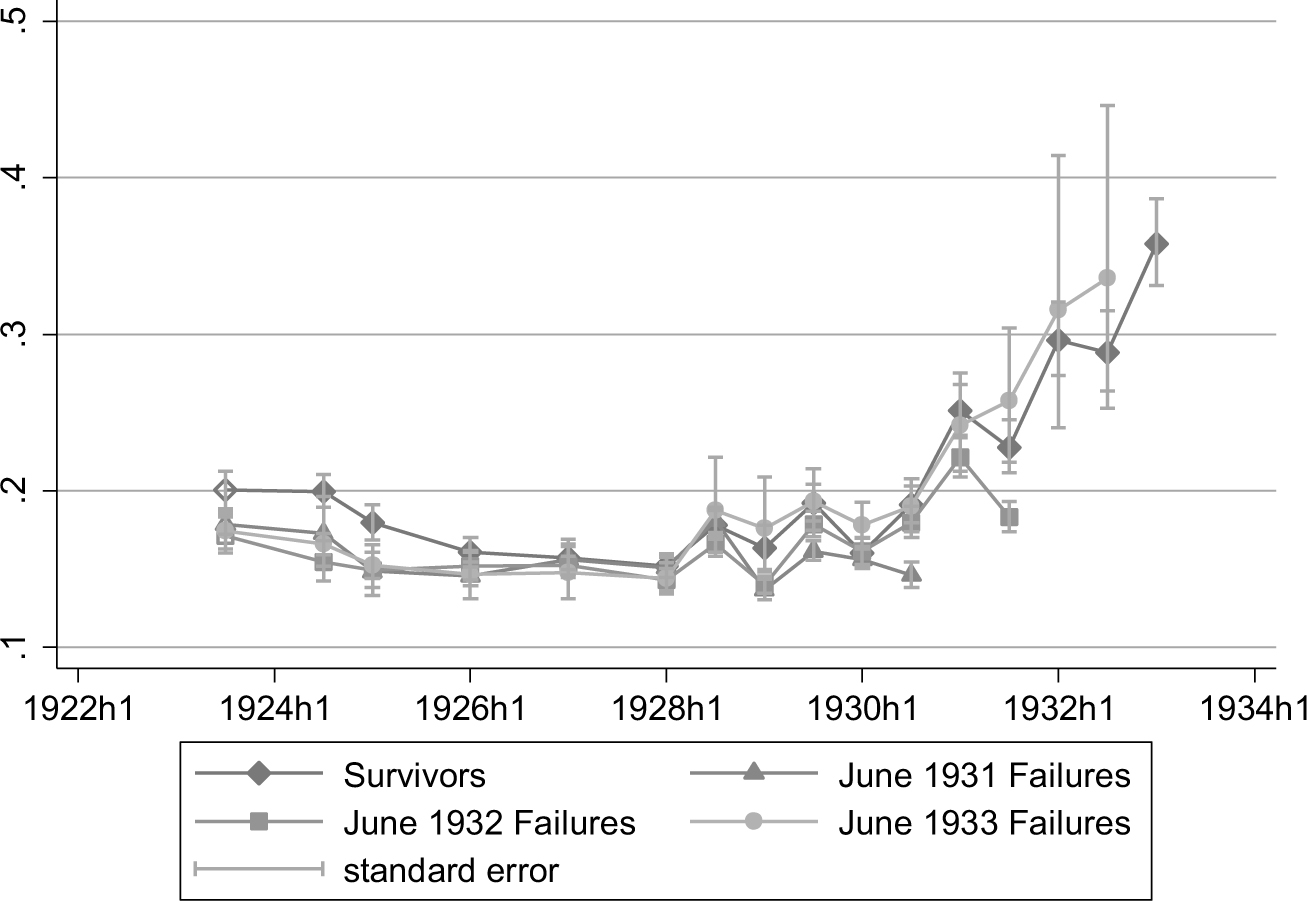
U.S. GOVERNMENT BONDS TO TOTAL ASSETS
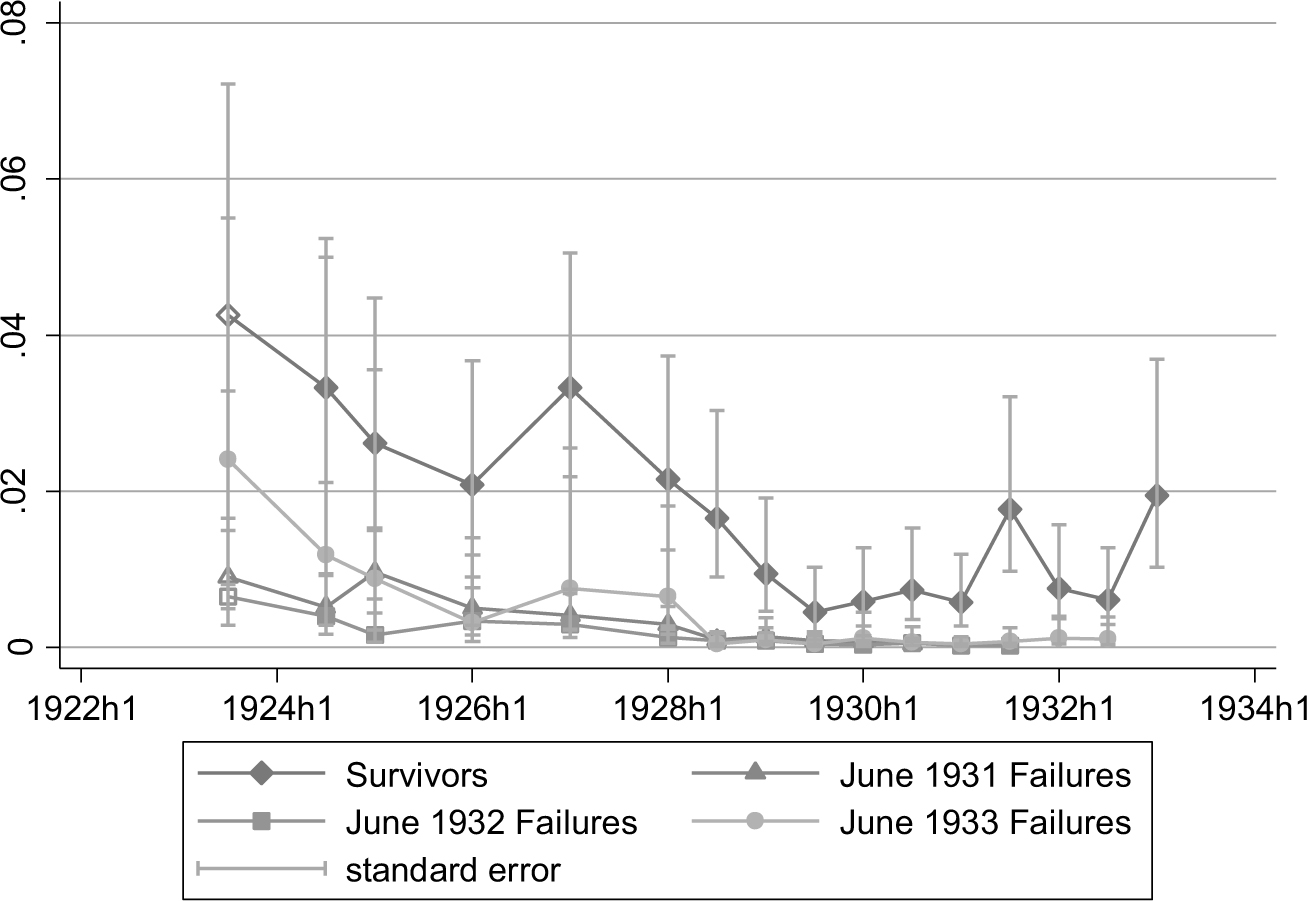
BANKING HOUSE, FURNITURE AND FIXTURES TO TOTAL ASSETS
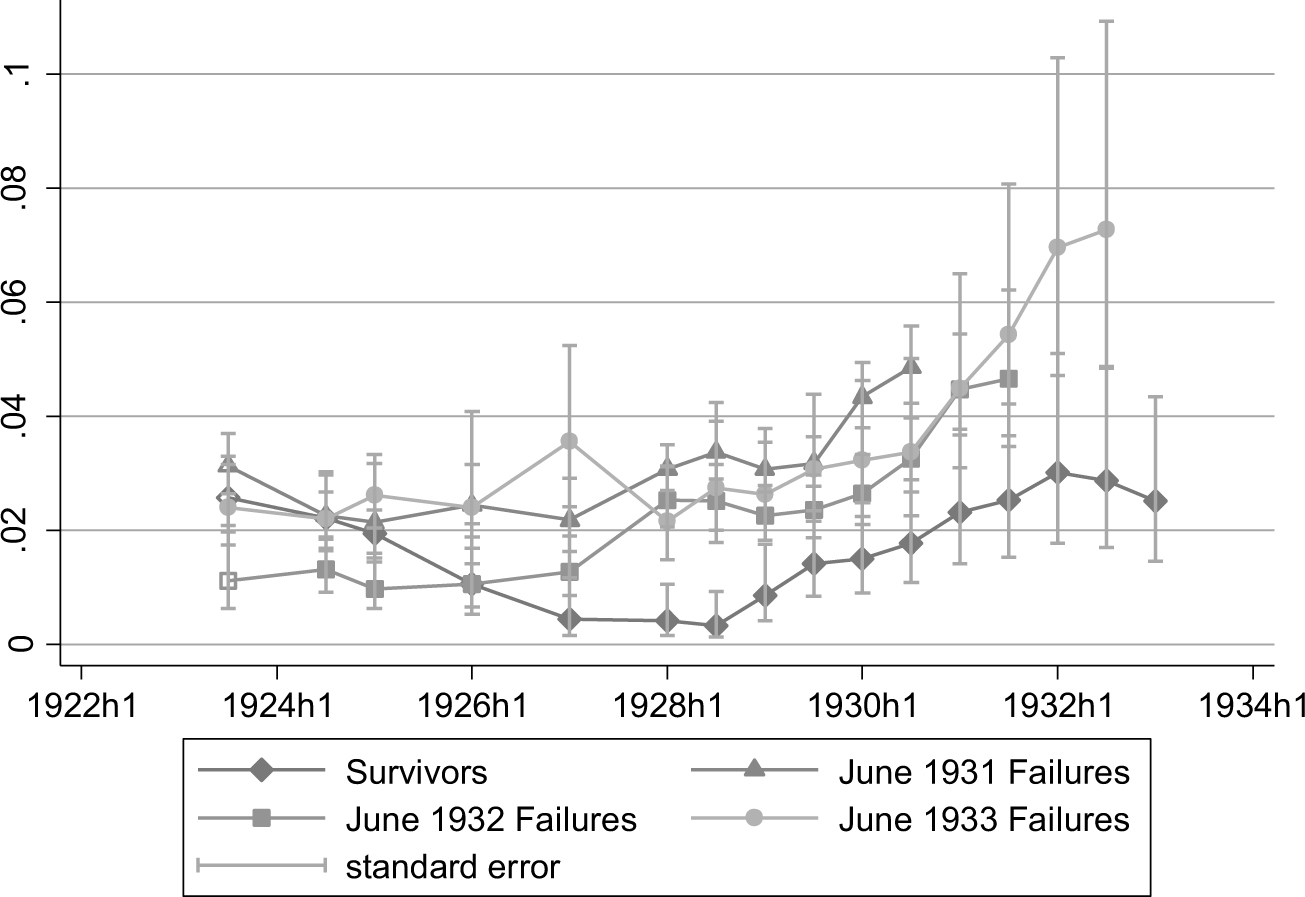
BILLS PAYABLE AND REDISCOUNTS TO TOTAL ASSETS

RETAINED EARNINGS TO NET WORTH
OTHER LOANS TO TOTAL ASSETS
OTHER REAL ESTATE TO TOTAL ASSETS
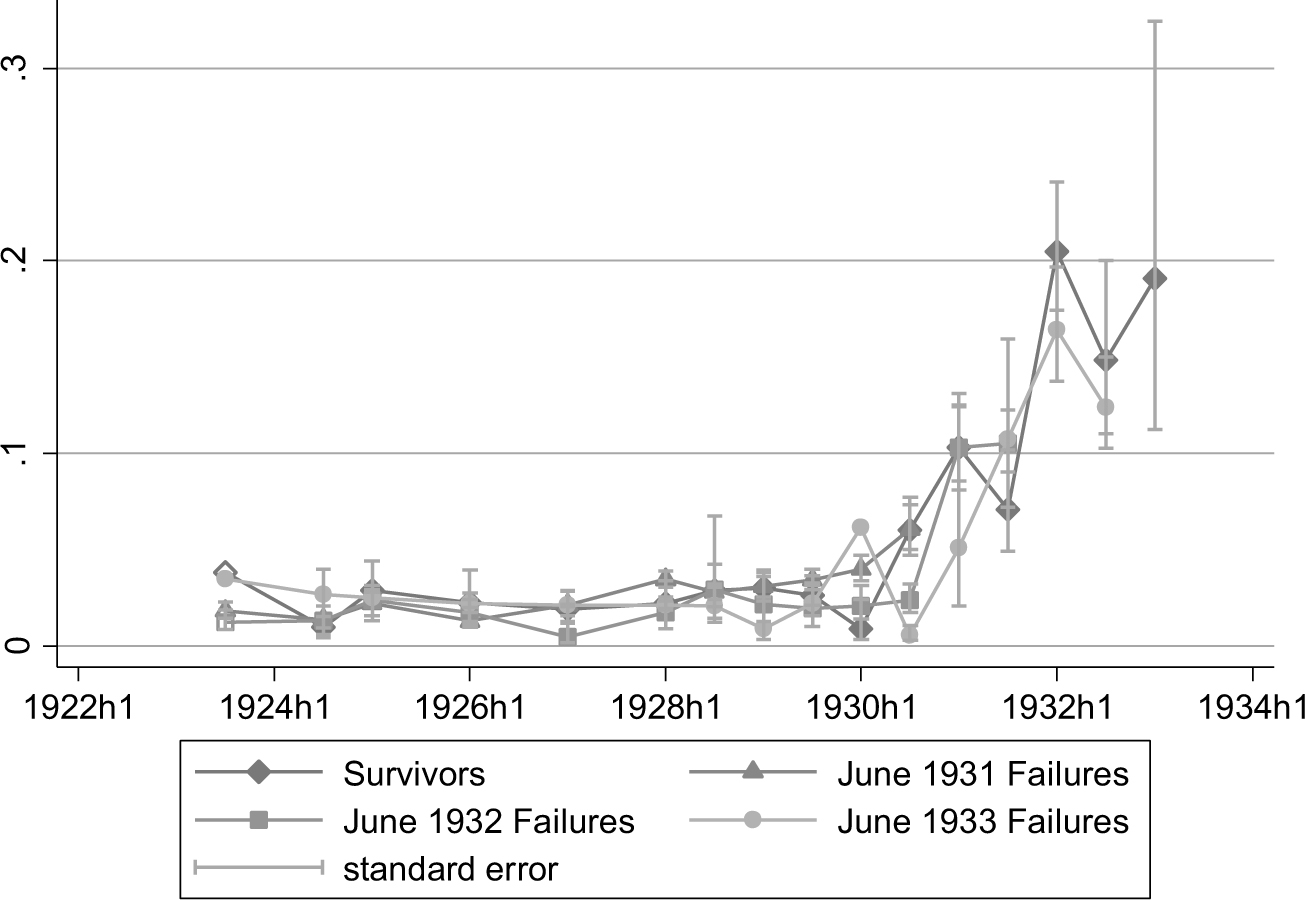
Bills payable and rediscounts are a form of long-term, high interest debt, which is a good indicator of bank trouble, as when deposits are withdrawn from risky banks, they are forced to rely on high-cost debt (Calomiris and Mason Reference Calomiris and Joseph R.1997). Appendix Figure 4 thus shows banks' race for liquidity as they started losing deposits. In December 1931, for instance, when survivors lost slightly fewer deposits than the June 1932 Failures, they also secured fewer funds from these sources. Note however that the interpretation of this variable is not straightforward, as it could also reflect creditors' confidence (or lack thereof) in the bank.Footnote 45
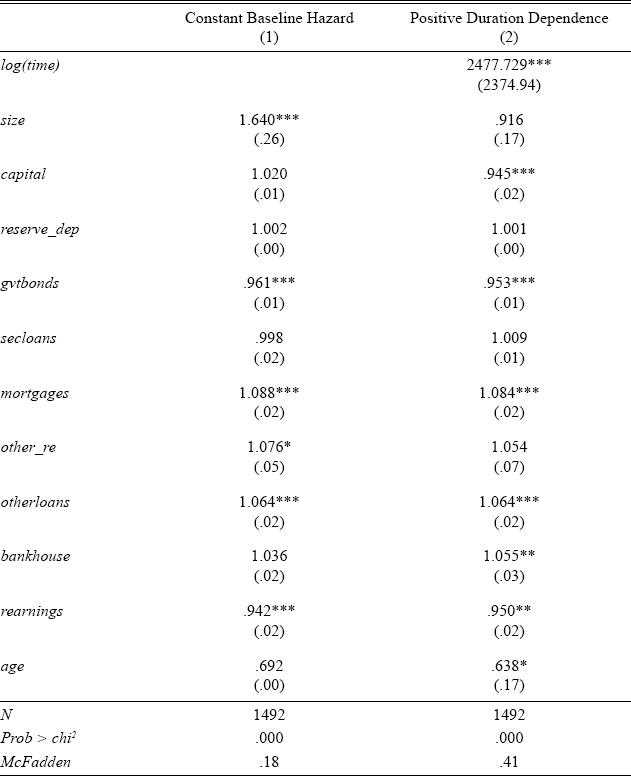
Discrete-Time Hazard Estimates
Appendix Table 3 reports estimates of discrete time hazard models. As mentioned above, survival models necessarily take into account within-Depression covariates and therefore cannot test the importance of pre-Depression variables as well as ordered logit can. Adding time dummies with interactions could potentially help, but with this particular dataset the hazard rate is frequently zero in pre-Depression years, so that pre-Depression effects cannot be efficiently estimated (time dummies are automatically omitted).
PROPORTIONAL ODDS DISCRETE-TIME SURVIVAL MODELS, 1923–1933 (BINARY DEPENDENT VARIABLE EQUALS ONE AT THE TIME OF FAILURE), ODDS RATIOS

Nevertheless the results are of some interest. Both models are discrete-time proportional odds (logit) models, chosen among other survival frameworks (such as continuous time survival models) due to the frequency of the data, which is halfyearly.
If T is survival time and T + t the time of failure, then the discrete hazard for this model is:

where β is the baseline hazard, X a vector of explanatory variables, and γ a vector of variable-specific parameters.
The first model in Appendix Table 3 assumes a constant baseline hazard, which may not be wholly adapted to the dataset since the hazard rate greatly increased as the Depression unfolded. For this reason a second model, assuming positive time duration, is estimated in the second column. The time variable is very significant, and the McFadden R-squared much higher, suggesting that this model is a better fit than the previous one. Odds ratios are reported, which in such models can be interpreted as hazard ratios. Hazard ratios between zero and one decrease the probability of failure; hazard ratios above one increase it.
In this model it can be seen that many variables are significant—more so than in the ordered logit models. This could be interpreted as a sign that the Depression exacerbated differences between banks. The most powerful variable, however, remains mortgages to total asset, with a hazard ratio of 1.084.
Problems with Unit Banking
In the 1920s all Chicago state banks operated under the unit banking system; they were not allowed to open branches as Illinois banking law forbade it. Problems linked to unit banking were numerous. The main reason branch banking is usually thought of as an advantage is that it increases portfolio diversification. Branch banking can be contrasted to group or chain-banking as branches of the same bank can pool their assets and liabilities together. When there is a liquidity shortage at one of the banks in a chain, other member banks cannot simply transfer funds to that bank for help, a problem which does not even arise in the branch banking system. This may partly explain the collapse of the Bain chain in June 1931 which triggered the banking crisis at that time (James Reference James1938, p. 994).
Yet the lack of portfolio diversification was not necessarily directly due to the unit banking system. Indeed, Rodkey points to the fact that many small bankers prior to the Depression felt a moral duty to “meet all demands for good local loans” (Rodkey, Reference Rodkey1944, p. 4). It also seems that the lack of portfolio diversification was not the only disadvantage of unit banking. Rodkey blamed this system for fostering the incompetence of bank managers:
This system leads naturally to a multiplicity of small banks under local control, owned locally, and operated usually by citizens of the home community who may or may not have some knowledge of the fundamental principles of sound banking (Rodkey Reference Rodkey1935, p. 147).
Thus, by triggering the establishment of many small banks, unit banking made it easier for inexperienced bankers to become managers.Footnote 46 Rodkey also pointed out that little attention was given to the ability of the borrower to meet his interest payments (ibid., p. 122).
The ease with which almost any kind of manager could open a small community bank and the resulting lack of experience of such unit bank managers in Illinois stand out as potentially serious problems when the Chicago mortgage boom is taken into account.
Bank Size
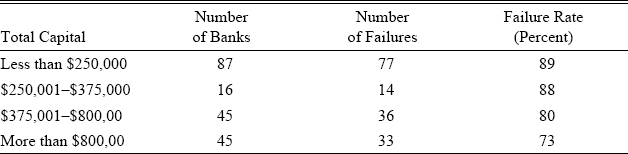
Bank size should not introduce bias in the results as long as financial ratios are used. When looking at the main indicators of bank size (total assets, total capital, and sometimes total deposits), it appears that larger banks did tend to have a higher survivor rate. However, one of the aims of this article is precisely to show that this was certainly not the only reason for their survival (of course, it may be that there is a correlation between larger bank size and better management practice). Appendix Table 4 shows the failure rate per size group.
RELATIONSHIP BETWEEN BANK SIZE AND FAILURE RATE, JUNE 1929–JUNE 1933

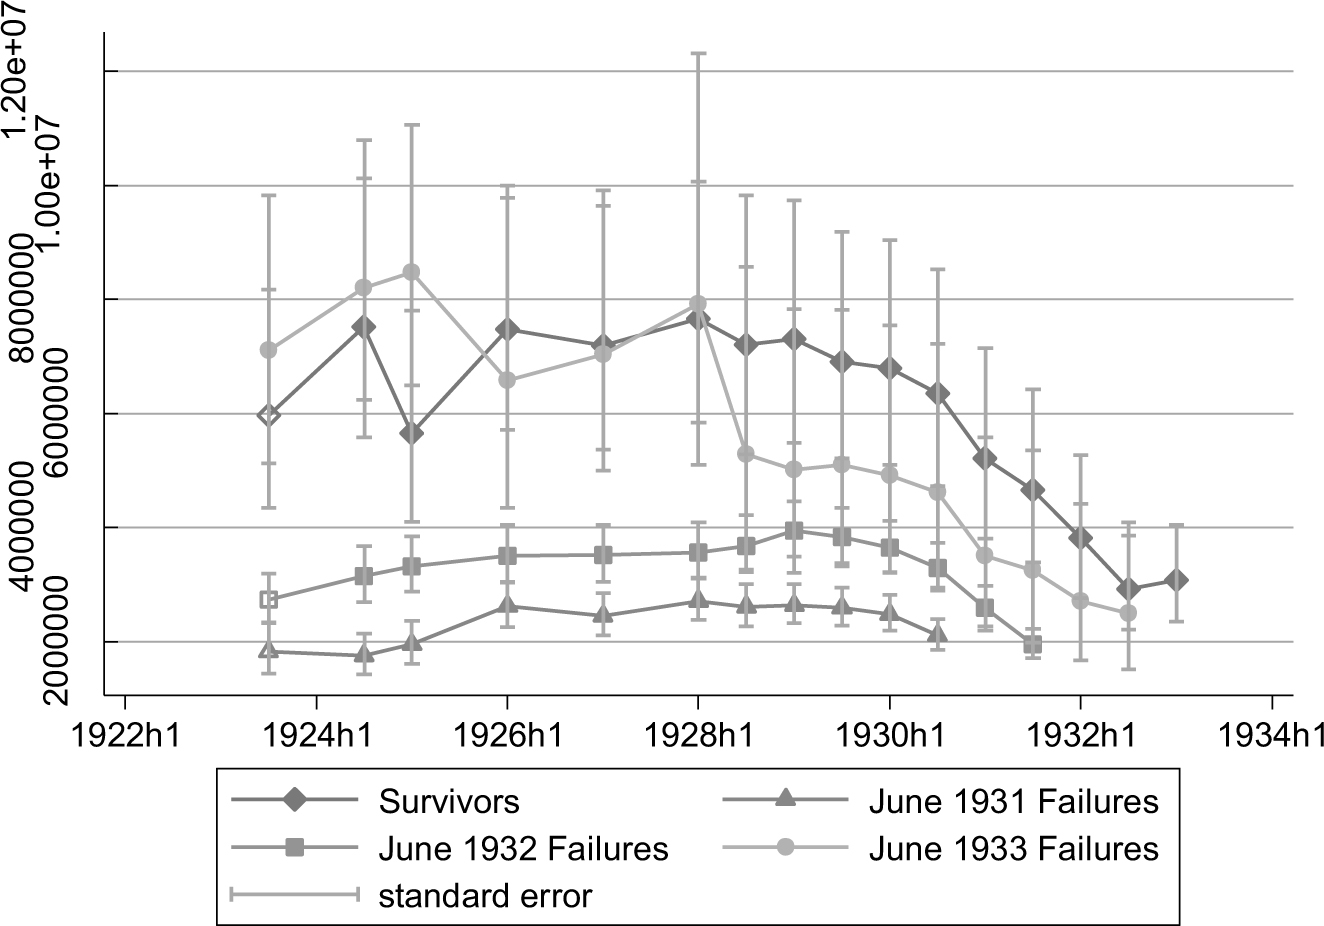
From this table it appears that there is indeed a relationship between size and failure, although this relationship is not very strong. True, whether large or small, banks had a high failure rate, always above 70 percent. Nevertheless, it is still noticeable that banks with less than $250,000 in capital had 89 percent chances of failing, whereas banks whose capital went beyond $800,000 “only” had a failure rate of 73 percent. Looking at total assets for the whole period, the differences are even more striking (see Appendix Figure 8).
TOTAL ASSETS

Mortgage Growth Rates
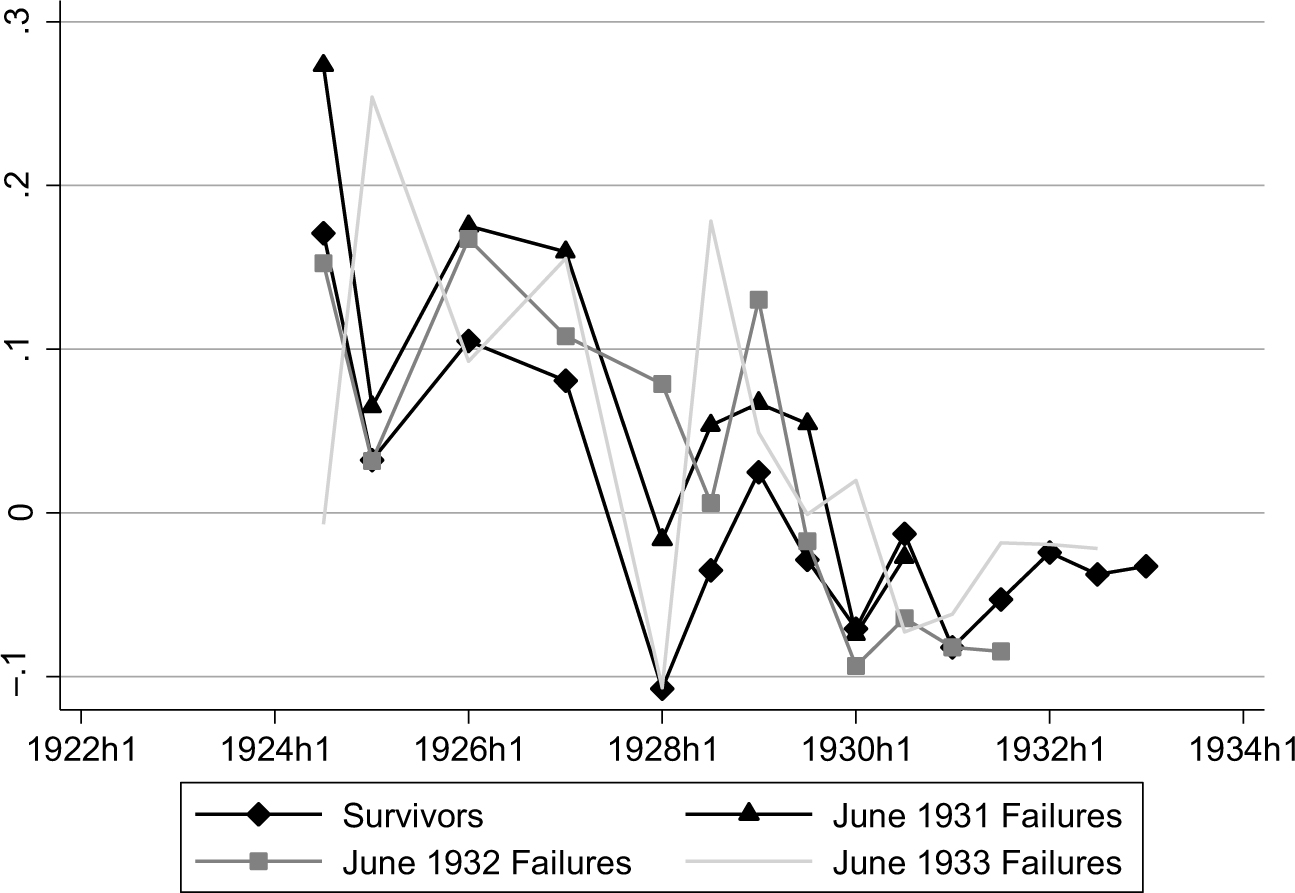
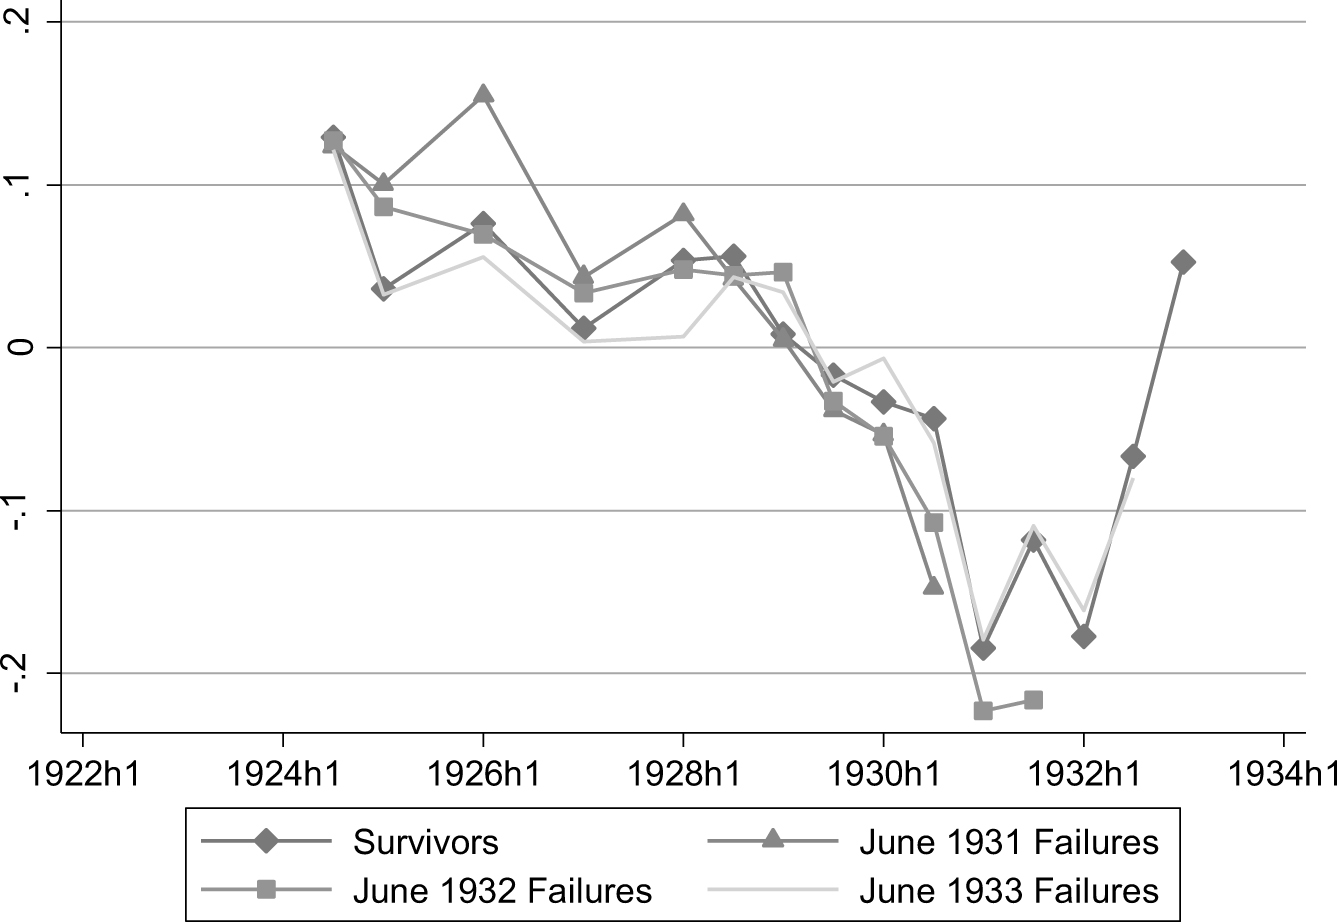
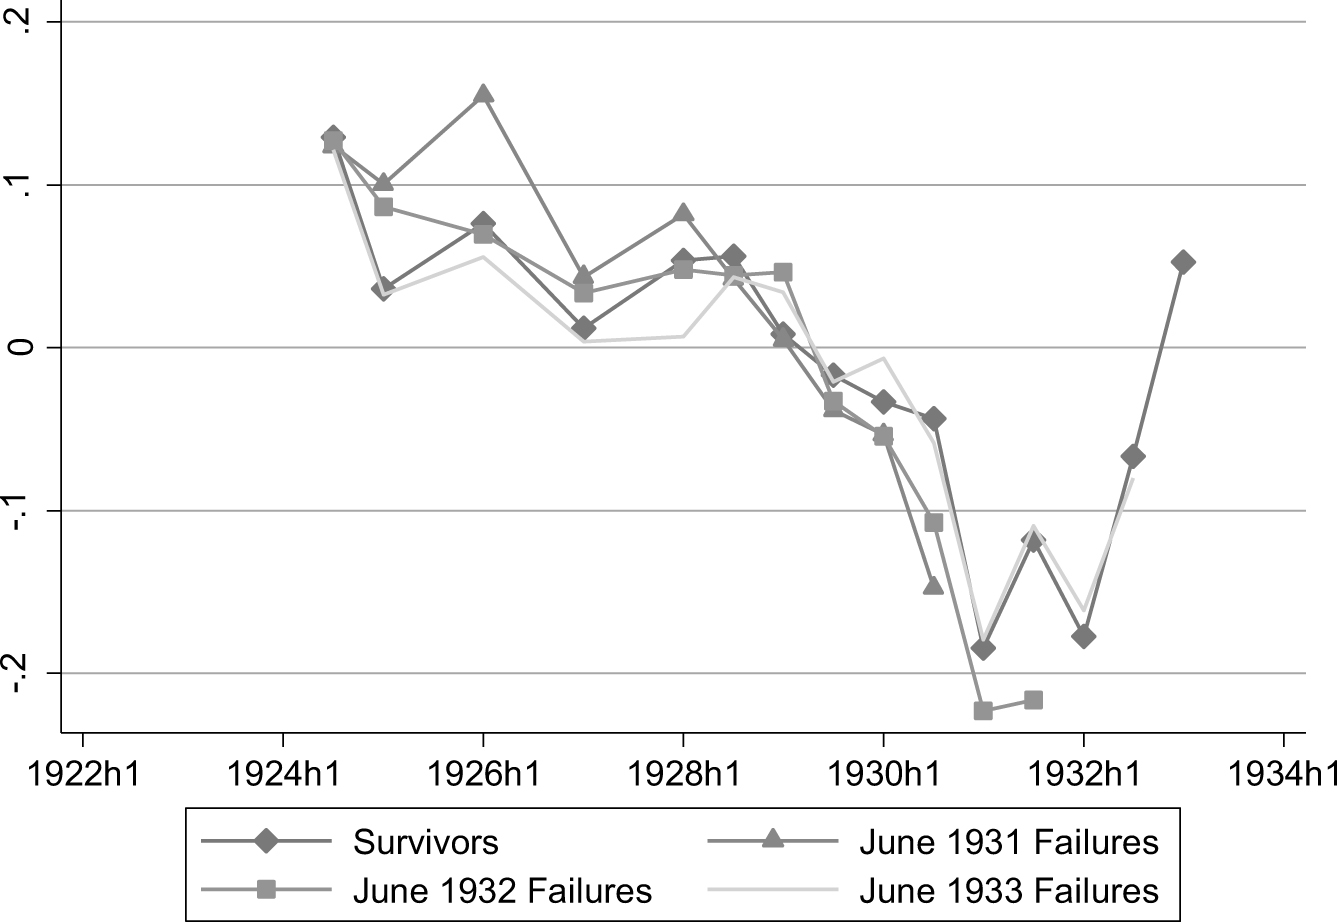
One may wonder how a non-increasing share of real estate to total assets may have substantially weakened banks. First note that the data only start in 1923, which was already some way into the boom. The real estate boom may also be hidden by the fact that banks grew significantly throughout the 1920s. This is shown in Appendix Figures 9 and 10. Appendix Figure 9 represents the median growth rate of mortgages as an absolute value, a useful (albeit highly approximate) measure in the absence of data on new mortgages made by year. It shows substantial growth rates between 1923 and 1927 for all cohorts, as well as the fact that June 1931 failures always had a higher growth rate than June 1932 failures, which had a higher growth rate than survivors (the June 1933 failures cohort, in light grey for better visibility, behaves much more erratically, as is often the case).
MEDIAN GROWTH RATE OF MORTGAGES (SIX MONTHS TO SIX MONTHS)
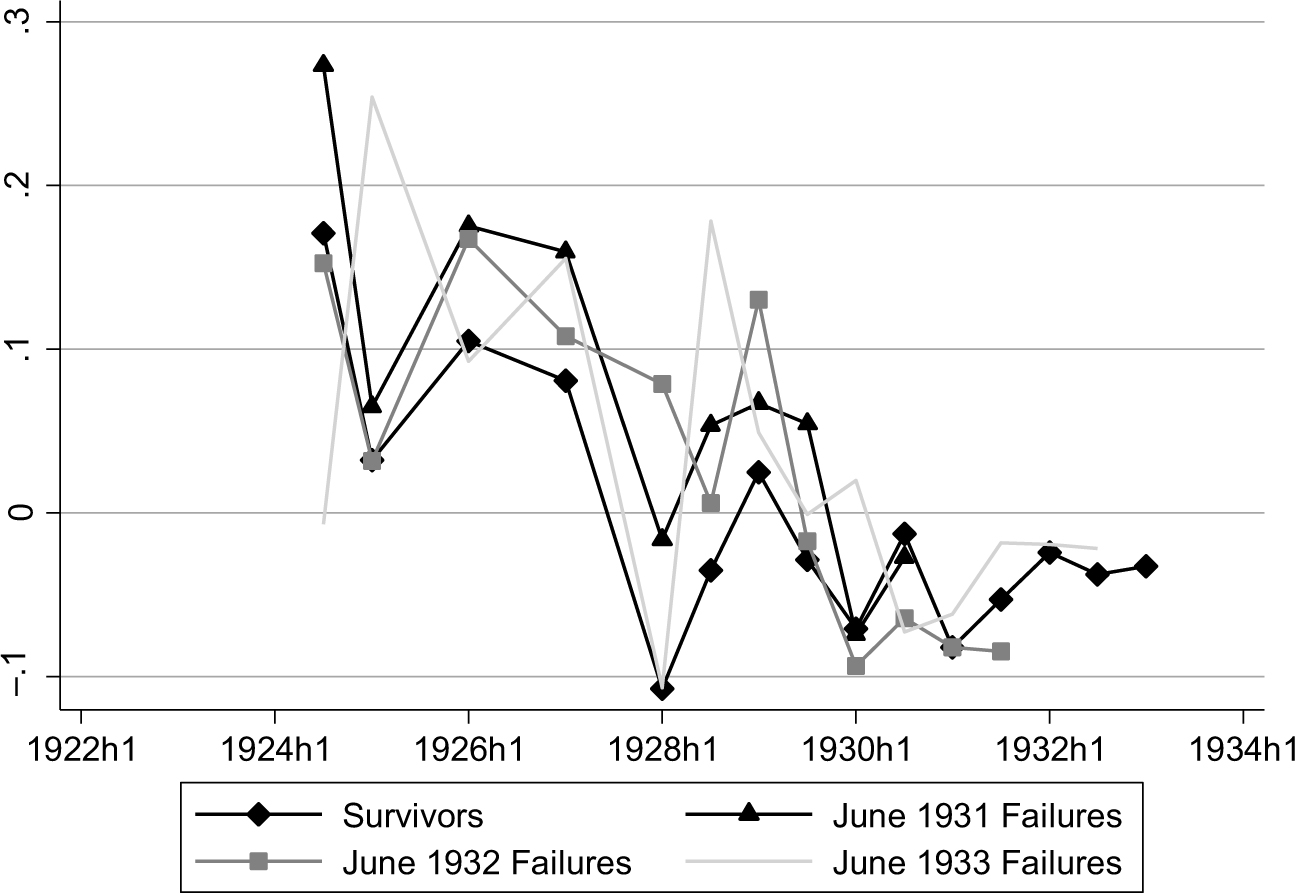
The graph of the median growth rate of total assets looks similar (see Appendix Figure 10), although most cohorts had a slightly higher mortgage than asset growth rate. It is interesting to see that the June 1931 failure cohort grew particularly fast in the mid-1920s.
MEDIAN GROWTH RATE OF TOTAL ASSETS (SIX MONTHS TO SIX MONTHS)
Survival Model for the Liability Side
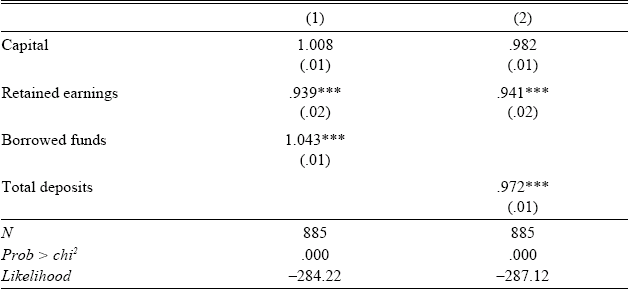
Appendix Table 5 provides a discrete-time proportional odds model for the liability side of bank balance sheets. The focus is on the years 1929–1933. As borrowed funds and deposit losses are highly correlated, they were entered separately in the regression. All items are ratios to total liabilities and equity except for retained earnings to net worth.
DISCRETE-TIME PROPORTIONAL ODDS ESTIMATION, 1929–1933 (BINARY DEPENDENT VARIABLE EQUALS ONE AT THE TIME OF FAILURE), ODDS RATIOS