



INTRODUCTION
Muscular control of feeding and movement is fundamental to the survival of helminth parasites and is the principle target for a majority of anthelmintic drugs. The nematode nervous system transmits electrical signals, for the most part, as diffusion of charged ions along the neuronal axon (Davis and Stretton, Reference Davis and Stretton1989; Goodman et al. Reference Goodman, Hall, Avery and Lockery1998) since only a few neurones show evidence for vertebrate-like action potentials, where voltage-gated Na+ and K+ channels generate a binary signal that does not degrade over long distances (Mellem et al. Reference Mellem, Brockie, Madsen and Maricq2008). An electrical signal is converted to a chemical one at the synaptic junction by release of a variety of neurotransmitter molecules into the synaptic space, including acetylcholine, GABA, dopamine, serotonin and glutamate among others. Various ion-channel receptors in post-synaptic cells convert the chemical signal back into an electrical one. The pentameric ligand-gated ion-channels (pLGICs) are of particular importance in this process since they respond rapidly to neurotransmitter binding, opening a selective filter regulating the flow of ions across the cell surface membrane. Drugs such as the familiar ethanol, highly addictive nicotine, a range of anaesthetics, including propofol, the serotonin re-uptake inhibitors, as well as a majority of anthelmintic drugs, all mediate their effects by modulating pLGIC mediated signalling. The search for new compounds that act on pLGICs is the focus of multimillion dollar research efforts globally and will benefit from a more complete understanding of the structure, function and diversity of these receptors.
The pLGICs represent an ancient signalling system that predates the appearance of multicellular organisms (Tasneem et al. Reference Tasneem, Iyer, Jakobsson and Aravind2005). A unifying principle among all living organisms is that their energy derives from proton and other ion gradients across cellular membranes (Lane, Reference Lane2010). The manipulation of, and response to, ion gradients is therefore fundamental and so pLGICs may have been present in the very earliest forms of life. All modern-day pLGICs have evolved from these primordial channels and this review will focus on the evolutionary mechanisms that characterize this process. In doing so we hope to show that understanding pLGIC evolution can provide a framework for understanding their function, the differences that occur between species and guide future ion-channel research in the parasitic nematodes.
STRUCTURE AND FUNCTION
The structure of pLGICs from different species including the torpedo fish, mouse, human, Caenorhabditis elegans, bacteria and the acetylcholine binding protein of molluscs have been solved (Unwin, Reference Unwin1993, Reference Unwin1995; Brejc et al. Reference Brejc, van Dijk, Klaassen, Schuurmans, van Der Oost, Smit and Sixma2001; Unwin et al. Reference Unwin, Miyazawa, Li and Fujiyoshi2002; Dellisanti et al. Reference Dellisanti, Yao, Stroud, Wang and Chen2007; Hilf and Dutzler, Reference Hilf and Dutzler2008; Bocquet et al. Reference Bocquet, Nury, Baaden, Le Poupon, Changeux, Delarue and Corringer2009; Hibbs and Gouaux, Reference Hibbs and Gouaux2011; Unwin and Fujiyoshi, Reference Unwin and Fujiyoshi2012; Miller and Aricescu, Reference Miller and Aricescu2014). In all these organisms, the pLGIC is composed of either five identical, or else closely related, subunits that form a pentamer around a central ion-channel (Fig. 1) (Unwin, Reference Unwin1993, Reference Unwin2005; Hibbs and Gouaux, Reference Hibbs and Gouaux2011; Miller and Aricescu, Reference Miller and Aricescu2014). The large extracellular domain of each subunit consists of a pair of beta-sheets linked by a 15 amino acid cys-loop with a disulphide bond linking the cysteine residues at each end of the loop. Four transmembrane (TM) alpha helices anchor each subunit in the cell membrane, with the second TM domain of each coming together to line the channel pore. The electrochemical profile of the pore determines the ion-flow through the selective filter, with amino acids at the inner membrane face critical for selectivity (Corringer et al. Reference Corringer, Baaden, Bocquet, Delarue, Dufresne, Nury, Prevost and Van Renterghem2010; Hibbs and Gouaux, Reference Hibbs and Gouaux2011). Immediately within the cytoplasm, an alpha helix from each subunit may form a cage through which ions must flow and this contributes to the ion-selectivity filter (Unwin, Reference Unwin2005). A cytoplasmic loop between TM3 and TM4, not shown in Fig. 1, is the most variable section of the pLGIC sequence and contains motifs for interaction with cytoskeletal proteins that determine membrane distribution (Gally et al. Reference Gally, Eimer, Richmond and Bessereau2004) and regulate channel activity (Lee et al. Reference Lee, Song, Jee, Vanoaica and Ahnn2005) and phosphorylation sites that regulate receptor trafficking and availability (Smart and Paoletti, Reference Smart and Paoletti2012).
Space filling structures of the pentameric ligand-gated ion-channel (PDB 2BG9). (a) Side view showing the pentameric receptor spanning the membrane with the interior of the cell towards the bottom. The large extracellular domain of the channel is responsible for ligand binding; (b) two opposing subunits of the receptor revealing the open channel through the selectivity filter created by each TM2 from the subunits. The arrows indicate the flow of sodium ions through the open channel into the cell; (c) exploded top view of the channel showing the five subunits that form a pentamer around a central ion channel; (d) cartoon structure of the ligand binding pocket formed between a principal face subunit that contributes the C-loop and a complementary face subunit drawn from the mollusc acetylcholine binding protein crystal structure bound with carbamylcholine. Residues that form the hydrophobic box and interact with the ligand are shown in stick form, the ligand as space filled with hydrophobic and cation–pi interactions between the ligand and receptor indicated by lines.

An activating neurotransmitter, such as acetylcholine, GABA, glutamate, dopamine, serotonin and many others, typically binds at the interface between two subunits within a hydrophobic box created by tyrosine and tryptophan residues on the principal subunit and residues of the facing beta-strands on the complementary subunit (Fig. 1d) (Sine, Reference Sine2002). Ligand binding induces the C-loop to move inwards, towards the bound ligand (Hibbs and Gouaux, Reference Hibbs and Gouaux2011; Unwin and Fujiyoshi, Reference Unwin and Fujiyoshi2012; Mowrey et al. Reference Mowrey, Chen, Liang, Liang, Xu and Tang2013a ). The physical processes that lead from this to opening of the gate have been investigated extensively (Grosman et al. Reference Grosman, Zhou and Auerbach2000; Bouzat et al. Reference Bouzat, Gumilar, Spitzmaul, Wang, Rayes, Hansen, Taylor and Sine2004; Lee and Sine, Reference Lee and Sine2005; Auerbach, Reference Auerbach2010; Bouzat, Reference Bouzat2012; Althoff et al. Reference Althoff, Hibbs, Banerjee and Gouaux2014). A wave of structural change propagates through the extracellular domain, the cys-loop and the loop between beta-strands 1 and 2 that lie at the boundary between the extracellular and TM regions and into the TM domain. Computer simulation suggests that changes occur within individual subunits but are also communicated to adjacent subunits in the channel. The TM2 helices that line the ion-pore curve inward in the closed configuration, confining the channel. On channel opening, these become significantly more straight, opening a path for the flow of ions across the membrane (Hilf and Dutzler, Reference Hilf and Dutzler2008, Reference Hilf and Dutzler2009; Unwin and Fujiyoshi, Reference Unwin and Fujiyoshi2012; Althoff et al. Reference Althoff, Hibbs, Banerjee and Gouaux2014).
The structure of the pLGICs is highly conserved, more than the primary amino acid sequence might suggest. Superposition of the bacterial proton-gated channel ELIC (PDB 3EHZ) and mouse alpha-7 acetylcholine-gated channel (PDB 2QC1) reveals that a majority of the backbone alpha carbon atoms of the core structure have changed position less that 1·5 A in the more than 2 billion years since these subunits last had an ancestor in common. This has proved crucial for modelling the pLGIC structure using these experimentally determined structures as a template.
PHYLOGENETICS
Sequence alignment aims to determine those amino acids that are descended from amino acids in ancestral sequences, trying to infer how DNA polymerase has copied sequences from generation to generation. Errors in the alignment obscure the real relationship between sequences and can bias the subsequent analysis. Many different forms of alignment method are available and the more popular include Clustal (Sievers and Higgins, Reference Sievers and Higgins2014), T-Coffee (Magis et al. Reference Magis, Taly, Bussotti, Chang, Di Tommaso, Erb, Espinosa-Carrasco and Notredame2014) and MAFFT (Katoh et al. Reference Katoh, Misawa, Kuma and Miyata2002). Their relative merits in terms of speed, ability to handle large datasets and the use of structural information to inform the alignment can play a role in which method is most appropriate in different circumstances (Daugelaite et al. Reference Daugelaite, O' Driscoll and Sleator2013). The phylogenetic relationship between a set of aligned sequences can also be inferred in a variety of ways including maximum parsimony, as developed in Phylip (Felsenstein, Reference Felsenstein1989), sequence similarity through neighbour joining (Gascuel, Reference Gascuel1997) and more recently maximum likelihood (Guindon and Gascuel, Reference Guindon and Gascuel2003) and Baysian (Huelsenbeck and Ronquist, Reference Huelsenbeck and Ronquist2001) methods. The move towards the more complete statistical frameworks of maximum likelihood and Baysian analysis that model the evolutionary process leading to a specific phylogeny has been assisted by increasing computational power.
The advent of genome sequencing technology has led to the popular pastime of cataloguing the pLGIC subunit complement of a wide variety of organisms (Jones et al. Reference Jones, Elgar and Sattelle2003, Reference Jones, Raymond-Delpech, Thany, Gauthier and Sattelle2006, Reference Jones, Davis, Hodgkin and Sattelle2007, Reference Jones, Bera, Lees and Sattelle2010; Jones and Sattelle, Reference Jones and Sattelle2006, Reference Jones and Sattelle2007, Reference Jones and Sattelle2008, Reference Jones and Sattelle2010; Shao et al. Reference Shao, Dong and Zhang2007; Williamson et al. Reference Williamson, Walsh and Wolstenholme2007; Rendon et al. Reference Rendon, Kantorovitz, Tilson and Jakobsson2011; Dermauw et al. Reference Dermauw, Ilias, Riga, Tsagkarakou, Grbic, Tirry, Van Leeuwen and Vontas2012; Knipple and Soderlund, Reference Knipple and Soderlund2012; Laing et al. Reference Laing, Kikuchi, Martinelli, Tsai, Beech, Redman, Holroyd, Bartley, Beasley, Britton, Curran, Devaney, Gilabert, Hunt, Jackson, Johnston, Kryukov, Li, Morrison, Reid, Sargison, Saunders, Wasmuth, Wolstenholme, Berriman, Gilleard and Cotton2013). Alignment of these sequences and phylogenetic reconstruction allows us to infer the set of genes that must have been present in ancestral organisms that led to the present day. We can also determine to some degree when and in which lineages the appearance and disappearance of certain clades of subunits occur.
To illustrate this, Figs 2 and 3 show example phylogenies of the unc-38 alpha-type subunits and the unc-29 non-alpha type subunits of the levamisole receptor from species representative for clades I, III and V (Meldal et al. Reference Meldal, Debenham, De Ley, De Ley, Vanfleteren, Vierstraete, Bert, Borgonie, Moens, Tyler, Austen, Blaxter, Rogers and Lambshead2007). Nucleotide sequences were aligned as codons using the MAFFT plug-in of Geneious 7.12 (Katoh et al. Reference Katoh, Misawa, Kuma and Miyata2002). Given the highly conserved structure of the pLGICs, manual adjustment was used to improve the sequence alignment. Regions with high sequence divergence, the signal peptide, the region between TM3 and TM4 and the sequence beyond TM4, where insertions and deletions cause a lack of confidence that the alignment reflects the true homology, were removed. The phylogeny was reconstructed using the PhyML plug-in of Geneious (Guindon and Gascuel, Reference Guindon and Gascuel2003) and statistical support for the internal branches of the tree were evaluated using the SH-like statistics produced by PhyML.
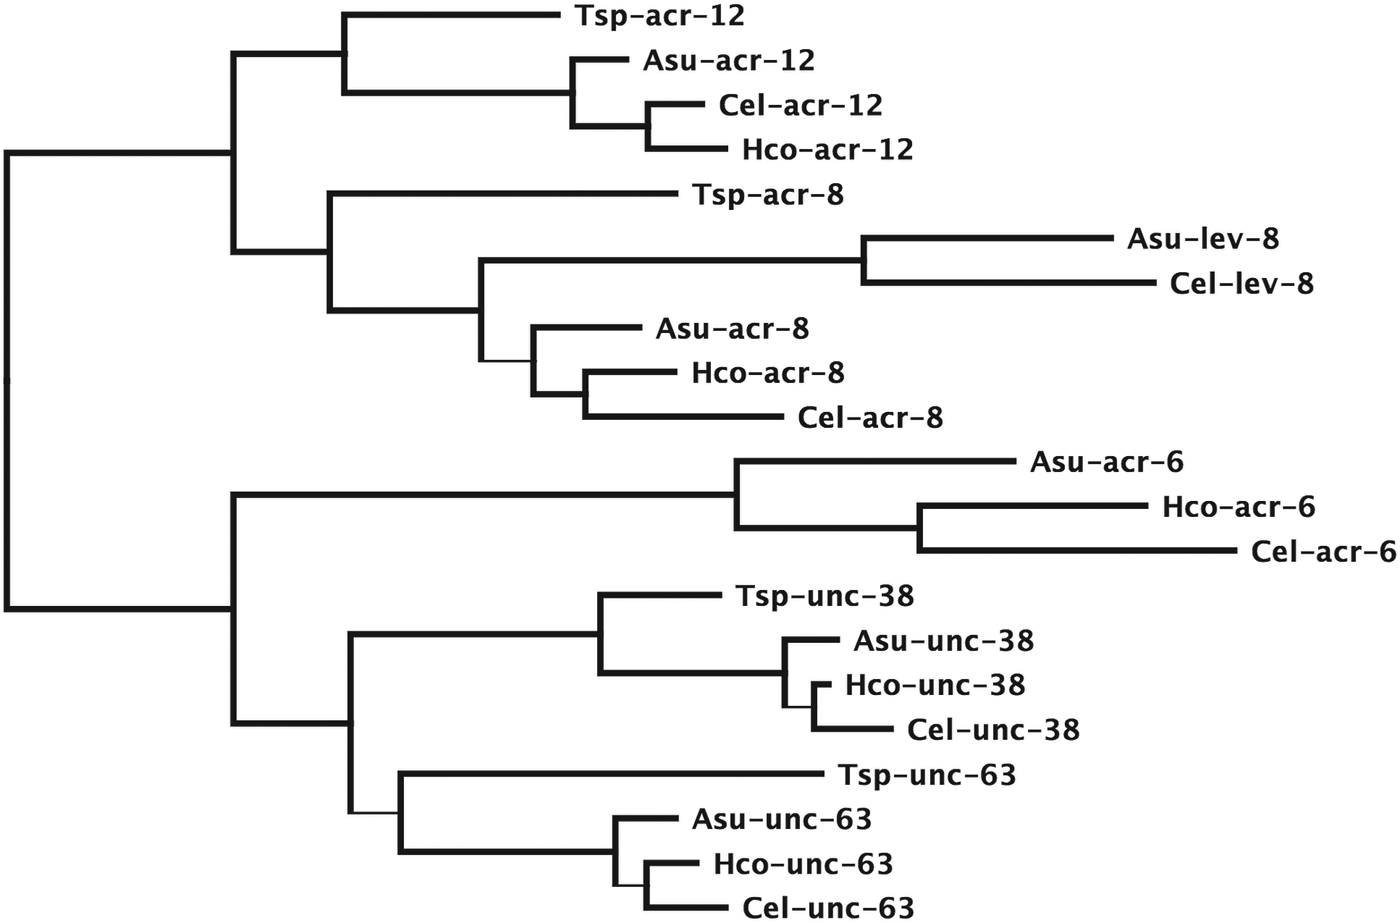
Maximum likelihood phylogeny of subunits in the unc-38 clade from T. spiralis (Tsp), A. suum (Asu), H. contortus (Hco) and C. elegans (Cel) based on protein sequences aligned using MAFFT (Katoh et al. Reference Katoh, Misawa, Kuma and Miyata2002) as implemented in Geneious v7.1.2 created by Biomatters. Regions corresponding to the signal peptide, intracellular loop between TM3 and TM4 and trailing sequence beyond TM4 and all positions where at least one sequence had a gap removed. Phylogeny determined by PhyML as implemented in Geneious (Guindon and Gascuel, Reference Guindon and Gascuel2003). Branches that do not significantly increase the tree likelihood based on SH-like branch support values are shown as thin lines. The tree is rooted using the C. elegans acr-16 sequence as an outgroup.
Maximum likelihood phylogeny of subunits in the unc-29 clade from T. spiralis (Tsp), A. suum (Asu), H. contortus (Hco), T. colubriformis (Tco), T. circumcincta (Tci) and C. elegans (Cel) based on protein sequences aligned using MAFFT (Katoh et al. Reference Katoh, Misawa, Kuma and Miyata2002) as implemented in Geneious v7.1.2 created by Biomatters. Regions corresponding to the signal peptide, intracellular loop between TM3 and TM4 and trailing sequence beyond TM4 and all positions where at least one sequence has a gap removed. Phylogeny determined by PhyML as implemented in Geneious (Guindon and Gascuel, Reference Guindon and Gascuel2003). Branches that do not significantly increase the tree likelihood based on SH-like branch support values are shown as thin lines. The tree is rooted using the C. elegans acr-16 sequence as an outgroup.

A specific node, or branch point, on the tree represents an ancestral sequence giving rise to two descendant sequences. This can occur when a single gene present in an ancestor is passed on through a speciation event, a process that gives rise to a gene in each species that represent an orthologous pair. In Fig. 2 the branching pattern for acr-6, acr-8, acr-12, unc-38 and unc-63 reflects orthologous genes following the progressive divergence of species from a common ancestor. Alternatively, gene duplication can generate copies of the original gene within a single species, producing descendent genes that are paralogous. In Fig. 3 the trichostrongylid nematodes carry four paralogous copies of unc-29, a gene found only once in C. elegans (Neveu et al. Reference Neveu, Charvet, Fauvin, Cortet, Beech and Cabaret2010). We see that the paralogous copies are more closely related to each other than they are to the gene in C. elegans so we infer they appeared after speciation from the C. elegans ancestor. The duplications that led to these four genes must have preceded divergence of the trichostrongylid group since each of the four genes can be found as orthologs in both Teladorsagia circumcincta and Trichostrongylus colubriformis. Both Ascaris suum and C. elegans encode orthologs of both the acr-8 and lev-8 genes. The levamisole receptor of C. elegans contains lev-8 while that of Haemonchus contortus and O. dentatum contain the acr-8 subunit as discussed below (Boulin et al. Reference Boulin, Gielen, Richmond, Williams, Paoletti and Bessereau2008, Reference Boulin, Fauvin, Charvet, Cortet, Cabaret, Bessereau and Neveu2011; Buxton et al. Reference Buxton, Charvet, Neveu, Cabaret, Cortet, Peineau, Abongwa, Courtot, Robertson and Martin2014). The phylogeny in Fig. 2 suggests that the there was only a single subunit of this type in the clade I nematode Trichinella spiralis that subsequently diverged to produce the acr-8 and lev-8 paralogous pair prior to divergence of the clades III and V nematodes.
Branches in the Figs 2 and 3 trees drawn as thin lines have statistical support below the significance threshold of an SH-like value of 0·9. This means, for example, that we cannot say the A. suum unc-29 subunit is more closely related to the trichostrongylid unc-29 copies than the C. elegans unc-29 although it appears this way in the tree. We can, however determine that unc-29.4 was the last copy to appear, but not the order in which unc-29.2 and unc-29.3 appeared based on these data.
Subunits present in modern day species are thus used to infer the presence and characteristics of their ancestors. Their topological relationships in the tree can establish the relative order of their appearance. In addition, the relative genetic distance along branches of the tree can also be informative, but without rigorous analysis this last measure can be little more than a guide, since different genes evolve at different rates and we do not have a well-defined fossil record for the nematodes that would allow us to calibrate a molecular clock (Cutter, Reference Cutter2008).
COMMON ANCESTOR OF THE NEMATODES
Various studies have focused on the more ancient parts of the pLGIC phylogeny (Le Novere and Changeux, Reference Le Novere and Changeux1995; Ortells and Lunt, Reference Ortells and Lunt1995; Xue, Reference Xue1998; Tasneem et al. Reference Tasneem, Iyer, Jakobsson and Aravind2005; Dent, Reference Dent2006). In this review we focus on the nematodes specifically and evolutionary changes of the pLGIC family since divergence of the nematodes from insects and the common ancestor of moulting animals, the Ecdysozoa, more than 400 Myr ago (Aguinaldo et al. Reference Aguinaldo, Turbeville, Linford, Rivera, Garey, Raff and Lake1997; Engel and Grimaldi, Reference Engel and Grimaldi2004; Dunn et al. Reference Dunn, Hejnol, Matus, Pang, Browne, Smith, Seaver, Rouse, Obst, Edgecombe, Sorensen, Haddock, Schmidt-Rhaesa, Okusu, Kristensen, Wheeler, Martindale and Giribet2008). Figure 4 shows a schematic adaptation of Figs 2 and 4 from Dent (Reference Dent2006) and we refer the reader to the original for methodological details.
Phylogeny of (a) cationic ligand-gated ion-channel subunits clades and (b) anionic ligand-gated ion-channel subunit clades adapted from Dent (Dent, Reference Dent2006). Nematode subunit clades have been collapsed and shown by triangles. Representative subunits from Drosophila melanogaster are included to show positions of divergence between nematodes and insects. These are the acetylcholine receptor subunits Dmel AChR64B: NP_523927, Dmel AChR96A: NP_524481 and Dmel AChR-Dalpha7: NP_996514, the GABA receptor subunits Dmel LCCH3: NP_996469, Dmel RDL: NP_001261617 and Dmel GRD: NP_524131, the glutamate receptor Dmel GluCl: NM_001170185 and histamine receptor Dmel ORT: NM_079682.
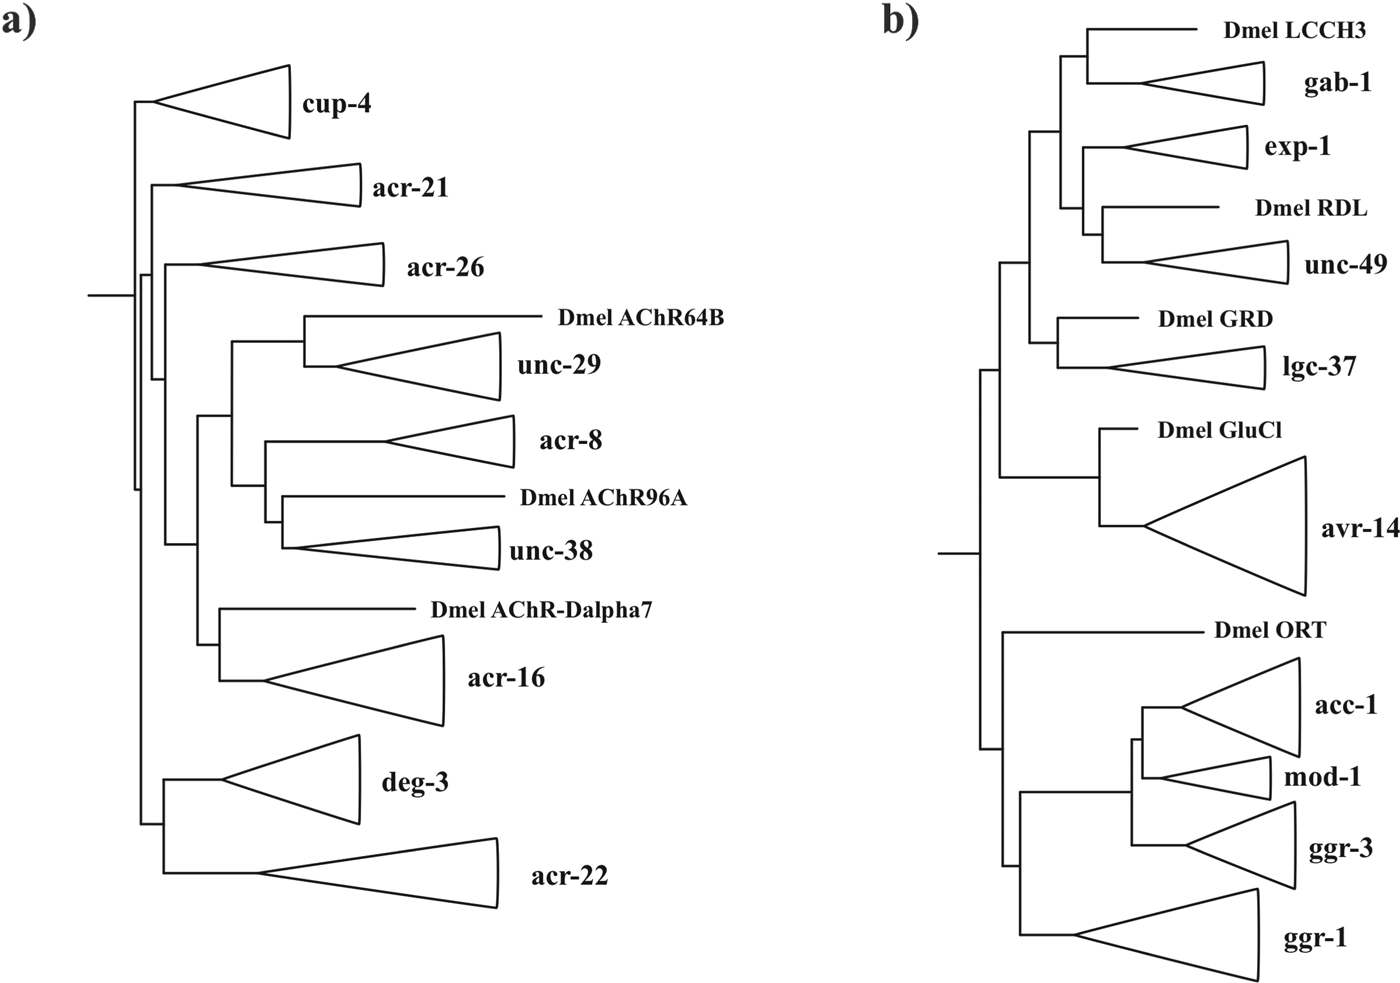
Three acetylcholine receptor clades: unc-38, unc-29 and acr-16 (Fig. 2a), three GABA receptor clades: unc-49, gab-1 and lgc-37 and one glutamate receptor clade: avr-14 (Fig. 4b) (Dent, Reference Dent2006) have a Drosophila melanogaster sequence as a closer relative compared to other subunit clades. This means that representatives of each of these genes must have been present in the Ecdysozoan common ancestor in order to leave orthologous descendants in the insects and nematodes. Several clades that have only been found in the nematodes must have been present in the Ecdysozoan common ancestor due to their topological position in the phylogeny including representatives of the acr-21 and acr-26 (Bennett et al. Reference Bennett, Williamson, Walsh, Woods and Wolstenholme2012) acetylcholine receptor subunits, the deg-3 cholinergic receptor clade (Yassin et al. Reference Yassin, Gillo, Kahan, Halevi, Eshel and Treinin2001; Rufener et al. Reference Rufener, Maser, Roditi and Kaminsky2009, Reference Rufener, Keiser, Kaminsky, Maser and Nilsson2010b , Reference Rufener, Bedoni, Baur, Rey, Glauser, Bouvier, Beech, Sigel and Puoti2013), the cationic GABA receptor exp-1 (Beg and Jorgensen, Reference Beg and Jorgensen2003) and the two orphan clades, cup-4 that may function within the cell to regulate endocytosis and the as yet uncharacterized acr-22 clade (Jones et al. Reference Jones, Davis, Hodgkin and Sattelle2007). These clades diverge at a point prior to branches where insects diverge and so must predate the Ecdysozoa and have subsequently been lost from the insects. By similar logic the histamine receptor is thought to have been lost from the nematodes (Zheng et al. Reference Zheng, Hirschberg, Yuan, Wang, Hunt, Ludmerer, Schmatz and Cully2002; Dent, Reference Dent2006). In total, this represents a minimum of nine stimulatory and five inhibitory subunit classes present in the nematode common ancestor. We can also infer from these subunits that this ancestral organism possessed receptors for the anthelmintic drugs ivermectin, levamisole, nicotine and monepantel (Dent et al. Reference Dent, Smith, Vassilatis and Avery2000; Touroutine et al. Reference Touroutine, Fox, Von Stetina, Burdina, Miller and Richmond2005; Boulin et al. Reference Boulin, Gielen, Richmond, Williams, Paoletti and Bessereau2008; Rufener et al. Reference Rufener, Bedoni, Baur, Rey, Glauser, Bouvier, Beech, Sigel and Puoti2013).
GENE LOSS
The loss of genes from an organism, and therefore from all its descendants, has had a major impact on the biology of nematodes and their relatives. We must keep in mind that absence of homology in a potentially incomplete genome sequence dataset is not proof that a gene does not exist. However, increasing depth of sequence coverage and accumulation of data using different experimental techniques and from different organisms can lend weight to the conclusion. Examination of the pLGIC subunit phylogeny allows us to draw several conclusions about the process of gene loss. Firstly, this process is ongoing and not limited to some ancient ancestral state. The free living C. elegans and parasitic H. contortus are closely related clade V nematodes that share a majority of orthologous pLGIC subunit genes. However, the glc-5 and glc-6 genes involved in glutamate signalling and sensitivity to ivermectin in H. contortus appear ancestral to the divergence between C. elegans and H. contortus in Fig. 4 of Laing et al., but have been lost in the C. elegans lineage (Forrester et al. Reference Forrester, Prichard, Dent and Beech2003; Glendinning et al. Reference Glendinning, Buckingham, Sattelle, Wonnacott and Wolstenholme2011; Laing et al. Reference Laing, Kikuchi, Martinelli, Tsai, Beech, Redman, Holroyd, Bartley, Beasley, Britton, Curran, Devaney, Gilabert, Hunt, Jackson, Johnston, Kryukov, Li, Morrison, Reid, Sargison, Saunders, Wasmuth, Wolstenholme, Berriman, Gilleard and Cotton2013). With similar reasoning, the lgc-48 and lgc-54 anion channel subunits involved in biogenic amine/cholinergic inhibitory signalling, the lev-8 cation channel subunit expressed as part of the LEV target in C. elegans and the acr-18 cation channel subunit from the deg-3 gene clade are missing from the available H. contortus genome sequence data (Laing et al. Reference Laing, Kikuchi, Martinelli, Tsai, Beech, Redman, Holroyd, Bartley, Beasley, Britton, Curran, Devaney, Gilabert, Hunt, Jackson, Johnston, Kryukov, Li, Morrison, Reid, Sargison, Saunders, Wasmuth, Wolstenholme, Berriman, Gilleard and Cotton2013; Schwarz et al. Reference Schwarz, Korhonen, Campbell, Young, Jex, Jabbar, Hall, Mondal, Howe, Pell, Hofmann, Boag, Zhu, Gregory, Loukas, Williams, Antoshechkin, Brown, Sternberg and Gasser2013).
The clade III nematodes, including Loa loa, Brugia malayi and A. suum have many fewer pLGIC subunit genes than clade V nematodes (Ghedin et al. Reference Ghedin, Wang, Spiro, Caler, Zhao, Crabtree, Allen, Delcher, Guiliano, Miranda-Saavedra, Angiuoli, Creasy, Amedeo, Haas, El-Sayed, Wortman, Feldblyum, Tallon, Schatz, Shumway, Koo, Salzberg, Schobel, Pertea, Pop, White, Barton, Carlow, Crawford and Daub2007; Williamson et al. Reference Williamson, Walsh and Wolstenholme2007; Rufener et al. Reference Rufener, Keiser, Kaminsky, Maser and Nilsson2010b ; Desjardins et al. Reference Desjardins, Cerqueira, Goldberg, Dunning Hotopp, Haas, Zucker, Ribeiro, Saif, Levin, Fan, Zeng, Russ, Wortman, Fink, Birren and Nutman2013). Apparent losses from B. malayi identified by Williamson et al. include lgc-36 of the lgc-37 GABA receptor clade, the glc-5 and glc-6 glutamate-receptor subunits, the pbo-5 and pbo-6 proton-gated channel subunits, the acr-6, acr-7, lev-8, acr-19, acr-21 and acr-25 alpha-type and acr-2, acr-3 and eat-2 non-alpha type acetylcholine channel subunits and all subunits of the deg-3 clade (Williamson et al. Reference Williamson, Walsh and Wolstenholme2007). The pLGIC subunit complement of the clade I T. spiralis is even more restricted (Williamson et al. Reference Williamson, Walsh and Wolstenholme2007), losing all but two subunits from the avr-14 clade, all but unc-49 from the five GABA receptor subunit clades, all but one member of the deg-3 clade, acr-21, acr-26, acr-27, pbo-5, pbo-6 and all but two subunits of the acr-16 clade.
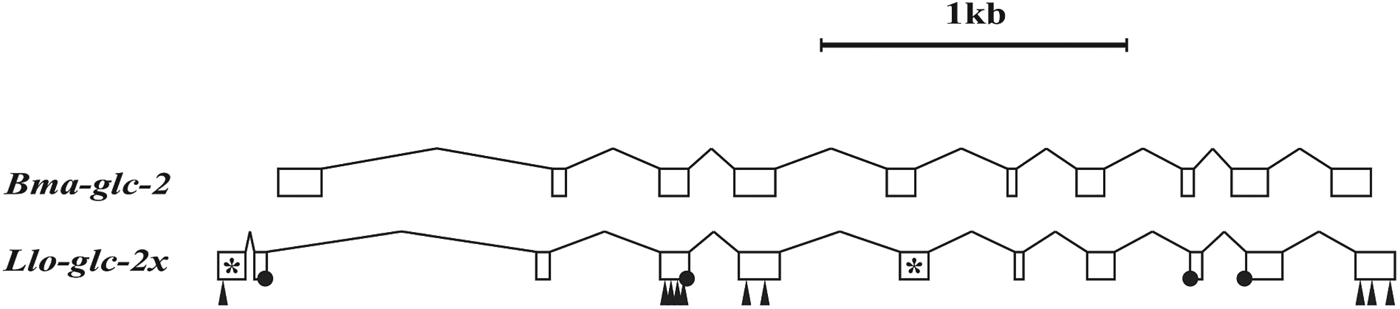
The mechanisms by which genes are lost are many but most likely begin with the acquisition of a null mutation that prevents protein expression. If the gene is important for the ability to survive to reproduce then purifying selection is expected to remove such null mutations. Alternatively, if the specific environment allows this first null mutation to persist and even become fixed, then the gene sequence will erode away through subsequent unchecked substitution until it becomes unrecognizable. The timespan between acquisition of a first disabling mutation and the disappearance of recognizable sequence similarity will depend on many different factors. It would appear though that the genome of L. loa may provide a snapshot of ongoing gene loss. In one example, scaffold JH712083 contains a sequence orthologous to glc-2 present in the closely related B. malayi (Fig. 5). Much of the coding sequence can be identified but the presence of frameshifts, intron splice junction errors and stop codons within the conserved protein sequence confirms that this transcript could not encode a functional protein. The fact that many other pLGIC orthologs can be identified in the L. loa genome that have intact coding sequence suggests that this does not represent a sequencing artefact.
Gene organization of the glc-2 genomic sequences from B. malayi and L. loa. Exons and introns are indicated as boxes and lines, respectively, drawn to scale. The Llo-glc-2 annotation is based on maximum similarity with the other filarial nematode sequences, including B. malayi. This requires an additional intron after the first exon of the L. loa sequence, two in frame stop codons, indicated by *, ten frame shifts, indicated by black triangles and four incorrect intron splice junctions, indicated by black circles.
Two conditions under which gene loss may occur include either a lifestyle or physiological change for an organism that creates a situation in which particular receptors or subunits are no longer advantageous or the loss of a receptor or subunit that is advantageous that could be compensated for by a subsequent adaptive change in other genes. The first of these has been argued for the recently sequenced trematode genomes that have significantly lower total gene counts than nematodes and agrees with the loss of many genes encoding metabolizing enzymes (Berriman et al. Reference Berriman, Haas, LoVerde, Wilson, Dillon, Cerqueira, Mashiyama, Al-Lazikani, Andrade, Ashton, Aslett, Bartholomeu, Blandin, Caffrey, Coghlan, Coulson, Day, Delcher, DeMarco, Djikeng, Eyre, Gamble, Ghedin, Gu, Hertz-Fowler, Hirai, Hirai, Houston, Ivens and Johnston2009; Tsai et al. Reference Tsai, Zarowiecki, Holroyd, Garciarrubio, Sanchez-Flores, Brooks, Tracey, Bobes, Fragoso, Sciutto, Aslett, Beasley, Bennett, Cai, Camicia, Clark, Cucher, De Silva, Day, Deplazes, Estrada, Fernandez, Holland, Hou, Hu, Huckvale, Hung, Kamenetzky, Keane and Kiss2013). The second may explain changes in heteropentameric receptor composition that have been observed between different nematode species (Boulin et al. Reference Boulin, Gielen, Richmond, Williams, Paoletti and Bessereau2008, Reference Boulin, Fauvin, Charvet, Cortet, Cabaret, Bessereau and Neveu2011; Buxton et al. Reference Buxton, Charvet, Neveu, Cabaret, Cortet, Peineau, Abongwa, Courtot, Robertson and Martin2014).
Synonymous substitutions are nucleotide changes that have no effect on protein sequence. Non-synonymous substitutions are those that affect protein sequence and may be affected by selection acting on the protein function. The low non-synonymous substitution rate evident in the sequence of pLGIC subunits is consistent with very strong purifying selection often associated with essential genes (Beech et al. Reference Beech, Callanan, Rao, Dawe and Forrester2013) and yet null mutations of many pLGIC subunit genes have no observable phenotype in the petri dish (Yook et al. Reference Yook, Harris, Bieri, Cabunoc, Chan, Chen, Davis, de la Cruz, Duong, Fang, Ganesan, Grove, Howe, Kadam, Kishore, Lee, Li, Muller, Nakamura, Nash, Ozersky, Paulini, Raciti, Rangarajan, Schindelman, Shi, Schwarz, Ann Tuli, Van Auken and Wang2012). This may be a consequence of reduced stress on C. elegans in the petri dish or may really reflect a situation in which loss of function can be compensated by some redundancy between different subunits (Hernando et al. Reference Hernando, Berge, Rayes and Bouzat2012). A natural variant of the Cel-glc-1 gene that confers resistance to both ivermectin and the bacteria that produce avermectins in the wild appears to be non-functional (Ghosh et al. Reference Ghosh, Andersen, Shapiro, Gerke and Kruglyak2012). Loss of GLC-1 activity increases motility in the absence of drug as well as the number of progeny in the presence of Streptomyces avermitilis compared to wild type. Fecundity may be reduced in their absence, although not significantly in the laboratory. Natural variants of Hco-glc-5 and Hco-lgc-37 linked with resistance to ivermectin in the sheep parasite H. contortus that can form functional channels (Feng et al. Reference Feng, Hayashi, Beech and Prichard2002; Forrester et al. Reference Forrester, Prichard, Dent and Beech2003) also affect feeding and motility and confer protection from the effects of ivermectin in the laboratory (Beech et al. Reference Beech, Levitt, Cambos, Zhou and Forrester2010a ). It may be that appropriately sensitive techniques are required to observe such effects.
Strong pLGIC sequence conversation could be accounted for if mutations that inappropriately activate receptors carry more severe consequences than inactivity. This may explain why a majority of effective drugs that target pLGICs are agonists (Martin and Robertson, Reference Martin and Robertson2010; Epe and Kaminsky, Reference Epe and Kaminsky2013). In addition, activating mutations are known for pLGIC subunits that have readily observable phenotypes in C. elegans (Jospin et al. Reference Jospin, Qi, Stawicki, Boulin, Schuske, Horvitz, Bessereau, Jorgensen and Jin2009) and many human neurological diseases result from inappropriate ion-channel activation (Cooper and Jan, Reference Cooper and Jan1999). Whatever the underlying cause, it is clear that the loss of receptor subunit classes carries biological consequences that limit the repertoire of neurotransmitter signalling mechanisms available.
DUPLICATION
The extensive family of pLGIC subunit genes in present day nematodes such as C. elegans and H. contortus demonstrates that loss must be balanced by the gain of new genes (Jones et al. Reference Jones, Davis, Hodgkin and Sattelle2007; Jones and Sattelle, Reference Jones and Sattelle2008; Laing et al. Reference Laing, Kikuchi, Martinelli, Tsai, Beech, Redman, Holroyd, Bartley, Beasley, Britton, Curran, Devaney, Gilabert, Hunt, Jackson, Johnston, Kryukov, Li, Morrison, Reid, Sargison, Saunders, Wasmuth, Wolstenholme, Berriman, Gilleard and Cotton2013). Several mechanisms that create such new genes are known and perhaps the most important of these is the duplication of DNA to create paralogous gene copies, a process believed to be a fundamental mechanism for the origin of biochemical diversity (Ohno, Reference Ohno1970). The scale of the duplicating event can range from the whole genome through to fragments of individual genes (Conant and Wolfe, Reference Conant and Wolfe2008) and can occur through non-disjunction, unequal recombination and repair of damaged DNA. An example of a tandem duplication of a non-pLGIC gene in H. contortus has recently been reported with repetitive DNA found at the duplication breakpoint that may have been involved in the gene duplication process (Laing et al. Reference Laing, Hunt, Protasio, Saunders, Mungall, Laing, Jackson, Quail, Beech, Berriman and Gilleard2011).
Duplicated pLGIC paralogs can be found in the genomes of many nematodes. These may be dispersed throughout the genome, found in close proximity, in tandem repeats and even involve only a part of the original gene. For example glc-1 and avr-15 in C. elegans form a paralogous pair that appeared after C. elegans diverged from the closely related Caenorhabditis briggsae. These distinct genes are separated by some 2·7 Mb on chromosome V (Yook et al. Reference Yook, Harris, Bieri, Cabunoc, Chan, Chen, Davis, de la Cruz, Duong, Fang, Ganesan, Grove, Howe, Kadam, Kishore, Lee, Li, Muller, Nakamura, Nash, Ozersky, Paulini, Raciti, Rangarajan, Schindelman, Shi, Schwarz, Ann Tuli, Van Auken and Wang2012). Six different receptor subunit genes that belong to the acr-22 orphan group, lgc-13 to lgc-18, are found as a tandem array within 20 kb of the C. elegans X-chromosome representing localized duplication events (Dent, Reference Dent2006; Yook et al. Reference Yook, Harris, Bieri, Cabunoc, Chan, Chen, Davis, de la Cruz, Duong, Fang, Ganesan, Grove, Howe, Kadam, Kishore, Lee, Li, Muller, Nakamura, Nash, Ozersky, Paulini, Raciti, Rangarajan, Schindelman, Shi, Schwarz, Ann Tuli, Van Auken and Wang2012). The non-alpha type subunit genes, acr-2 and acr-3, are co-expressed in a neuronal acetylcholine receptor of C. elegans (Baylis et al. Reference Baylis, Matsuda, Squire, Fleming, Harvey, Darlison, Barnard and Sattelle1997; Jospin et al. Reference Jospin, Qi, Stawicki, Boulin, Schuske, Horvitz, Bessereau, Jorgensen and Jin2009). These are found in an operon, both genes encoded in a single transcript subsequently processed into separate mRNAs (Fig. 6a) (Treinin et al. Reference Treinin, Gillo, Liebman and Chalfie1998; Yassin et al. Reference Yassin, Gillo, Kahan, Halevi, Eshel and Treinin2001). The same is true for the des-2 and deg-3 subunit genes that encode a choline sensitive channel involved in chemosensation (Treinin et al. Reference Treinin, Gillo, Liebman and Chalfie1998; Yassin et al. Reference Yassin, Gillo, Kahan, Halevi, Eshel and Treinin2001; Rufener et al. Reference Rufener, Baur, Kaminsky, Maser and Sigel2010a ). Where they occur, the genes in both these operons have been found in a similar structural arrangement, suggesting ancestral duplication events prior to divergence of the clade I nematodes that involved only the coding region but not the gene promoter, producing a fused transcript. One suggestion has been that this operon structure may provide an advantageous means of guaranteeing similar expression levels for both subunits within a single channel (Jospin et al. Reference Jospin, Qi, Stawicki, Boulin, Schuske, Horvitz, Bessereau, Jorgensen and Jin2009).
Conserved gene organization of (a) the acr-2 and acr-3 operon and (b) the alternative spliced forms of avr-14 in T. spiralis, A. suum, H. contortus and C. elegans. Exons and introns are indicated as boxes and lines, respectively, drawn to scale.
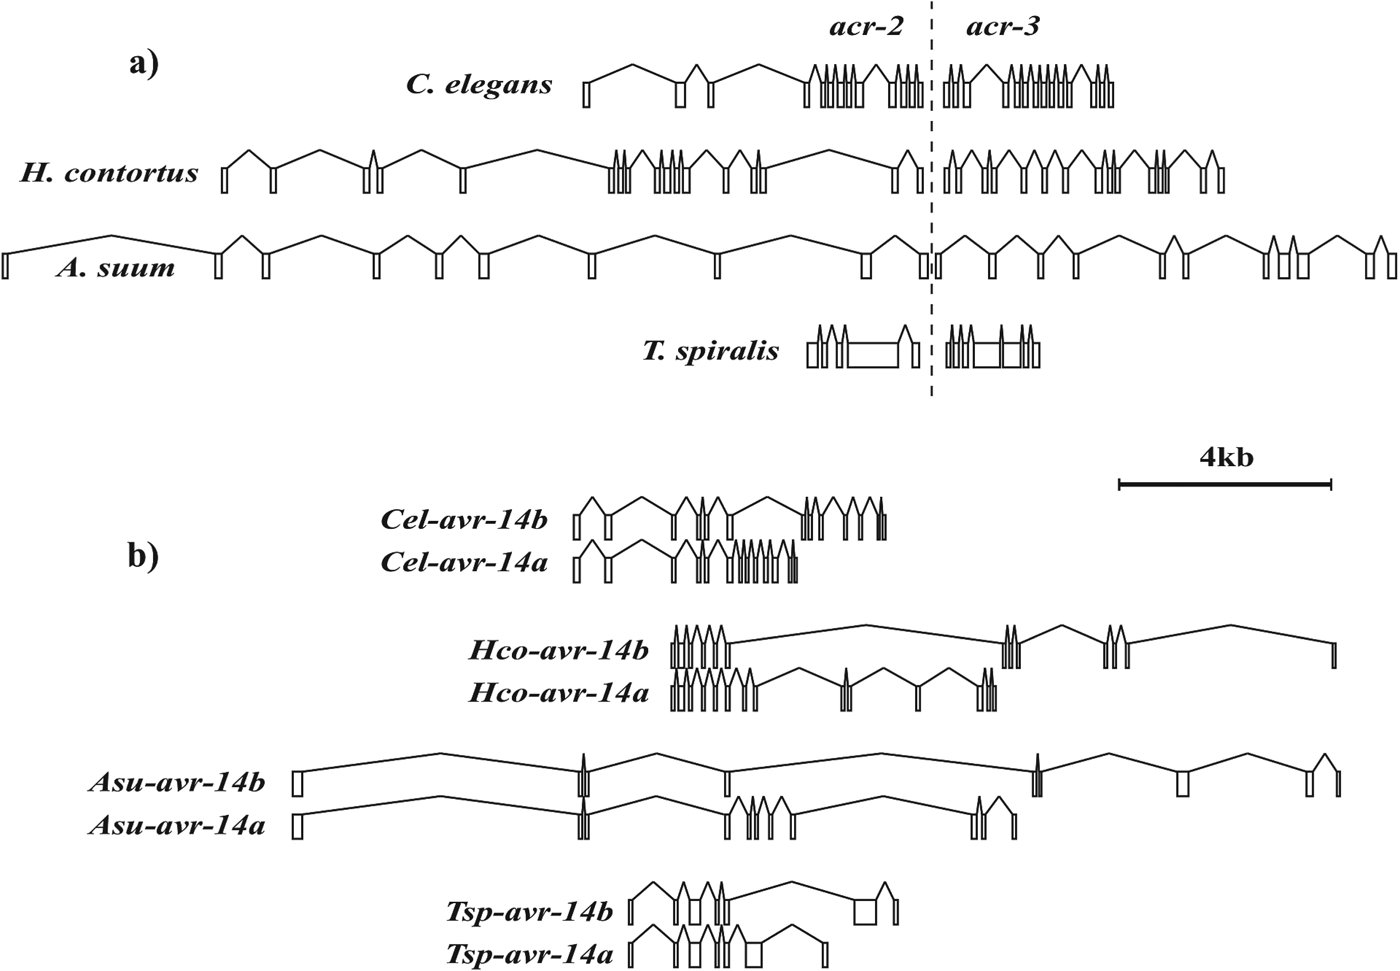
Both the avr-14 glutamate-gated and the unc-49 GABA-gated chloride channel genes produce multiple subunit forms with a common amino terminal region spliced to alternative carboxy termini (Bamber et al. Reference Bamber, Beg, Twyman and Jorgensen1999; Dent et al. Reference Dent, Smith, Vassilatis and Avery2000). The 3′ sequences unique to avr-14b or avr-14c are more closely related to each other than to any other subunit and suggest that one is derived from the other. Duplication of the 3′ part of the original avr-14 would have retained the splice sites for fusing together the exon before and after the duplicated region. If the splicing machinery could correctly identify the appropriate signals after the duplication it is possible to imagine the two alternatively spliced forms leading to subunits that could ultimately diverge in function. This event predates divergence of T. spiralis from the other nematodes but has not been observed in the insects. The structural organization of this gene has also been conserved since its origin in each species where it is found (Fig. 6b).
FUNCTIONAL CHANGE
Once a gene has been duplicated, the presence of at least one active gene copy can relieve the second of selection pressure to preserve its function (Lynch and Conery, Reference Lynch and Conery2003). The most likely outcome of a gene duplication event is, therefore, that the new copy becomes non-functional and is lost, either during the duplication process, if essential elements of the gene or promoter are not duplicated, or subsequently, by an inactivating mutation similar to the Llo-glc-2 gene described above. Such events leave no lasting recognizable footprint and we are more concerned with those events where both gene copies remain functional. There are several possible outcomes for these new genes, including the specialization of a multifunctional protein for one of its several functions or, of particular interest here, the evolution new functionality.
A rather unusual, but particularly interesting example of functional specialization is the acetylcholine binding protein (AChBP) of molluscs. It is included here due to its widespread role in understanding the pLGIC family as a whole. This protein is equivalent to the ligand binding domain of a pLGIC but lacks the TM region that normally anchors subunits in the cell membrane (Smit et al. Reference Smit, Syed, Schaap, van Minnen, Klumperman, Kits, Lodder, van der Schors, van Elk, Sorgedrager, Brejc, Sixma and Geraerts2001). It is secreted from glial cells in response to acetylcholine (ACh) and attenuates signalling by sequestering ACh in the synaptic cleft. The structural similarity between AChBP and the pLGICs, and the solubility of AChBP that allows crystallization, has provided major advances in our understanding of channel function. A second and perhaps more surprising example is the amorphous calcium carbonate binding protein, ACCBP, of the oyster, Crassostrea gigas. This is again homologous to the extracellular ligand binding domain of the pLGICs, but plays a crucial role in shell deposition. It has been shown to regulate the growth of calcium carbonate crystals in a manner dependent on the ACh binding site (Ma et al. Reference Ma, Huang, Sun, Wang, Li, Xie and Zhang2007).
The long term evolution of the pLGIC family as a whole is dominated by changes in receptor subunit composition, the relative affinity for different activating ligands, changes in the gating response to ligand binding and to the ion-permeability filter of the channel. As we have seen, a phylogenetic framework makes it possible to reconstruct a functional history of pLGIC evolution. The inherent simplicity of a homopentameric channel and the requirement for a single ancestral gene in a phylogeny has been used to argue that homopentameric channels are likely the ancestral state (Le Novere and Changeux, Reference Le Novere and Changeux1995). Gene duplication that gives rise to genes with identical sequence that are co-expressed will lead to proteins that could assemble into a single, effectively homopentameric, receptor. Subsequent divergence of these paralogs would ultimately lead to proteins that form a functionally heteromeric channel. This mechanism provides an opportunity for expansion in the range and an increased potential for fine control over channel function.
The unc-49 gene of both C. elegans and H. contortus, discussed above, provides an example of partial gene duplication that can illustrate functional divergence of new subunits. The UNC-49B subunit protein (produced from the unc-49c transcript due to an unfortunate nomenclature (Beech et al. Reference Beech, Wolstenholme, Neveu and Dent2010b )) can form a homomeric channel, in Xenopus oocyte reconstitution, responsive to GABA in both C. elegans and H. contortus (Bamber et al. Reference Bamber, Beg, Twyman and Jorgensen1999; Siddiqui et al. Reference Siddiqui, Brown, Rao and Forrester2010; Accardi and Forrester, Reference Accardi and Forrester2011). The UNC-49C protein (unc-49f transcript) alone cannot form a channel but in the heteropentamer can either decrease, or increase, affinity for GABA in C. elegans and H. contortus, respectively. While evidence suggests that GABA interacts only with residues from the B subunit, the change in binding affinity is conferred by the C subunit (Accardi and Forrester, Reference Accardi and Forrester2011).
The acc-1 clade of subunits encode a family of acetylcholine-gated chloride channels in C. elegans (Putrenko et al. Reference Putrenko, Zakikhani and Dent2005). The subunits, ACC-1 and ACC-2, but not the ACC-3 nor ACC-4 can reconstitute homomeric chloride channels in Xenopus oocytes that respond to acetylcholine. The ACC-1/ACC-3 heteromeric receptor responds less to acetylcholine and shows enhanced desensitization, compared to ACC-1 alone, while addition of ACC-3 or ACC-4 subunits to ACC-2 abolishes expression of a functional channel.
The levamisole receptor (L-AChR) and neuronal ACh receptor (ACR-2R) of C. elegans each represent extreme examples of diversification, where five different genes, one for each subunit, encode the full receptor (Boulin et al. Reference Boulin, Gielen, Richmond, Williams, Paoletti and Bessereau2008; Jospin et al. Reference Jospin, Qi, Stawicki, Boulin, Schuske, Horvitz, Bessereau, Jorgensen and Jin2009). In this case, the reconstitution of receptors in Xenopus oocytes supports the extensive genetic evidence that these receptors are found in vivo (Lewis et al. Reference Lewis, Wu, Berg and Levine1980a , Reference Lewis, Wu, Levine and Berg b ). These genes form three clades, two (unc-38 and acr-8), corresponding to alpha-type subunits that carry two adjacent, or vicinal, cysteines in the C-loop (Fig. 3) and one clade (unc-29) of non-alpha type subunits with a much truncated C-loop, lacking 9–14 amino acids (unc-29 clade, Fig. 4) (Dent, Reference Dent2006; Jones et al. Reference Jones, Davis, Hodgkin and Sattelle2007). The C-loop structure is essential in the principal face subunit for interaction with the ligand so it is likely that unc-29 clade subunits form the complementary face of the ligand binding pocket (Unwin and Fujiyoshi, Reference Unwin and Fujiyoshi2012; Dacosta and Baenziger, Reference Dacosta and Baenziger2013). An unc-38 alpha-like and unc-29 non-alpha like subunit exist in insects (Fig. 2) and, since the acr-8 clade appears before the ecdysozoan common ancestor, this ancestor potentially possessed a receptor containing the two alpha-type subunits and a single non-alpha type subunit. One of the alpha-type subunits duplicated to produce acr-6 and then unc-38 and unc-63. The other gave rise to the acr-8 and acr-12 pair prior to divergence of the nematode clades and acr-8 subsequently gave rise to lev-8 (also known as acr-13 (Jones et al. Reference Jones, Davis, Hodgkin and Sattelle2007)). This last duplication arose after separation of the clade-I nematodes but prior to the appearance of clade III, as shown by its topological position in the phylogeny and the fact that A. suum also carries orthologs of both acr-8 and lev-8 (Fig. 3).
Diversification of the unc-38, acr-8 and unc-29 clade subunits coincided with specific changes in functional characteristics. The L-AChR of C. elegans is composed of UNC-38, UNC-63, LEV-8, UNC-29 and LEV-1 and is expressed in the muscle to regulate contraction (Boulin et al. Reference Boulin, Gielen, Richmond, Williams, Paoletti and Bessereau2008). The ACR-2R is composed of UNC-38, UNC-63, ACR-12, ACR-2 and ACR-3 and is expressed in nerve cells and coordinates the balance of muscle contraction and relaxation required for coordinated movement (Jospin et al. Reference Jospin, Qi, Stawicki, Boulin, Schuske, Horvitz, Bessereau, Jorgensen and Jin2009). The presence of three alpha and two non-alpha subunits in each receptor could produce two alpha/non-alpha subunit interfaces that would be consistent with the structure of the human alpha4-beta2 (Carbone et al. Reference Carbone, Moroni, Groot-Kormelink and Bermudez2009) and the torpedo fish AChR (PDB accession: 2BG9) and the observation that simulation of channel opening for a homopentamer proceeds only with asymmetrical ligand binding sites occupied (Mowrey et al. Reference Mowrey, Cheng, Liu, Willenbring, Lu, Wymore, Xu and Tang2013b ). The presence of UNC-38 and UNC-63 in both receptors suggests their tissue specificity and functional characteristics are determined by the other subunits. H. contortus lacks evidence for an ortholog of lev-8 and the L-AChR-1 contains only UNC-38, UNC-63, ACR-8 and UNC-29. It is easy to imagine replacing one alpha-type subunit for another and in fact evidence suggests that LEV-8 can be replaced by ACR-8 to some extent in C. elegans (Hernando et al. Reference Hernando, Berge, Rayes and Bouzat2012). Loss of the lev-8 subunit may therefore be rescued by, and subsequent adaptation of, the acr-8 subunit. With only four genes contributing five subunits it is easier to imagine a non-alpha subunit replacing a non-alpha subunit loss and that the receptor contains two copies of UNC-29. As yet, there is no experimental evidence for either subunit composition or placement within the pentameric channel to verify this.
The process of gene duplication and diversification within the unc-38, acr-8 and unc-29 clades is extensive and it appears this process still continues. The unc-29 gene found only once in C. elegans is present as four paralogous copies in the trichostrongylid parasites H. contortus, T. colubriformis and T. circumcincta, (Fig. 4) (Neveu et al. Reference Neveu, Charvet, Fauvin, Cortet, Beech and Cabaret2010). This event predates divergence of the trichostrongylids and each paralog now has similar, but distinct, pharmacological properties (T. Duguet, personal communication).
MOLECULAR EVOLUTION
The primary amino acid sequence of the pLGIC subunit genes is highly conserved, but the family is so ancient that a typical BLASTP search using a single subunit sequence query fails to identify significant homology with all members of the pLGIC family, even within the well characterized C. elegans. Searches based on the most conserved residues, such as those of the cys-loop motif, have been used to identify more distantly related pLGIC genes (Jones et al. Reference Jones, Davis, Hodgkin and Sattelle2007; Jones and Sattelle, Reference Jones and Sattelle2008) and pLGICs present in prokaryotic genomes can be identified using a profile based blast, PSI-BLAST, that focuses principally on conserved sequence (Tasneem et al. Reference Tasneem, Iyer, Jakobsson and Aravind2005). For example, the Cel-UNC-38 protein is 82% identical with Hco-UNC-38, 89% excluding the more variable intracellular loop region, 78% identical with the clade III A. suum UNC-38 and 66% identical with the clade I T. spiralis UNC-38. This falls to 33% between subunits from neighbouring clades, Cel-UNC-38 and Cel-ACR-16 and the cationic Cel-UNC-38 with the anionic Cel-GGR-2 have only 17% amino acid identity with a BLASTP significance E-value of 0·083, which would not normally be considered significant.
The rate at which nucleotide substitution occurs in a majority of DNA sequence is generally considered to have no significant effect on survival or transmission of genes to the next generation (Kimura, Reference Kimura1968; King and Jukes, Reference King and Jukes1969). In protein coding sequence, the substitution rate for positions that do affect the protein sequence (dN) can be influenced by natural selection as determined by protein function. Those that do not (dS) are usually assumed to evolve as though they have no consequence on survival. The ratio between these two values (dN/dS) can be used as a measure of the strength and direction of natural selection acting on a protein (Miyata et al. Reference Miyata, Yasunaga, Yamawaki-Kataoka, Obata and Honjo1980; Li et al. Reference Li, Wu and Luo1985; Nei and Gojobori, Reference Nei and Gojobori1986). If the ratio is less than one, then mutations that lead to amino acid replacements are seen less often than expected and may have been removed by natural selection, conserving the protein sequence and presumably some function that influences survival. A ratio close to one means that amino acid replacement occurs as easily as substitutions that have no effect on survival, an indication that the specific amino acid sequence is not particularly important. The special case where the ratio is greater than one indicates that amino acid changes increase the chance of survival and suggest a benefit of sequence diversity (Hughes and Nei, Reference Hughes and Nei1988; Hughes, Reference Hughes1994) or adaptation to a new function (Swanson et al. Reference Swanson, Irwin and Wilson1991; Vallender and Lahn, Reference Vallender and Lahn2004).
The relative substitution rate for non-synonymous (dN) to synonymous (dS) substitutions within the ggr-3, mod-1 and acc-1 anionic pLGIC subunit clades shows very strong purifying selection maintaining protein sequence over a majority of the coding sequence (Beech et al. Reference Beech, Callanan, Rao, Dawe and Forrester2013). The dN/dS ratio (ω) of 0·0072 for the aligned sequence over the three clade family means that for every 1000 mutations that change the amino acid sequence, only seven are not removed by natural selection. This places the pLGIC subunits between the extremely conserved histone proteins (ω≈0) and cytoskeletal beta-actin (ω = 0·010) and shows they are much more conserved than other ion-channels including rhodopsin (ω = 0·04) and K+ voltage-gated channels (ω = 0·027) (Patthy, Reference Patthy2008; Zhao et al. Reference Zhao, Ru, Teeling, Faulkes, Zhang and Rossiter2009; Liu et al. Reference Liu, Han, Franchini, Xu, Pisciottano, Elgoyhen, Rajan and Zhang2012). There is clearly a strong effect of the pLGIC subunits on survival. In apparent contradiction, the phenotype for null mutants of many C. elegans pLGIC genes is apparently normal, although these observations are in the rather pampered petri-dish environment (Yook et al. Reference Yook, Harris, Bieri, Cabunoc, Chan, Chen, Davis, de la Cruz, Duong, Fang, Ganesan, Grove, Howe, Kadam, Kishore, Lee, Li, Muller, Nakamura, Nash, Ozersky, Paulini, Raciti, Rangarajan, Schindelman, Shi, Schwarz, Ann Tuli, Van Auken and Wang2012). This apparent contradiction, discussed above, is an area that will require further investigation to reconcile.
Amino acid residues that contact bound ligand and those that form the TM anchor of the pLGIC subunit are more conserved and evolve at a significantly slower rate that the remaining background of protein sequence within the ggr-3, mod-1 and acc-1 clades. This is consistent with the critical role these residues play in ion-channel function. The functional adaptation of receptors to a different activating ligand has occurred many times within the anion pLGIC subunit family (Dent, Reference Dent2006). Amino acid changes responsible for specific, high affinity binding of certain neurotransmitters have been identified (Mu et al. Reference Mu, Lester and Dougherty2003; Kesters et al. Reference Kesters, Thompson, Brams, van Elk, Spurny, Geitmann, Villalgordo, Guskov, Danielson, Lummis, Smit and Ulens2013; Lynagh et al. Reference Lynagh, Beech, Lalande, Keller, Cromer, Wolstenholme and Laube2014) but the mechanisms that bring about such a change in specificity are not well understood. Within the ggr-3, mod-1 and acc-1 clades, we have three predominant affinities for activating ligand. Receptors in the ggr-3 clade are activated preferentially by dopamine, tyramine and other biogenic amines, the mod-1 receptor is activated by serotonin and the acc-1 receptors respond to acetylcholine with highest sensitivity (Ranganathan et al. Reference Ranganathan, Cannon and Horvitz2000; Putrenko et al. Reference Putrenko, Zakikhani and Dent2005; Rao et al. Reference Rao, Siddiqui, Prichard and Forrester2009, Reference Rao, Accardi, Siddiqui, Beech, Prichard and Forrester2010). Analysis of the substitution rates along different branches in the phylogeny of these subunits reveals that the rate ratio along the branches leading to the mod-1 and acc-1 clades, and only for the residues that interact with bound ligand, are significantly elevated (Beech et al. Reference Beech, Callanan, Rao, Dawe and Forrester2013). The values of ω = 0·019 and 0·017, respectively, however, do not approach one. It appears that the process of switching to a new ligand depends on a relaxation of selective pressure once a gene duplication occurs, rather than active selection to switch to the new ligand.
Concluding remarks
The difficulty of working directly with parasitic nematodes has led to the widespread use of the free living C. elegans as a model. Despite great success in identifying the receptors responsible for susceptibility to ivermectin (Cully et al. Reference Cully, Vassilatis, Liu, Paress, Van der Ploeg, Schaeffer and Arena1994), levamisole (Boulin et al. Reference Boulin, Gielen, Richmond, Williams, Paoletti and Bessereau2008) and monepantel (Kaminsky et al. Reference Kaminsky, Ducray, Jung, Clover, Rufener, Bouvier, Weber, Wenger, Wieland-Berghausen, Goebel, Gauvry, Pautrat, Skripsky, Froelich, Komoin-Oka, Westlund, Sluder and Maser2008), in each case the receptors show substantive differences with the cognate receptors found in even closely related parasitic nematodes such as H. contortus (Forrester et al. Reference Forrester, Prichard, Dent and Beech2003; Rufener et al. Reference Rufener, Maser, Roditi and Kaminsky2009; Boulin et al. Reference Boulin, Fauvin, Charvet, Cortet, Cabaret, Bessereau and Neveu2011; Glendinning et al. Reference Glendinning, Buckingham, Sattelle, Wonnacott and Wolstenholme2011). This is also true between different helminth species (Williamson et al. Reference Williamson, Robertson, Brown, Williams, Woods, Martin, Sattelle and Wolstenholme2009; Boulin et al. Reference Boulin, Fauvin, Charvet, Cortet, Cabaret, Bessereau and Neveu2011; Buxton et al. Reference Buxton, Charvet, Neveu, Cabaret, Cortet, Peineau, Abongwa, Courtot, Robertson and Martin2014). Evolutionary change within the pLGIC subunits is clearly of central interest in our understanding and characterization of this family of receptors. A wider understanding of the processes that determine how receptor composition may change, how the pharmacological profile of specific receptors may adapt and the evolutionary forces that constrain their function is becoming essential to the understanding of anthelmintic action and resistance. In a wider context, our understanding of the nematode pLGIC receptors has benefited greatly from the large body of research focused on the vertebrate pLGICs. The large number of parasitic nematode species, each with receptors of possibly different composition as well as different sensitivities to a wide panel of activating and inactivating ligands means that a comparative analysis may in return increase our understanding of the pLGIC family as a whole.
ACKNOWLEDGMENTS
The authors would like to thank S. Forrester for drawing our attention to problems with nomenclature of the unc-49 transcripts and protein.
FINANCIAL SUPPORT
R. B. is a recipient of a Le Studium Research Fellowship.



