I. INTRODUCTION
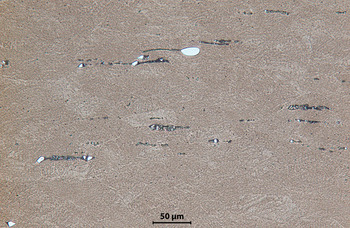
Metallographic and scanning electron microscopic evaluation (SEM) of NiTi microstructures often reveals a second-phase precipitate whose chemistry is close to the Ti2Ni phase (Figure 1).
(Color online) Characteristic Ni–Ti microstructure with second-phase particles.

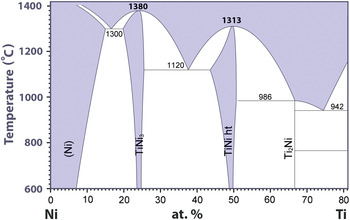
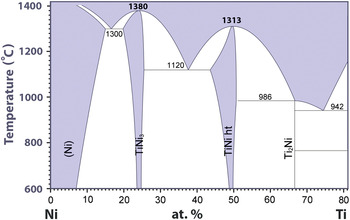
The precipitate size or volume cross-section sampled by an electron beam in the SEM and electron microprobe usually includes part of the matrix which prevents an accurate composition of the precipitate to be determined. One of the goals of this study was to evaluate analytical tools for the investigation of these phases in NiTi. The NiTi chemistry is closely controlled to be slightly Ni-rich and the current phase diagram (Bellen et al., Reference Bellen, Kumar, Wollants, Villars, Okamoto and Cenzual1996) does not predict Ti2Ni precipitation in a homogeneous sample cooled from the melt (Figure 2). Carbon is also considered an impurity and specified to be no more than 0.05% in NiTi shape memory alloys.
(Color online) Ni–Ti partial phase diagram. (Reprinted with permission from ASM International. All rights reserved.)
A standard procedure for extraction of precipitates in Ni base superalloys and their analysis using wide-angle X-ray diffraction (WAXRD) is described in ASTM E 963-95 (2000) Standard Practice for Electrolytic Extraction of Phases from Ni and Ni–Fe Base Superalloys Using a Hydrochloric-Methanol Electrolyte. This technique was used on NiTi and found to be successful in separating and collecting precipitate phases from the parent material.
II. EXPERIMENTAL
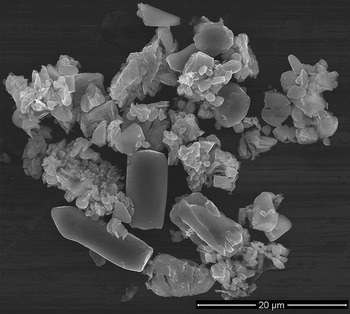
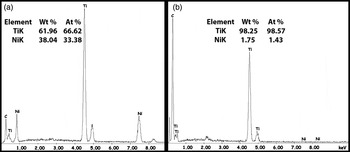
Samples of NiTi weighing only a few grams were partially dissolved electrolytically in a 10% HCl–methanol solution containing 1.7 g of tartaric acid per 300 ml. The undissolved residue with electrolyte was collected and vacuum filtered using a 0.4-μm polycarbonate membrane filter. A sample of the filtrate was evaluated for chemistry in the electron microprobe and an image of the material is shown in Figure 3. An energy dispersive spectroscopic (EDS) scan of one of the large particles suggests the precipitate is Ti2Ni on the basis of the chemical analysis [Figure 4(a)]. A second EDS scan from a group of smaller particles is shown in Figure 4(b). As no other significant elemental species are found in the EDS scan other than titanium and carbon present as impurities, this suggests the fine particles are carbides of titanium. As carbon cannot be determined quantitatively with this method, a complementary technique of X-ray diffraction was used for phase identification.
SEM images of extracted particles.

EDS spectra and chemical analysis for (a) large particles and (b) cluster of small particles extracted from NiTi.

A few milligrams of material were collected on the filter for analysis. This was attached to a glass slide with petroleum jelly and placed in the sample holder for X-ray analysis. The specimen was scanned over a 2θ angular range from 10° to 145° using a Siemens D5000 diffractometer with a diffracted beam graphite monochromator tuned to CuKα radiation. The diffracted X-ray intensity is typically collected over a 24-h period to improve the data statistics.
III. RESULTS AND DISCUSSION
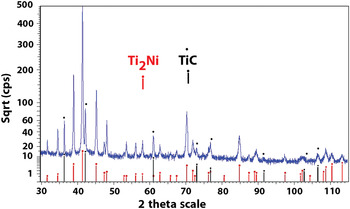
Ti2Ni (PDF018-0898) and TiC (PDF 032-1383) phases were positively identified by comparing the diffraction pattern with the ICDD database for the two compounds (Figure 5).
(Color online) WAXRD pattern from extracted particles.

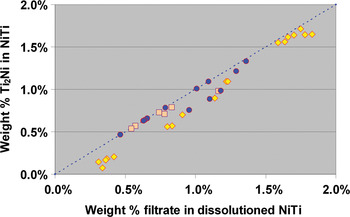
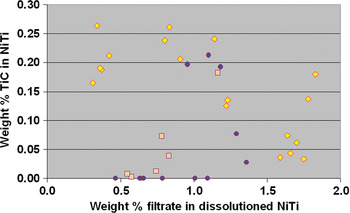
Additional samples were acquired and all subsequent electrolytic phase extractions consistently revealed only the Ti2Ni and TiC phases. The amount of TiC present in the samples varied depending on supplier and melting practice for NiTi (Figure 6). The weight amount of residue remaining after NiTi dissolution was consistently <2% and Ti2Ni made up the largest portion. This is shown in Figure 7, with the amount trending along the 45° line. The symbols represent materials from three suppliers. The deviation from 45° was attributable to the presence of TiC in the sample, as shown in Figure 8.
(Color online) Different melt ‘heat lots’ of NiTi showing varying amounts of TiC.

(Color online) Weight percent of Ti2Ni in NiTi.

(Color online) Weight percent of TiC in NiTi.

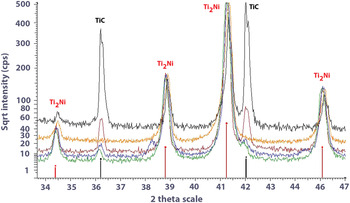
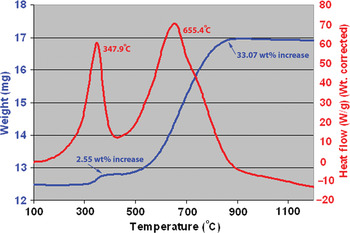
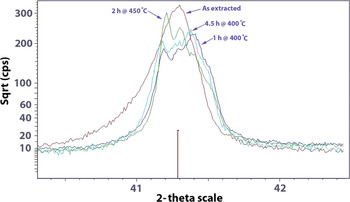
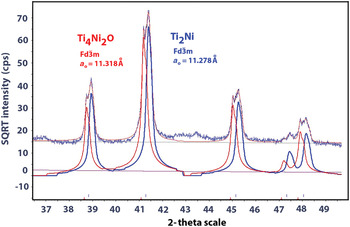
The literature suggests that the Ti2Ni phase combines with oxygen impurities in the material and is identified as a sub-oxide (Mueller and Knott, Reference Mueller and Knott1963). A quantity of Ti2Ni was collected by dissolving several grams of NiTi that exhibited no evidence of TiC and examined using simultaneous thermogravimetric analysis (TGA) and differential scanning calorimetry (DSC) (SDTA). The TGA and DSC data show that two significant reactions occur between 100 and 1000 °C (Figure 9). A modest increase in mass occurs at ≈348 °C (~2.5%) and a larger increase at ≈655 °C (~33%). A larger quantity of material was subsequently extracted, apportioned and heated in an alumina crucible at 400, 450, or 900 °C. The increase in weight for each of the samples was very close to the amount indicated in the TGA experiment. These samples were then evaluated to determine changes in the WAXRD pattern. A distinct splitting of the diffraction peaks occurred for Ti2Ni when heated in air to 450 °C (Figures 10 and 11).
(Color online) SDTA results for a sample of Ti2Ni without TiC.

(Color online) Oxidation of Ti2Ni at 400 and 450 °C to Ti4Ni2O (PDF 005-0694).

(Color online) Splitting of Ti2Ni phase peaks with Ti4Ni2O (PDF 005-0694) formation from exposure to air at 400 °C.

When heated to higher temperatures, Ti2Ni was oxidized to TiNiO3 and TiO2 (Rutile). A LECO TCH 600 Analyzer was used to evaluate the oxygen content of Ti2Ni samples before and after exposure to air at 400 °C for 5 h. The weight gain, exothermic reaction, and oxygen analysis clearly indicate that the Ti2Ni lattice oxidizes to Ti4Ni2O. The crystal structure of this oxide is the same as Ti2Ni (Mueller and Knott, Reference Mueller and Knott1963) with a slightly larger unit-cell parameter as indicated by the splitting of the diffraction peaks (Figures 10 and 11).
The average oxygen content for three samples of “as extracted” Ti2Ni was 6.1 wt% (17.2 at%) and after heating in air to 400 °C for 5 h was 19.6 wt% (44.0 at%), but the crystal structure was still consistent with Ti4Ni2O, which has an oxygen content of 14.29 at%. Three other oxides have oxygen atom percents of 53.85 (Ni5TiO7), 55.56 (Ni3TiO5), and 60 at% (TiNiO3). However, no diffraction peaks could be associated with these phases even though the oxygen level was more than required for the Ti4Ni2O phase that was identified.
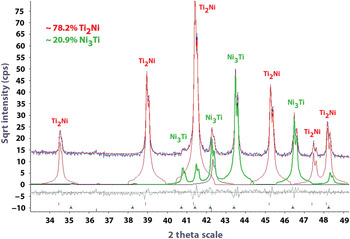
Three Ni-rich NiTi samples with 60 at% Ni and one with 57 at% Ni were also analyzed using electrolytic dissolution. The dominant phase was still Ti2Ni, but Ni3Ti (PDF 051-1169) was also present. A representative X-ray diffraction scan was evaluated using the Rietveld procedure and is shown in Figure 12.
(Color online) Rietveld analysis of X-ray diffraction pattern revealing Ti2Ni and Ni3Ti precipitates (PDF 051-1169) in 60% NiTi.

IV. CONCLUSION
Ti2Ni and TiC phases were quantitatively extracted from NiTi using electrolytic dissolution and identified using powder X-ray diffraction. When Ni-rich NiTi was evaluated using this technique, Ti2Ni and Ni3Ti phases were extracted and identified. Ti2Ni oxidizes to Ti4Ni2O at <450 °C with the same crystal structure as Ti2Ni and further oxidizes to NiTiO3 and TiO2 at 900 °C.
ACKNOWLEDGMENTS
The author acknowledges the assistance of several individuals who performed the various tests reported in this investigation: Metallography—Martin Farris, EPMA—Jeff Wessel, SEM—Chris Meyer, SDTA—Cynthia Wittman, and Oxygen Analysis—Tom Begley.