Transposition of the great arteries requires neonatal intervention for survival.Reference Bonchek and Starr1 The first described surgical treatment, atrial redirection of flow,Reference Zavanella and Subramanian2 conferred considerable problems with late mortality and has now been superseded by the arterial switch correction.Reference Williams, McCrindle, Ashburn, Jonas, Mavroudis and Blackstone3 The arterial switch operation results in suture lines both across the ascending aorta and pulmonary trunk as well as around the coronary ostia.Reference Warnes4 Since a majority of the sympathetic nerves enters the heart through the great arteries, a substantial proportion of the sympathetic inflow is severed.Reference Janes, Brandys, Hopkins, Jonas, Mavroudis and Blackstone5 Removal of the sympathetic nerves usually leads to denervation hypersensitivity in the affected organs due to an upregulation of the α-receptors and of an immediate disruption of the reuptake of norepinephrine into the sympathetic nerve terminals; however, the organs studied in this respect have not included the heart.Reference Trendelburg6 A denervation hypersensitivity to norepinephrine might increase the risk of arrhythmias, and early sudden deaths without coronary occlusion have been observed after arterial switch.Reference Tamisier, Ouaknine and Pouard7 At a heart transplantation, there is a total sympathetic denervation of the ventricles of the heart,Reference Rundqvist, Elam, Eisenhofer and Friberg8, Reference Regitz, Bossaller, Strasser, Schuler, Hetzer and Fleck9 and a partial reinnervation has been observed to occur.Reference Wilson, Johnson, Haidet, Kubo and Mianuelli10, Reference Schwaiblmair, von Scheidt and Uberfuhr11 Less than a month after arterial switch surgery, there is virtually no [123]metaiodobenzylguanidine uptake in cardiac sympathetic nerve terminals, but after a year there are various degrees of return of uptake suggesting partial reinnervation.Reference Kondo, Nakazawa, Momma and Kusakabe12 It has previously been described that sympathetic nerves have trophic effects in the heart and other organs,Reference Wells, Handelman and Milgram13–Reference Östman-Smith17 and neuropeptide Y and nerve growth factor released from sympathetic nerves are important for angiogenesis.Reference Zukowska-Grojec, Karwatowska-Prokopczuk, Fisher and Ji18, Reference Lazarovici, Marcinkiewicz and Lelkes19 There has been concern that coronary flow reserves are reduced in children that have had arterial switch surgery,Reference Gagliardi, Adorisio, Crea, Versacci, Di Donato and Sanders20, Reference Hauser, Bengel and Kuhn21 and there is therefore a need to study the consequences of the arterial switch operation both on adrenergic and vascular responses in an animal model. Accordingly we devised an operation emulating the suture lines resulting from arterial switch surgery. This simulated arterial switch operation was performed on very young piglets in order to study physiological differences between thus denervated hearts and controls.
Materials and methods
Experimental animals
A total of 24 female piglets of Swedish Lantras breed were obtained from a commercial breeder, and following animal welfare guide lines they were operated on after weaning at an age of approximately 8 weeks, at which time they had a body weight of mean (standard deviation) of 15.4 (3.0) kilo. The piglets were purchased in groups of four, all littermates; usually two littermates underwent a simulated switch procedure and two underwent a sham operation.
The surgical procedure
The piglets were given pre-operative sedation with midazolam, mean 2.0 (0.4) milligrams per kilogram body weight, and ketamine 13.3 (2.8) milligrams per kilo intramuscularly. Anaesthesia was induced by intravenous propofol 2–2.5 milligrams per kilo and the pigs were intubated and maintained on a Siemens Servo 900 ventilator. No muscle-relaxants were used.
Anaesthesia was maintained with propofol 6.3 (4) milligrams per kilo and fentanyl 15.5 (6.8) micrograms per kilo intravenously, and isoflurane inspired concentration 0.9 (0.3) percent. Jugular venous and femoral arterial lines were inserted. The operation was carried out by a partial lower sternotomy because of an animal welfare rule that forbids the division of the manubrium of the sternum in pigs that must be able to stand after the operation. The heart was put on bypass via cannulas inserted in the right atrial auricle and the ascending aorta. The bypass circuit was primed with 150 millilitres of cross-matched donor pig blood, 100 millilitres of buffer (Tribonat, Fresenius Kabi), 100 millilitres of 20 percent albumin, and 150 millilitres of Ringer-acetate, in total 500 millilitres. On bypass the piglet was cooled to 32 degrees centigrade, and the heart was arrested by cardioplegia solution. The aorta and the pulmonary arteries were completely transected and the coronary arteries were cut out with large surrounding buttons of aortic wall and sewn back into their original places, after which the aorta and pulmonary artery were also re-sutured in their original place. This created the same suture lines as from the true arterial switch, transecting nerves passing into the heart via the great vessels. However, as the coronaries are sewn back in the original position, the risk of coronary kinking or torsion is much lower than with a true arterial switch. During weaning from bypass an average dose of 7 (6) microgrammes per kilo per minute of dopamine was infused intravenously for a short period. In piglets with the simulated arterial switch the surgeons placed a Gore-Tex membrane between the heart and the sternum to facilitate later extirpation of the heart for the Langendorff preparation. The sham-operation included the same kind of anaesthesia and partial sternotomy as with the simulated arterial switch, without opening the pericardium. After surgery, the piglets were carefully re-warmed to normal body temperature, and piglets subjected to simulated arterial switch were allowed to stabilise on positive-pressure ventilation for about 2 hours, and if needed given a further blood transfusion, before extubation. There were three deaths following switch surgery. The mortality was caused in one case by the transfusion of donor-pig blood, which unknown to us, had been bacterially contaminated and caused instant circulatory collapse because of bacterial toxins, and in two cases by sudden ventricular arrhythmia during the first 2 hours after surgery (pigs have a notoriously low threshold for cardiac arrhythmias). There were no macroscopic problems with coronary anastomoses in these three piglets. Post-operative analgesia was maintained with subcutaneous morphine, and oral karprofen (Rimadyl vet.®, Orion, Animal Health) and the piglets were closely supervised in specially heated observation cubicles. The study protocol has been approved by the ethics committee for animal studies at Gothenburg University, and conformed to the principles of the American Physiological Society.
The in vivo study
The time interval for physiological study (around 6 weeks) was determined to allow any denervation supersensitivity to develop fully, and to minimise possible reinnervation of the heart. We had seven long-term survivors after simulated arterial switch, and 13 sham-operated controls. For the physiological studies 5–7 weeks after the arterial switch anaesthesia was maintained with a pentobarbital sodium (60 milligrams per millilitre) infusion, starting with 8 millilitres per hour and then gradually lowered down to 1.5 millilitres per hour, and around 0.6 percent of isoflurane via the ventilator to maintain a constant depth of anaesthesia throughout the study. Central venous and arterial lines were inserted in the same way as during the simulated switch surgery. Atropine 0.015 milligrams per kilo body weight was given intravenously in order to minimise mucus production in the respiratory tract. Heart rate and blood pressure were continuously monitored with a Datex-Ohmeda S/5 (Datex-Ohmeda Division Instrumentarium Corp., Madison, Wisconsin, USA). When steady state heart rate and blood pressure level were reached the first dose–response curve with norepinephrine was initiated. Norepinephrine was diluted in physiological saline, with the addition of 0.11millimoles of ascorbic acid to increase catecholamine stability, immediately before use for a dose–response curve giving doses of 0.059, 0.12, 0.30, 0.59, 1.2, 2.4, 4.7, and 9.5 nanomoles per kilo body weight (corresponding to 0.01, 0.02, 0.05, 0.1, 0.2, 0.4, 0.8, and 1.6 microgrammes per kilo). The norepinephrine was administered via the central venous line during 5 seconds. Heart rate and blood pressure responses were recorded until baseline levels were reached again, and subsequent doses were given in the same fashion. After finishing the norepinephrine dose–response curve, the piglets were allowed to recover on the ventilator for 60–90 minutes. The same protocol was then repeated with epinephrine in the same doses expressed as micrograms but corresponding to 0.055, 0.11, 0.27, 0.55, 1.1, 2.2, 4.4, and 8.7 nanomoles per kilo body weight, and recordings were obtained in the same way.
In vitro study
After the piglet had been allowed to recover for a further 60 minutes, fentanyl 2 microgrammes per kilo was added to the prevailing anaesthesia before extirpation of the heart for a Langendorff preparation. The sternum was opened and the beating heart was carefully freed from all surrounding tissues. Five minutes before transecting the vessels the pig received 300 International Units of heparin per kilo body weight to prevent micro clots forming before reperfusion was commenced.
The isolated heart was mounted via the aorta onto a plastic tube and perfused ad modum Langendorff with 37 degrees Centigrade Krebs solution, pre-oxygenated for a minimum of 30 minutes with a 95 percent oxygen per 5 percent carbon dioxide mixture, at a perfusion pressure of 60 centimetres of water. One side-port was used for slow bolus-injections of norepinephrine given over 5 seconds, another for continuous recordings of heart rate. A mixing chamber was placed just above to the heart to create fluid turbulence, producing even mixing of the norepinephrine dose. The isolated heart was placed in a chamber surrounded by a heater to maintain 37 degrees Centigrade, and the pulmonary artery was opened to ensure unobstructed right ventricular emptying. The coronary perfusion fluid draining via the coronary sinus was collected. The amount of Krebs solution perfusing the heart was recorded minute by minute throughout the Langendorff study.
When the isolated heart had reached a steady baseline in both heart rate and coronary flow, norepinephrine was administered with norepinephrine doses adjusted to coronary flow rate to give 0.047, 0.095, 0.19, and 0.38 micromoles per litre coronary perfusate, corresponding to 0.008, 0.016, 0.032, and 0.064 microgrammes per millilitre. Heart rate was recorded continuously. When the heart rate had returned to baseline, and with a minimum of 5 minutes between the doses, the next dose was given.
Statistics
Statistical analysis was carried out on commercial software (Statgraphics Plus v5.2 and Graph Pad Prism 4). Group results were compared using Mann–Whitney U-test, as normal distribution could not be assumed. Dose–response curves in the Langendorff preparation were constructed using Graph Pad Prism, and compared using four-criteria analysis (bottom, top, Hill slope, effective concentration for 50 percent of maximal response).
Results
In vivo study
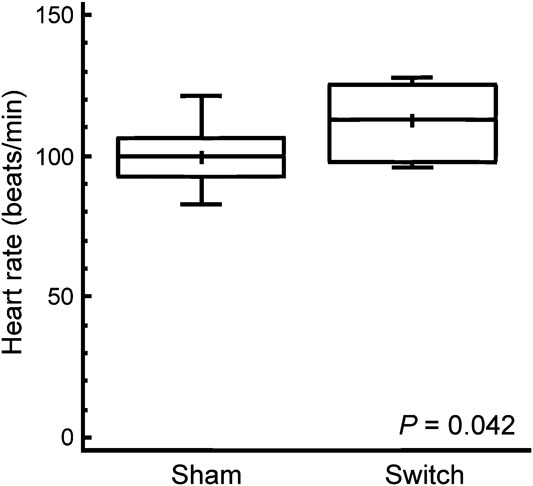
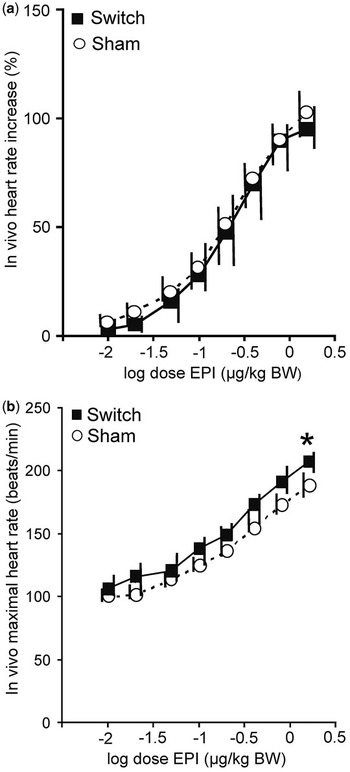
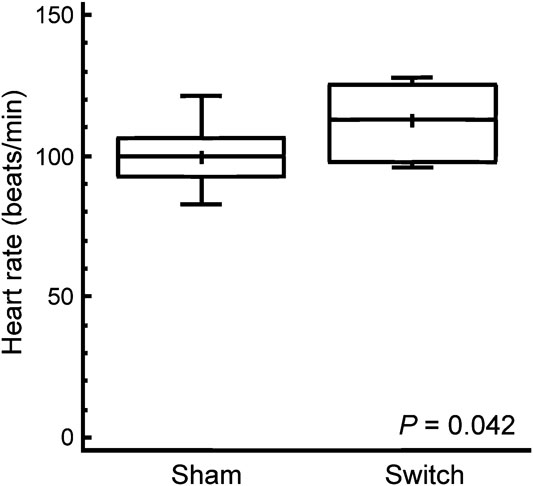
Baseline heart rate was 12 percent higher in simulated switch-operated piglets than in controls, with a mean (standard deviation) value of 112 (12) beats per minute in simulated switch as compared to 100 (10) beats per minute in sham-operated (p = 0.042); see Figure 1. There were no significant differences in blood pressure responses to norepinephrine between simulated switch and sham-operated piglets. The heart-rate responses were biphasic due to the baro-receptor reflex, and the chronotropic responses to norepinephrine are therefore best seen in the Langendorff preparation (see below). The epinephrine-dose chronotropic responses were not biphasic, and although the simulated switch piglets started at a higher baseline heart rate, there was no significant difference in heart-rate increase in response to epinephrine when expressed as percent increase (Fig 2a), although the switch piglets, with higher absolute heart rates, might be reaching the plateau part of the dose– response curve by 8.7 nanomoles per kilo body weight (1.6 micrograms per kilo). Throughout the dose range, maximal heart rates in response to epinephrine tended to be higher in the switch group, with median heart rates between 9 and 12.3 percent higher than in the sham group with the three highest doses, but because of wide variability the difference was only significant with the 8.7 nanomoles per kilo dose (p = 0.044; Fig 2b).
The in vivo baseline heart rate in sham- and simulated switch-operated piglets around 6 weeks after surgery. The box and whisker plots illustrate the median as a horizontal line, arithmetic mean as a cross, with the central quartiles enclosed in the box and the whiskers indicating upper and lower quartiles.
(a) Dose–response curve with percent increase in heart rate in anaesthetised piglets after intravenous epinephrine (EPI) injection. The dotted line indicates the dose–response curve of sham-operated animals and the solid line that of simulated switch-operated piglets. The symbols indicate median response, and the vertical lines the interquartile range. The doses were calculated as microgrammes per kilo, thus X-axis is labelled as log dose in microgrammes per kilo; the doses given were 0.055, 0.11, 0.27, 0.55, 1.1, 2.2, 4.4, and 8.7 nanomoles per kilogram of body weight. (b) Peak heart rate responses after intravenous epinephrine injection in anaesthetised piglets. Symbols and doses as in Figure 2a; * denotes significantly different from sham-operated piglets on Mann–Whitney U-test, p = 0.049.

In vitro study
In the Langendorff preparation, dissection was difficult because of pericardial adhesions in most of the simulated switch piglets and some of the sham-operated controls. Dissection resulted in arrhythmia propensity requiring defibrillation and in coronary artery damage in some hearts. No dose–response curves obtained after defibrillation were used. Furthermore, some hearts sucked in air via the cut pulmonary veins on norepinephrine stimulation resulting in coronary air embolism. Thus intrinsic heart rate was measured in six simulated switch hearts and in 13 control hearts, but complete dose–response curves to norepeinephrine was obtained in five simulated switch hearts and eight control hearts. In the dose–response curves, a minimum of three to a maximum of five doses of norepinephrine were given to the isolated heart.
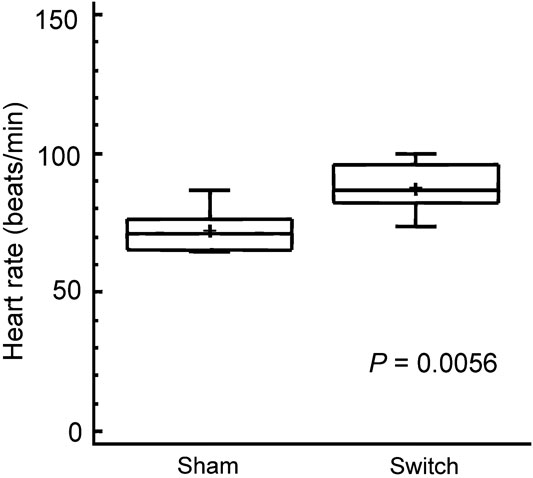
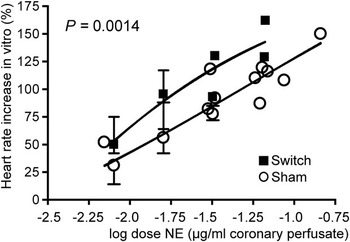
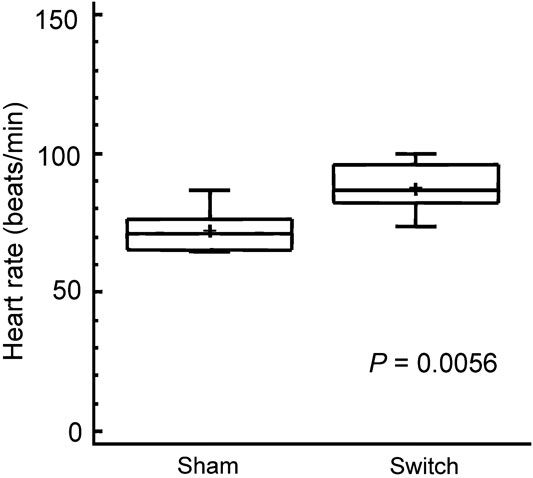
The hearts isolated from animals undergoing the arterial switch procedure had a 22 percent higher intrinsic heart rate, mean (standard deviation) 89 (9) beats per minute in switch hearts as compared to 73 (8) beats per minute in sham hearts (p = 0.0056; see Fig 3). The dose–response curves of the isolated hearts were significantly different on four-criteria analysis between simulated switch hearts and sham-operated hearts with a significantly higher chronotropic response to norepinephrine seen in the switch hearts (p = 0.0014; Fig 4). The sensitivity of simulated switch hearts to chronotropic effects of norepinephrine was almost doubled, as illustrated by the dose required to induce an 80 percent increase in heart rate (Fig 5). This response level was chosen for comparison because it was approximately half-way up the linear part of the dose–response curves. It was not possible to obtain an exact estimate of effective concentration for 50 percent of the truly maximal response, as we did not want to cause ischaemic damage to the hearts which were also to be subject of later histological study.
Baseline intrinsic heart rate in the isolated heart perfused in the Langendorff preparation about 6 weeks after surgery. The box and whisker plots show the same symbols as in Figure 1.
Dose–response curve to norepinephrine (NE) in the Langendorff preparation. Percent increase in heart rate is illustrated as open circles for hearts from sham-operated pigs, and filled squares for hearts about 6 weeks after switch surgery. Variations in coronary flow meant that although very similar not all doses were absolutely identical between various experiments. Individual observations are plotted as symbols only; where the doses were identical in several experiments, the symbol denotes the median, and the brackets the range. Norepinephrine dose range used for the dose–response curves corresponded to 0.047–0.38 micromoles per litre perfusate. On four-criteria analysis, that is, bottom, top, Hill slope and 50 percent of maximal response, the dose--response curves were significantly different between sham- and switch-operated piglets.

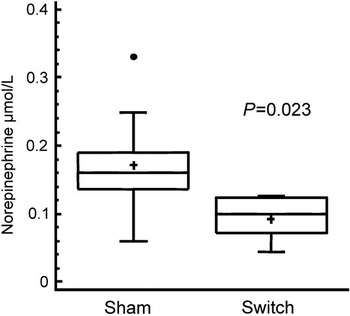
Comparison of the norepinephrine dose that produces an 80 percent increase in heart rate in the Langendorff preparation about 6 weeks after sham and switch operation. The box and whisker plots show symbols as in Figure 1. An outlier observation is indicated by a dot.

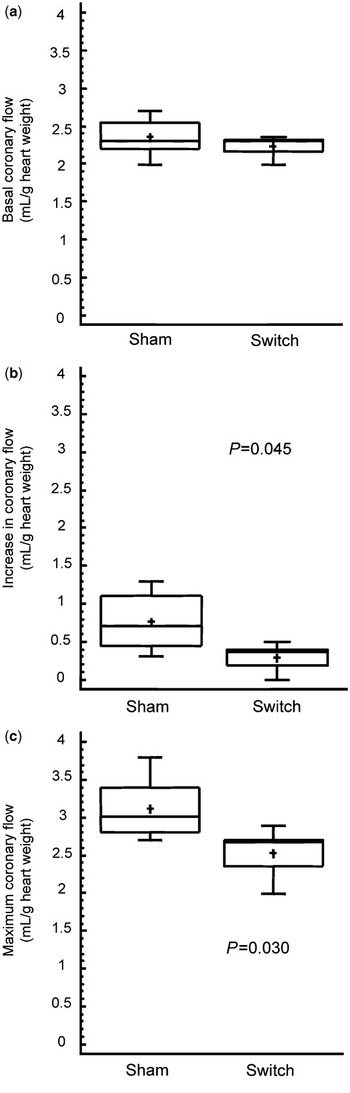
The coronary flows at baseline were not significantly different between the two groups (Fig 6a). However, the increase in flow after maximal norepinephrine stimulation was lower in simulated switch hearts, mean (standard deviation) 0.3 (0.2) versus 0.8 (0.4) millilitres per gram heart weight (Fig 6b; p = 0.045), and maximal coronary flow 2.5 (0.4) versus 3.1 (0.4) millilitres per gram heart weight (p = 0.030) was also significantly reduced in simulated switch hearts (Fig 6c), in spite of the fact that their heart-rate increases were greater.
(a) Baseline coronary flow in the Langendorff preparation, expressed as millilitres per gram heart weight, in isolated switch- or sham-operated heart; there is no significant difference (p = 0.51). The box and whisker plots show symbols as in Figure 1. (b) Increase in coronary flow from baseline to maximal flow in individual piglets after norepinephrine injection, expressed as millilitres per gram heart weight, in isolated switch- or sham-operated heart; symbols as in Figure 1. (c) Maximal coronary flow after norepinephrine injection, expressed as millilitres per gram heart weight, in isolated switch- or sham-operated hearts; symbols as in Figure 1.

At the end of the Langendorff perfusion, the hearts were perfused with formalin, and examination of the proximal coronary anastomoses with the ascending aorta revealed wide patency with no ostial narrowing in any simulated switch heart.
Discussion
The arterial switch correction for transposition has now superseded the atrial switch correction, because of its lower late mortality at least at mid-term.Reference Williams, McCrindle, Ashburn, Jonas, Mavroudis and Blackstone3 However, even with arterial switch surgery, a late mortality exists, being reported at between 2.7 and 6 percent after 5 to 10 years follow-up in various series.Reference Pretre, Tamisier and Bonhoeffer22, Reference Brown, Park and Turrentine23 Most late deaths are related to coronary artery stenoses but some are caused by arrhythmias, which occur in 9.6 percent of 1-year survivors.Reference Hayashi, Kurosaki and Echigo24 Both early denervation supersensitivity,Reference Trendelburg6 and inhomogeneity of sympathetic innervations, which is likely to be present during the reinnervation phase,Reference Hayashi, Kurosaki and Echigo24, Reference Uberfuhr, Frey and Reichart25 predispose to arrhythmias. That some re-innervation occurs after arterial switch surgery is suggested by [123]metaiodobenzylguanidine imaging,Reference Kondo, Nakazawa, Momma and Kusakabe12 and has also been reported to occur after heart transplantation that severs sympathetic inflow both at atrial and at great artery levels.Reference Wilson, Johnson, Haidet, Kubo and Mianuelli10, Reference Schwaiblmair, von Scheidt and Uberfuhr11, Reference Odaka, von Scheidt and Ziegler26 Several of the changes we have observed in the simulated switch-operated piglets have clear clinical implications for the possible induction of arrhythmias.
Resetting of intrinsic and maximal heart rates
The finding of a 12 percent higher baseline heart rate in simulated switch piglets is clearly not caused by reduced vagal activity since it is present in the isolated heart (Langendorff preparation) that had a 22 percent higher intrinsic rate. In the latter preparation, the heart is removed from autonomic control, thus the finding must represent a resetting of the sinus node intrinsic heart rate. There are previous reports that chronic spinal cord interruption reduces sinus node cycle length,Reference Rodenbaugh, Collins and DiCarlo27 whereas conversely chronic spinal cord stimulation increases sinus node cycle length.Reference Olgin, Takahashi, Wilson, Vereckei, Steinberg and Zipes28 Likewise chronic exercise training increases the R-to-R interval in isolated rabbit hearts.Reference Such, Rodriguez and Alberola29 In the setting of animal models of heart failure, which have chronically increased cardiac sympathetic activity, such increases in cycle length are mediated via effects on the hyperpolarisation-activated pacemaker current (If) and the slow component of the delayed rectifier current (IKs).Reference Verkerk, Wilders, Coronel, Ravesloot and Verheijck30 Therefore, a plausible hypothesis is that a chronic reduction in sympathetic activity caused by severing the majority of the sympathetic inflow to the hearts via the great vessels results in secondary shortening of the intrinsic cycle length of the sinus node. This altered cycle length is maintained even with acute catecholamine stimulation, resulting in significantly higher heart rates in switch-operated piglets following epinephrine administration. In animal models such changes lead to a significantly reduced threshold for ventricular arrhythmias.Reference Rodenbaugh, Collins and DiCarlo27
Higher sensitivity to circulating catecholamines
In spite of the fact that baseline and maximal heart rates were higher in simulated switch piglets, the percent increase in heart rate in response to epinephrine was unaltered, suggesting that there was no upregulation of β-adrenoreceptor response to chronotropic actions of epinephrine. In contrast, there was a significant increase in the sensitivity to the chronotropic effects of norepinephrine in the isolated Langendorff heart from switch-operated pigs. Since norepinephrine is subject to active re-uptake in sympathetic nerve terminals to a much greater extent than epinephrine,Reference Iversen31 the most plausible explanation of these findings taken together is that the major mechanism behind the nearly doubled sensitivity to chronotropic effects of norepinephrine in switch-operated animals is a substantial reduction of active re-uptake of the norepinephrine into sympathetic nerve terminals in the heart. Unfortunately, the Langendorff preparation does not remain in optimal condition for long enough to repeat the dose–response curves to norepinephrine with a re-uptake blocker present, which could have shown if the difference in chronotropic response was removed by re-uptake blockade.
Reduced coronary flow reserve
What happens to coronary flow reserve after the arterial switch operation has been subject to conflicting clinical reports. A reduced coronary flow reserve in response to adenosine has been reported with positron-emission tomography both early and late after arterial switch,Reference Yates, Marsden and Badawi32, Reference Bengel, Hauser and Duvernoy33 whereas with intra-coronary Doppler both a normal coronary flow reserve and in contrast a failure of normal dilatation in response to adenosine have been reported.Reference Gagliardi, Adorisio, Crea, Versacci, Di Donato and Sanders20, Reference Oskarsson, Pesonen, Munkhammar, Sandström and Jögi34 However, most of these studies lack age-appropriate normal controls. Our in vitro findings of reduced maximal coronary flow rate clearly support the majority of the clinical studies that suggest a reduced coronary flow reserve after arterial switch. Our results could be explained either by denervation supersensitivity to α-receptor stimulation, or by subnormal growth of the coronary vascular bed after the surgical re-implantation. The fact that both intrinsic and maximal heart rates were higher in switch hearts would of course also affect the length of diastole where most coronary artery perfusion occurs. However, as there was no significant difference in coronary flow at baseline, this seems unlikely to be the main cause. A possible upregulation of vascular α-receptors would have to be studied on isolated strips of coronary arteries where different types of uptake blockers could be employed with and without α-blockers.
As discussed below there are several clinical studies reporting subnormal growth of coronary arteries after arterial switch. A combination of increased intrinsic heart rate, increased sensitivity to chronotropic actions of norepinephrine, and a decreased maximal coronary flow creates obvious potential for a mismatch between perfusion and energy demands.
With ordinary exercise stress tests between 4 and 6 percent of long-term survivors after arterial switch surgery show ischaemic changes,Reference Weindling, Wernovsky and Colan35–Reference von Bernuth37 but with dobutamine stress test, 17 out of 22 patients were reported to show reversible myocardial perfusion defects corresponding to segments of hypokinesia.Reference Hui, Chau, Leung, Chiu and Cheung38 In this context it is of concern that, in addition to an about 6 percent prevalence of discrete coronary lesions long-term after arterial switch,Reference Legendre, Losay and Touchot-Kone39 there have been several reports suggesting a reduced growth of coronary arteries after arterial switch surgery affecting the left coronary more than the right, and with, in particular, a very small calibre of the distal left anterior descending branch a common finding.Reference Hauser, Bengel and Kuhn21, Reference Yatsunami, Nakazawa and Kondo40 The apical parts of the left ventricle are the last to get re-innervated by sympathetic nerves after cardiac transplant.Reference Gallego-Page, Segovia, Alonso-Pulpon, Alonso-Rodriguez, Salas and Ortiz-Berrocal41 Thus, as nerve growth factor and neuropeptide Y released from sympathetic nerves stimulate angiogenesis,Reference Zukowska-Grojec, Karwatowska-Prokopczuk, Fisher and Ji18, Reference Lazarovici, Marcinkiewicz and Lelkes19 and the distal left anterior descending artery would be the last vessel to get functional re-innervation, one possible explanation for the poor growth of the left anterior descending artery is the removal of trophic actions from sympathetic nerves in early life caused by the surgical procedure.
Limitations of the study
The 6-week old piglets are obviously slightly larger than newborn humans, but physiologically newborn piglets are quite immature, more like premature human babies, and we therefore feel that the constraints of age at surgery imposed by animal welfare-rules does not invalidate the physiological model; these young piglets are still in a very rapidly growing phase, and therefore with a rapidly growing coronary vascular bed. A 100 percent survival after surgery would obviously have been preferable; however, we feel that a 70 percent survival of small piglets, in a setting where no post-operative intensive care following arterial switch surgery is possible, is very good.
Conclusions
Arterial switch correction of transposition of the great arteries induces changes in autonomic innervation of the heart that lead to heightened sensitivity to circulating catecholamines and have obvious importance for the pharmacological management in the immediate post-operative period. Furthermore, there are probable consequences for the propensity to medium- and long-term arrhythmia and for coronary artery growth, with potential for a mismatch between coronary perfusion and energy demands. Further studies of late growth of coronary artery vascular bed, and of sympathetic nerve function, late after arterial switch surgery are indicated.
Acknowledgements
The authors particularly thank Nadia Karlsson and Eva Oscarsson at the Laboratory of Experimental Biomedicine, University of Gothenburg, Sweden, for their dedicated support and Christer Ericson and Christina Löfgren from the paediatric bypass team of the Department of Cardiothoracic surgery for their skilled management of the cardiopulmonary bypass. This study was funded by grants from the Swedish Heart-Lung Foundation and a Gothenburg University LUA-ALF grant.