I. INTRODUCTION
The high-voltage vertical field effect transistor (HVVFET™) is an advanced vertical MOSFET structure that expands the operating frequencies of vertical silicon RF power MOSFETs well into the microwave spectrum. Battaglia et al. [Reference Battaglia1] describe the attributes of a 100 W device constructed using the high-voltage vertical technology. The device architecture also yields an extremely rugged device by suppressing the activation of the parasitic device that destroys other pulsed transistors. The HVVFET is rated at 20:1 voltage standing wave ratio (VSWR) with an operating voltage of 48 V. Additional device structure and layout as well as other device attributes, such as gain and efficiency, are described in this extended version of [Reference Battaglia1].
Two common methods for achieving high output power are increasing gate periphery and increasing operating supply voltage. Increasing the gate periphery for higher output power reaches a point of diminishing return because of the reduction in output impedance. High-voltage operation has several benefits:
1) transistors operating at higher voltages dissipate less heat due to lower current consumption at a given power level;
2) transistor impedances increase with higher voltage operation, making it easier to design an effective impedance matching network; and
3) higher output impedances aid wider bandwidth designs.
One key aspect of a vertical MOSFET is that the current flows vertically in the drain region, whereas, conversely, in an LDMOS structure the current flow is lateral. The vertical current flow allows the transistor cells of the device to be tightly spaced. The architecture of the HVVFET is optimized for this attribute yielding a power density approximately two times that of an equivalent lateral transistor device (e.g. LDMOS). The increased power density allows high power components to be fitted into the smallest package footprint.
Avionics and military pulsed applications have traditionally used bipolar transistors as the primary device technology because of their high power capability. Modern system requirements are demanding additional transistor performance. Electrical performance improvements in the HVVFET technology such as higher power density, increased gain, and better gain flatness offer significant benefits to power amplifier designers, and will produce higher-performance amplifiers having reduced size and weight.
This technology offers many system-level advantages. The gain of the device is at least 3 dB greater than competitor devices, which reduces the driver output power requirement by 50%. The combination of high-power packing density and smaller driver output power reduces both the size of the PCB and the heatsink and cooling requirements. The extreme ruggedness of the transistor and the inherent reliability of a silicon-based technology leads to lower field failure rates and a reduction in maintenance cost. All of the above factors improve system performance and lower total system cost.
II. VERTICAL MOSFET TECHNOLOGY
The HVVFET device is fabricated using standard silicon wafer process technologies. The performance of the device is enhanced by using a number of innovative features, which are briefly described. The high operation voltage of the device is enabled by using a vertical configuration that uses the epi thickness to determine the breakdown voltage while maintaining small cell pitch on the top device structure, thereby achieving high power density without sacrificing performance. By utilizing an innovative termination scheme, near-ideal planar breakdown voltages are achieved while using the optimal epi doping and thickness to reduce R DS(on).
As described by Golio et al. [Reference Golio2], the feedback capacitance of the device is reduced significantly by using an integrated device shield to minimize the coupling of the gate to the drain. In addition, the intrinsic and extrinsic feedback capacitance is reduced by a factor of 20 compared to similar vertical devices.
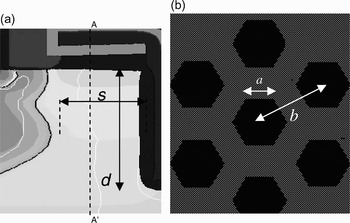
The vertical cut line A-A’ in Fig. 1 (a) monitors the extent of depletion as a function of drain bias. The parameter d is the depth and parameter s is the separation between the side trench and sidewall of the dielectric. Another example of using trench technology for high-voltage RF operation is also described in the work of Wilson [Reference Wilson3]. Figure 1 (b) shows a top view of the array of micro-cells forming a distributed transistor structure. The annular source opening enables the increase of the device perimeter in a compact manner, thereby allowing significant packing density.
(a) Schematic and (b) layout of power MOSFET with hexagonal symmetry with each cell having a length a and a pitch of b.

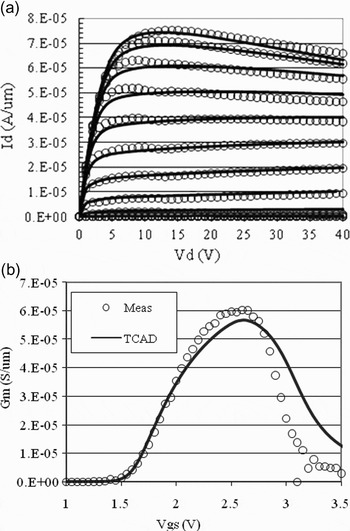
Figure 2 (a) displays the good agreement in I–V characteristics with TCAD simulations while designing the internal die structure. The negative differential resistance observed for high V gs is due to device self-heating. Figure 2 (b) shows the transconductance parameter, which enables the device to achieve a power gain of 20 dB above 1 GHz operation. Wilson states in [Reference Wilson4] the advantages of a high-voltage, vertical technology for pulsed applications.
Measured (symbol) and simulated (line) I–V characteristics at T base = 300 K; (a) I–V characteristics with V g = 1.6–3.4 V with 0.2 V steps and (b) transconductance versus gate voltage with V d = 5 V.

III. DEVICE CONFIGURATION
This single-ended high-power transistor is a first-generation HVVFET device. The discrete silicon N-channel enhancement mode transistor is implemented in common source configuration for high-power operation.
The single die is attached directly to the flange material allowing the generated heat to be quickly extracted to the heatsink for maximum thermal performance. An optimized die attach process is achieved without solder preforms. Under 200 µs pulse width and 10% duty cycle, the thermal resistance of the package part is measured at 0.54°C/W.
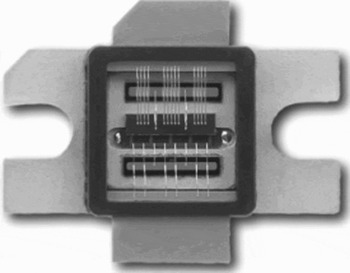
The device is housed in an RF high-power bolt-down package with an industry standard HV400 footprint as shown in Fig. 3. The package can be soldered to the heatsink or mounted with screws for optimum attach to the thermal interface.
HV400 power package.

IV. MATCHING NETWORKS
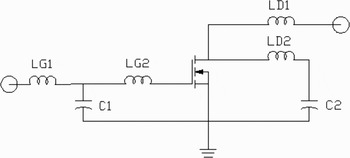
The internal matching networks within the device package transform the low impedance of the die to higher impedance at the terminal leads of the package. The matching networks are designed to achieve a minimum 15% fractional bandwidth performance at 1300 MHz. At any given power level the high drain voltage bias scheme creates higher devices impedances than similarly power rated devices biased with 28 V. The nature of the vertical device structure produces low intrinsic capacitances. The inherently low feedback and output die capacitance makes the device easy to match. In fact, only a single stage of input and output matching is required internal to the package as seen in Fig. 4. All matching is done using reliable gold wires. A single matching section of a low pass network is formed at the input with wire LG1 shunted to ground through MOS capacitor C1. The series wires LG2 connect the low-pass filter to the gate terminal of the die. The output impedance match is realized by bonding wires from the drain of the transistor to a large MOS capacitor, which acts as a DC block. Intrinsic die output capacitance is resonated with inductance LD2, which are shunted to ground. The MOS capacitor C2 in series with the shunt LD2 wires allows only RF current to flow to ground effectively presenting high impedance to low frequency and DC components of the current. The simple, single-plate MOS capacitors are easy to manufacture, low cost, and are the only additional elements internal to the package. The internal matching effectively allows the device to achieve flat gain and efficiency and the IRL response across the 200 MHz bandwidth at the high end of the L-band. The wirebond profiles are not complicated, allowing the devices to be manufactured accurately and repeatably, using automatic wirebonders. The wires are evenly spaced for uniform current distribution, preventing thermal issues such as hotspots on the die resulting from phase mismatching.
Schematic diagram of the input and output matching networks.

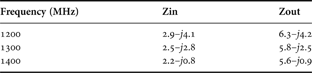
The single-ended input and output impedances achieved with the low-loss internal matching elements are listed in Table 1. External matching was accomplished through lumped elements on a PCB raising the impedance to 50 ohm.
Summary of packaged die impedances.
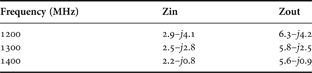
According to the datasheet in [5] similarly sized bipolar device has lower impedances than the HVVFET device. The high-power BJT device output impedance is 5.1–j3.0 ohm at 1210 MHz and 4.8–j0.9 ohm at 1400 MHz, which in both cases is nearly 1 ohm smaller on the real axis making the device more difficult to match than the HVVFET device.
V. RF PERFORMANCE CHARACTERISTICS
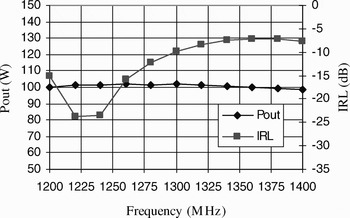
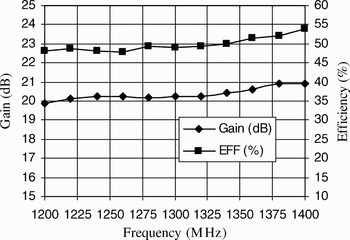
The test fixture was optimized for pulsed power performance from 1200 to 1400 MHz. At least 15% of fractional bandwidth was attained, centered at 1300 MHz. The transistor was matched not only for high power performance metrics but also for frequency response. The test circuit was tuned with microstrip lines and surface mount chip components for flat gain and efficiency across the frequency band of operation. Figures 5 and 6 show the flat response of the device over frequency.
Measured RF performance of peak output power and input return loss over frequency taken with pulsed signal conditions of 200 µs pulse width, 10% duty cycle, VDD = 48 V, Class AB bias circuit. Peak output power exceeds 100 W across the band with minimum 47% power added efficiency.

Measured RF performance of gain and efficiency versus frequency taken with pulsed signal conditions of 200 µs pulse width, 10% duty cycle, VDD = 48 V, Class AB bias circuit. Gain exceeds 20 dB and is less than 1 dB flat across 200 MHz of bandwidth.

The device achieves greater than 20 dB of gain at the P1dB compression point. At this power level the power transistor delivers greater than 50% drain efficiency. With gain as high as 20 dB the power added efficiency is essentially the same as the drain efficiency since the required input power level is so small compared to the output power as shown by Maas in [Reference Maas6].
High power design is rigorous since not only are high power performance metrics such as peak power, gain, and efficiency important but also this performance must be achieved over an entire frequency band of operation. The gain flatness is less than 1 dB and will meet the minimum system specification without having additional circuitry like automatic gain control (AGC) modules to compensate the system gain. The flat efficiency response results in constant power supply consumption. The balanced power consumption prevents any fluctuations in the power supply lines, resulting in stable performance.
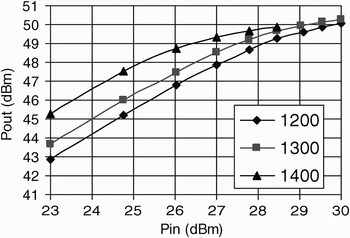
The device achieves over 100 W of peak power at 200 µs pulse width and 10% duty cycle. Figure 7 shows the performance over power drive displaying the linear range of operation and driving into the saturation region.
Output power versus input power at VDD = 48 V under pulsed conditions: 200 µs pulse width, 10% duty cycle.

One of the most challenging test conditions for any RF transistor is being able to handle load mismatches at all phases as Dye and Granberg explain in [Reference Dye and Granberg7]. Under a nominal operating voltage of 48 V at rated power, the device is able to withstand a 20:1 VSWR without exhibiting any performance degradation.
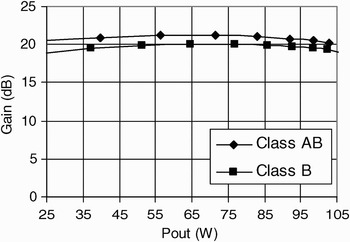
Figure 8 displays the gain which is greater than 20 dB with Class AB current bias. When biased in class B mode for high-efficiency applications the device maintains the high gain characteristic of the classical Class AB mode of operation. The advantage of the Class B design is that the high-efficiency approach draws zero current and consumes zero power when the transmitter is off. The Class AB bias scheme has higher gain but consumes DC power throughout the pulse cycle without regard to whether the RF signal is applied or not as seen in [Reference Battaglia8] by Battaglia. The HVVFET technology maintains gain above 20 dB across the band at Class B, which maximizes efficiency.
Measured gain flatness across output power at 1300 MHz with VDD = 48 V and pulse signal conditions of 200 µs pulse width, 10% duty cycle, showing Class B versus Class AB bias levels.

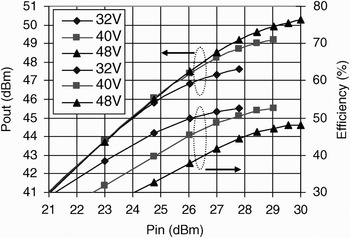
Figure 9 shows the tradeoffs of voltage bias supply and RF performance. It is clear that a lower operating voltage achieves greater efficiency at the cost of maximum output power. Some applications may require higher efficiency and are willing to sacrifice some power in order to attain the proper system specification. The device gain is not affected by variations in the drain power supply.
Measured output power at 1300 MHz, VDD = 48 V with pulse signal 200 µs pulse width and 10% duty cycle displaying Class AB performance across varying voltage supply bias.

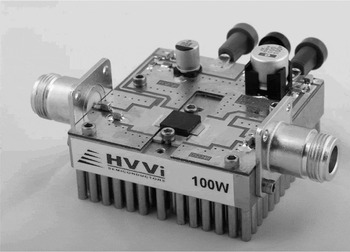
The external matching circuitry covers over 200 MHz of bandwidth in a single printed circuit board. Figure 10 shows the external input and output matching networks, which are comprised of a combination of both microstrip transmission lines and lumped elements. The power gain flatness is less than 1.0 dB across the frequency band. On the DC bias lines of both the gate and drain are large capacitors in the µF range that suppress the low-frequency components on the DC supply lines preventing stability issues. RF shunt capacitors are placed at one-quarter of a wavelength of the fundamental frequency away from the leads of the device to isolate the DC bias feed line from the RF impedance matching network. These capacitors present a null or low impedance at the fundamental frequency shunting the residual RF signal to ground with the capacitor effectively isolating the DC current. DC blocking capacitors on the RF lines isolate the bias supply from the connectors.
Picture of the test fixture matching at L-band.

The high impedance at the package leads, because of the internal matching, makes the test fixture circuit easy to match to 50 ohm. The match does not require expensive high dielectric material but uses low-cost standard dielectric material from Rogers Corporation, resulting in significant cost savings. The use of only standard values of capacitance for the piece parts (chip capacitors) for both RF match and DC bias networks results in a cost-effective solution.
VI. EXTREME RUGGEDNESS RATING
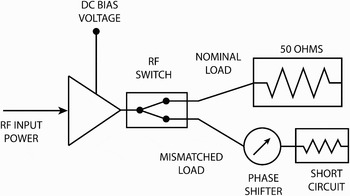
Figure 11 describes three important factors that affect the performance of an RF amplifier: the amount of RF input power, the DC voltage bias on the drain terminal, and the impedance presented to the load of the device. During operation the amplifier is biased with a DC voltage source and the RF signal is pulsed at the input of the device. The input signal is amplified and 100% of the output power is delivered to the load connected to the output of the device. Ideally the nominal load for the system consists of a length of co-axial cable and antenna with an impedance of 50 ohm. The mismatch between the actual load and the ideal load is characterized by a VSWR and results in some RF output power reflected back to the output terminal of the device. The reflected power must be absorbed in the active device area of the amplifier. Some system designers protect the amplifier by placing external output protection circuitry typically in the form of an isolator/circulator, which absorbs the excess power, protecting the semiconductor device.
Block diagram of ruggedness stress test conditions.

The HVVFET technology has been reported by Battaglia et al. in [Reference Battaglia9] to withstand an output load mismatch with VSWR = 20:1, 10% over-voltage, and 3 dB input over-drive at 1090 MHz with a pulse width of 50 µs and a 5% duty cycle. The ruggedness of this amplifier has been characterized at a higher frequency of 1400 MHz and with longer pulse width (100 µs) and duty cycle (10%) by setting all of the factors in Figure 11 above their nominal value. The amplifier was subjected to 20% of input over-drive, whereby the input power is increased until the rated output power is 20% above the nominal rating of 100 W. The amplifier was subjected to 10% over-voltage, where the voltage is increased by 10% over the rated nominal voltage bias level. The output load is mismatched by 20:1 VSWR. The 20:1 output VSWR is achieved by placing a short circuit on the output of the device. A line stretcher is used to rotate the phase of the load over an entire rotation or 360°. The drain current varies as a function of the phase of the load, which sees varying impedance values during the phase rotation. The amplifier must be able to absorb this excess amount of current in the device structure without damage to be considered rugged.
Other MOSFET technologies have a parasitic bipolar transistor inherent in the device structure. The parasitic element is not active during normal operating conditions and only activates under extreme conditions such as those induced during a ruggedness test when voltage and currents are much higher than under nominal operating conditions. The secondary breakdown occurs during ruggedness testing and activates the parasitic bipolar device. The device draws current and this current increases the temperature of the silicon, which increases hfe and thus draws more current. This positive thermal feedback leads to thermal runaway and destruction of the device. Although the HVVFET does have a parasitic npn bipolar device inherent in all other MOSFET technologies, the unique structure of the device results in the emitter and base terminals of the parasitic bipolar being electrically connected or shorted with the source metal and thermally connected via the source metal and the gold bump to the package/heat spreader. This is clearly shown in Fig. 12. This results in keeping the parasitic emitter base junction in thermal control and preventing second breakdown from occurring. This parasitic diode activates during a ruggedness test, draws current, and dissipates the heat but does not go into thermal runaway. The lack of this destructive failure mechanism in the vertical technology makes it the only technology in the world which can be rated at such a high ruggedness rating. The work of Formicone et al. has shown in [Reference Formicone10] that even with improvement techniques RF LDMOS devices are only rated at 10:1 VSWR mismatch tolerance.
Parasitic bipolar.

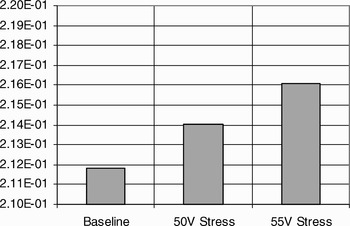
During ruggedness characterization a 100 W device is tested under nominal conditions for baseline performance data. The device is then subjected to the high stress of the ruggedness test conditions. The device is then retested under nominal parameters and a comparison is performed. The HVVFET power amplifier device was characterized with both DC and RF parameters prior to ruggedness testing. The device was then tested with nominal parameters of frequency of 1400 MHz at 120 W of output power with a 50 V drain bias supply. The device is then subjected to a ruggedness test with a 20:1 VSWR mismatch at the load. The DC supply voltage of the drain is then increased to 55 V and both the DC and RF parameters are measured. Another ruggedness stress test with VSWR = 20:1 is performed and all parameters are re-measured. If the ruggedness stress test should damage the device a shift in the DC test parameters would be expected. Figure 13 displays the channel resistance, R DS(on), of the device. An increase in R DS(on) indicates either a loss of active area due to damage or an HCI phenomenon. This parameter monitors the device and a shift in performance would indicate the device was damaged during stress testing. Figure 13 shows less than a 1% shift in DC parameters.
Comparison of the DC test parameter output resistance before and after a ruggedness stress test at two different drain voltage levels.

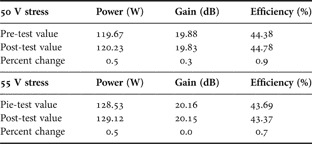
The RF performance is also unaffected as the device produces the same amount of output power with less than 1% performance shift in output power, gain, and efficiency as displayed in Table 2. Simultaneously enduring a ruggedness stress test with increased input power, voltage bias, and load mismatch with no measurable change in any DC or RF parameter ensures a long life cycle for the HVVFET transistor deployed in any high-power RF application.
Summary of RF data before and after the ruggedness stress test.

VII. FUTURE ROADMAP
The first generation of the HVVFET has drain-source breakdown voltages exceeding 100 V and performance beyond 6 GHz as seen in Fig. 14.
First-generation HVVFET frequency response.

Simulations indicate that higher performance at frequencies as high as 10 GHz and breakdown voltages exceeding 200 V is feasible with the HVVFET technology. The performance advantages achievable with future generations of HVVFETs make it a likely candidate for many high-power RF and microwave applications.
VIII. CONCLUSIONS
The HVVFET is the first new silicon high-frequency RF power transistor introduced in more than a decade. This paper described a unique approach to high-power amplifier design utilizing technological breakthroughs that result in increased RF performance and many system benefits. The first generation of this technology demonstrates state-of-the-art performance with a clear path to higher breakdown voltages to enhance performance advantages in future generations.
 Brian D. Battaglia is an applications engineer for HVVi Semiconductors, Inc. in Phoenix, Arizona. He received his BSEE and MSEE from RIT, Rochester, NY, in 1997 and 1998, respectively. Originally accepted into the Motorola Engineering Rotation Program in 1998 and has worked in the design and development of high-power RF semiconductor devices ever since.
 Dave Rice is an RF device design engineer at HVVi Semiconductors. He received his BS in electrical engineering from Arizona State University in 1999. He worked at Motorola/Freescale from 1979 to 2007.
 Phuong Le is Director of Product Development at HVVi Semiconductors Inc. He received his BSEE from UCLA in 1989. He worked at Motorola, Freescale, Spectrian, and MACOM in designing and developing high-power RF semiconductor devices.
 Bishnu Gogoi is the Director of Technology Development at HVVi Semiconductors. He received his Ph.D. in electrical engineering from the University of Michigan, Ann Arbor, in 1998. He worked in Motorola Semiconductors from 1997 to 2005 working on MEMS, Microsystem technology and CMOS integration.
 Michael Purchine is a software and test engineer for HVVi Semiconductors, Inc. in Phoenix, Arizona. He received his BSEE from Arizona State University in 1992. Michael previously was at Motorola and Freescale Semicondutor from 1983 through 2007, working in various RF semiconductor divisions as wafer fab operator, process and probe technician, device engineer, modeling engineer, and software engineer.
 Robert Davies is a prolific inventor, and a well-recognized authority in the field of device, process, and circuit design. Prior to co-founding HVVi, he was a senior technologist at Motorola and received the highest distinctions, including Dan Noble Fellow, member of the Scientific Advisory Board, and Distinguished Innovator award. A member of the IEEE for many years he received his B.S. in electrical engineering from Arizona State University and has over 80 issued patents.
 Walter Wright is a Senior RF/ Microwave PA Design Engineer with 26 years experience in RF/microwave design. He is a graduate of Virginia Polytechnic Institute and State University and has extensive experience in the Commercial, Aerospace, Avionics, and RF Power Semiconductor industries.
 Dave Lutz is Vice President of engineering for HVVi Semiconductors, Inc. in Phoenix, Arizona. He started with Motorola Semiconductor Division in 1977 as an RF power amplifier designer. After 7 years, he moved into the Operations Manager role where he introduced many new technologies developed in the fab. He has a BSEE from Arizona State University.
 Alex Elliott is a Senior Packaging Engineer with 33 years experience in semiconductor package assembly and design. During the last 13 years he has been in the role of high-power RF plastic package design and manufacturing equipment installation. Alex holds 14 issued patents in the packaging and assembly field.
 Son Tran is a Packaging and Assembly/Process Engineer at HVVi Semiconductors, Inc. He received his bachelor’s degree in mechanical engineering from San Diego State University in 1991. He has worked in the RF Division of Motorola Semiconductors from 1993 to 1998 and several other companies as a Packaging/Mechanical Engineer in his career.
 Robert Neeley is currently a Test Engineer for HVVi Semiconductor, Inc. in Phoenix, Arizona. Beginning in 2000 worked at Motorola Semiconductors in the Tempe Final Manufacturing team as part of the NPI testing and transfer of Automated CATV testers and high-power LDMOS products to production. In 2004 was part of the RF Division Application team in Tempe, Arizona, specializing in the application support and custom design of all the RFIC and high-power discrete LDMOS products worldwide.
 Will Z. Cai is a senior device technologist at HVVi Semiconductors, Inc. He received a Ph.D. in EE from the Pennsylvania State University in 2000. Prior to his current position, he held engineering and managerial positions at ON Semiconductor, Jazz Semiconductor, and RFMD. He is the coauthor of four issued patents, the sole editor of two books and many technical publications in the field of semiconductor device and process technologies.