

Introduction
Despite the growing recognition that the aging of the Canadian population poses serious policy challenges for Canada (e.g., Romanow, Reference Romanow2002), little attention has been given to the older Aboriginal population.Footnote 1 This can be explained, in part, by the fact that the Aboriginal population is much younger than the non-Aboriginal population and there are significant health challenges among the younger Aboriginal population (Coleman, Grant, & Collins, Reference Coleman, Grant and Collins2001; Kirmayer, Boothroyd, & Hodgins, Reference Kirmayer, Boothroyd and Hodgins1998; MacNeil, Reference MacNeil2008). According to the 2006 Census, the median age of the Aboriginal population was 27 years in comparison with 40 years among the non-Aboriginal population (Statistics Canada, 2009b). Further, approximately 30 per cent of the Aboriginal population are less than 15 years of age compared with only 17 per cent in the non-Aboriginal population (Statistics Canada, 2008). Despite the general youthfulness of the Aboriginal population, data from the 2001 and 2006 censuses reveal a trend towards aging within the Aboriginal population. For example, the number of Aboriginal peoples aged 65 and over increased by 40 per cent between 1996 and 2001, and 43 per cent between 2001 and 2006 (Statistics Canada, 2003a, 2008). This represents the largest population increase of all age groups during the two census periods and is much higher than the corresponding 10 and 12 per cent population increases among the non-Aboriginal population, aged 65 and older, during the same periods (Statistics Canada, 2003a, 2008).
Despite such rapid aging among the Aboriginal population, very little is known about the health status of older Aboriginal peoples (Wilson & Young, Reference Wilson and Young2008). Thus, the purpose of this research is to examine variations in health and differences in the determinants of health status and health care use between the older Aboriginal population and the non-Aboriginal population in Canada. Data for the research is taken from the 2001 Aboriginal Peoples Survey (APS) and the 2001 Canadian Community Health Survey (CCHS). The research is important because it fills a significant gap in our understanding of Aboriginal health in Canada. More importantly, by examining the health status of older Aboriginal peoples and utilization of health services now, programs and policies can be developed in anticipation of the growing demand of older Aboriginal peoples for health services that are sensitive to their particular needs.
Background: Concepts and Context
In the general population, Canadian researchers have normally accepted “aged 65 and over” as the arbitrary definition that separates the seniors population from younger cohorts. Due to the general youthfulness of the Aboriginal population, 55 years and older is often argued to be a more appropriate age cut-off to distinguish between older and younger cohorts. For the purposes of this article, we use the term older Aboriginal peoples to refer to this segment of the population except where research is literally quoted. This term, which refers to someone who is chronologically older, should not be confused with the term elder, which reflects a particular status of honour, wisdom, and respect achieved within some Aboriginal groups regardless of age (McLeod-Shabogesic, Reference McLeod-Shabogesic1998; Stiegelbauer, Reference Stiegelbauer1996; Waldram, Reference Waldram1993).
Although there is a growing scholarly literature on Aboriginal peoples (e.g., the Canadian Journal of Native Studies was started in 1981), prior to 1985 almost nothing was written about older Aboriginal peoples (Buchignani & Armstrong-Esther, Reference Buchignani and Armstrong-Esther1999). The literature on health status and utilization of health services by older Aboriginal peoples is extremely limited. We conducted a recent search of both social science and medical databases and found only nine articles published between 1995 and 2009 pertaining to the health of older Aboriginal peoples in Canada.Footnote 2 In their seminal work on Aboriginal health in Canada, Waldram, Herring, and Young (Reference Waldram, Herring and Young1995) (see also updated version Waldram, Herring, & Young, Reference Waldram, Herring and Young2006) have no explicit discussion of older Aboriginal peoples. In a search of the index of their books, terms like “aging, elders, elderly, and seniors are non-existent, and other than to note that life expectancy is improving and that some differences exist in rates of life expectancy between various age cohorts, the aging of the Aboriginal population does not receive any mention in the concluding chapter where Waldram et al. (Reference Waldram, Herring and Young1995) “review and summarize important themes and key findings … emphasizing changes in patterns of health and disease, the place of medicine within Aboriginal cultures, and the relationships between politics and health policies” (p. 259). Similarly, in A Statistical Profile of Health of First Nations in Canada (Health Canada, 2003), no explicit mention of the older Aboriginal population is made except in comparisons of various health conditions by age cohort.
The gerontology literature on older Aboriginal peoples is equally silent. Our recent search of the Canadian Journal on Aging found that out of approximately 200 papers published as research articles in either regular or supplementary issues of the journal since 2000, there has not been a single article published where the explicit focus has been on older Aboriginal peoples. To say that older Aboriginal peoples in Canada have gone completely unnoticed by the research community would be too great an over-statement. From a demographic perspective, Remillard (Reference Remillard1991) pointed out that the Aboriginal population is aging faster than the general Canadian population, but the aging of the Aboriginal population began much later. While not explicitly dealing with older Aboriginal peoples, the work by Waldram et al. (Reference Waldram, Herring and Young1995), Health Canada (2003), and Young (Reference Young2003) has emphasized that the health status literature is mainly demographically and epidemiologically based.
Similar to what can be found in the gerontology literature about the non-Aboriginal population, Collings (Reference Collings2001) discussed the critical issue of successful aging. Structured interviews with 38 Inuit led Collings to suggest that there are no perceivable differences in the ways Inuit of different age cohorts view aging. Successful old age is defined by the individual’s ability to manage declining health, and for Inuit, the most important determinants of a successful aging are “ideological”, not material. Individuals’ attitudes in later life, in particular their willingness to transmit their accumulated wisdom and knowledge to their juniors, are the critical determinants of whether an individuals is viewed as having a successful old age. In exploring aging among Métis populations, Edge and McCallum (Reference Edge and McCallum2006) provided a detailed overview of a series of national and regional gatherings held with 20 self-identified Métis seniors, elders, and healers across Canada. As the researchers noted, the gatherings stressed the importance of history, culture, and language for understanding the health, healing, and wellness needs among Métis elders.
The Canadian literature that deals with formal and informal care of older Aboriginal peoples is quite small compared with the literature focusing on caregiving in non-Aboriginal populations. That said, this topic has received some attention. Buchignani and Armstrong-Esther (Reference Buchignani and Armstrong-Esther1999 explored the informal care requirements of older Native people and the gendered implications that high levels of informal care provision have for Native caregivers. Their data came from the pan-provincial Alberta Native Seniors Study, which allowed the researchers to compare the situation of informal care between Alberta Natives and other Canadians. The results demonstrate that Native people aged 50 or older have comparatively high overall care requirements. Older Native Albertans are poor and make extensive use of some government income support programs. Extensive dependence on informal care, institutional barriers, and local service unavailability led Native seniors to under-utilize other formal programs aimed generically at the older provincial population. Native seniors are much more likely to live with kin than are other Canadians. Informal care appears equally available to older women and men, and is provided chiefly by resident daughters, sons, and spouses, and by non-resident daughters, sisters, and sons. What the results show then are differences in utilization, and yet there are also obvious parallels with the literature on the older non-Aboriginal population (e.g., the gendered nature of informal caregiving).
Indeed, as Crosato, Ward-Griffin, and Leipert (Reference Crosato, Ward-Griffin and Leipert2007) argued, caregiving may create particular challenges for Aboriginal women given their political, economic, and geographically isolated contexts. Their study of 13 Aboriginal women caregivers living in geographically isolated areas reveals the centrality of healers, family members, and the Aboriginal community (i.e., traditions, beliefs, values) in supporting caregivers.
Offering a different perspective on caregiving, Fuller-Thomson (Reference Fuller-Thomson2005) explored First Nations grandparents raising grandchildren across Canada using custom tabulations from the 1996 Census of Canada. The research shows that First Nations grandparent caregivers are more likely to be women, unmarried, and unemployed than non-Aboriginal grandparent caregivers. In addition, First Nations grandparents are more likely to be caring for a senior, or two or more children, and spend more than 30 hours on unpaid childcare than non-Aboriginal caregivers.
Culturally sensitive approaches to health have also been stressed in the literature on older Aboriginal peoples. The research by Cattarinich, Gibson, and Cave (Reference Cattarinich, Gibson and Cave2001) focuses on mental health and points to the need for culturally sensitive approaches to the assessment of the older Aboriginal population. The issue of cultural sensitivity has also been raised by Kaufert (Reference Kaufert1999) in a study of palliative care among 10 older persons from First Nations and by Hoffman-Goetz and Friedman (Reference Hoffman-Goetz and Friedman2007) in their study of perceptions of cancer information and agencies among 25 senior Aboriginal women in Ontario. Other studies have focused on perceptions of the impact of changing lifestyles on health and well-being among older Innu (Samson & Pretty, Reference Samson and Pretty2006) and perceptions of mid-life changes among older and young Mi’kmaq women (Loppie, Reference Loppie2005).
Overall, the literature on the health of older Aboriginal peoples is much smaller compared to the work being produced on the older non-Aboriginal population. Yet a limited number of studies have begun to explore some interesting topics related to successful aging and life course changes, caregiving, and culturally appropriate care among older Aboriginal populations. Many important issues, however, remain unaddressed. Specifically, we know little about the overall health status of and use of health care services by older Aboriginal peoples and how they compare to the non-Aboriginal population. This is an important avenue of investigation especially for understanding the extent to which inequalities in health exist. The remainder of this article uses a novel approach by mining data from the Aboriginal Peoples Survey (APS) and the Canadian Community Health Survey (CCHS) to compare the health status and utilization of health services between older Aboriginal peoples and older non-Aboriginal people in the rest of Canada.
Data and Methods
To explore differences in health status and the determinants of health and health care between older Aboriginal and non-Aboriginal Canadians, we used data from the Statistics Canada 2001 Aboriginal Peoples Survey (APS) and 2000/2001 Canadian Community Health Survey (CCHS (Cycle 1.1, Version 2.0).
The APS, conducted in 1991 and 2001, is a national survey of individuals living on reserves, in settlements, and off reserve who self-reported their Aboriginal identity and/or reported aboriginal ancestry (Statistics Canada, 2003b).Footnote 3 Data for the 2001 APS were collected by Statistics Canada between September 2001 and June 2002 from approximately 98,649 respondents, and included four questionnaires: (a) adult core survey; (b) Inuit supplement; (c) Métis supplement; and (d) child survey. The adult core survey was administered to all individuals aged 15 and older.
The survey contains nine thematic sections (language, mobility, education, technology, health, employment, income, justice/policing, and housing). The first three surveys contain a standard set of questions that support our comparative analysis, as we will explain.
The APS includes both ancestry and identity Aboriginal populations. For the purposes of our analysis, we included only the Aboriginal identity population and excluded those living in Arctic regions.Footnote 4 In asking individuals about Aboriginal identity, respondents were classified into three broad categories: North American Indian, Inuit, or Métis. For the purposes of this research, we combined all three categories to examine health for all older Aboriginal peoples.
The CCHS is a cross-sectional survey conducted throughout Canada every two years by Statistics Canada beginning in 2000/2001. Data were collected from approximately 130,827 respondents between September 2000 and October 2001. The survey contained questions related to physical and mental well-being, lifestyle behaviours, utilization of health care services, and access to health care. The CCHS has been designed to produce information at the provincial, territorial, and health region levels (Beland, Reference Beland2001).
We used data from the 2000/2001 CCHS to analyze health status and health care utilization for the non-Aboriginal population (Statistics Canada, 2003b). We chose CCHS 1.1 over the more recent cycle of CCHS because the data collection period matched more closely with that of the APS. Second, in CCHS, Aboriginal peoples living on reserve and in isolated regions of the northern parts of provinces and the far north were excluded in the sample design. Approximately 6,000 individuals that participated in the CCHS, however, reported Aboriginal origins. To make the comparisons between older Aboriginal peoples and the older non-Aboriginal population as transparent as possible, we excluded the individuals in CCHS who indicated Aboriginal origins.
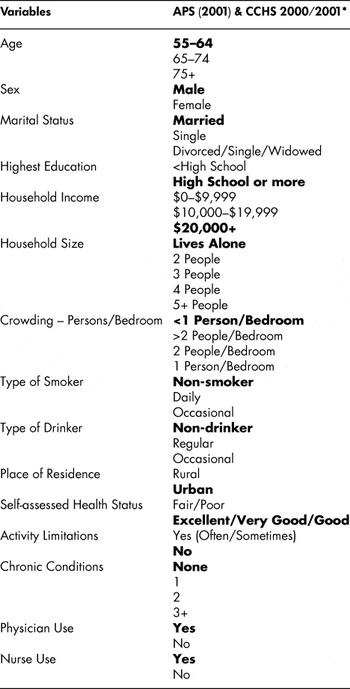
The APS and the CCHS, both administered by Statistics Canada, provided the ideal data sets for conducting this analysis. Both surveys contained a set of standard questions designed to measure health and use of health services as well as measures of lifestyle behaviour (e.g., smoking and drinking habits) and basic socio-economic measures, which are recognized as key determinants of health and health care use. In our analysis, health status was measured using three common variables (see Table 1 for a list of all variables used in the analysis). First, we used the single-item global measure in which an individual was asked to rate their health as excellent, very good, good, fair, or poor relative to others their own age. Responses were dichotomized into excellent/very good/good and fair/poor.
Common variables in Aboriginal Peoples Survey (APS) and Canadian Community Health Survey (CCHS)

* Reference category in bold
It is important to acknowledge that issues of bias in self-reports of health have been identified. For example, “state dependent reporting bias” occurs if sub-groups of the population use different thresholds when evaluating their health on a scale (Kerkhofs & Lindeboom, Reference Kerkhofs and Lindeboom1995; Lindeboom & van Doorslaer, Reference Lindeboom and van Doorslaer2004) even if they have similar levels of “true health” (Hernandez-Quevedo et al., Reference Hernández-Quevedo, Jones and Rice2004). Despite this, the single-item global measure of self-assessed health has been demonstrated to be a valid measure of health that strongly correlates with physician assessments of morbidity (Miilunpalo, Vuori, Oja, Pasanen, & Urponen, Reference Miilunpalo, Vuori, Oja, Pasanen and Urponen1997; Rohrer, Young, Sicola, & Houston, Reference Rohrer, Young, Sicola and Houston2007; Winter, Lawton, Langston, Ruckdeschel, & Sando, Reference Winter, Lawton, Langston, Ruckdeschel and Sando2007; Zhang, Rohrer, Borders, & Farrell, Reference Zhang, Rohrer, Borders and Farrell2007). More importantly, for the purposes of this article, self-rated health has been shown to be valid for use in different cultural groups including indigenous populations (Chandola & Jenkinson, Reference Chandola and Jenkinson2000; Sibthorpe, Anderson, & Cunningham, Reference Sibthorpe, Anderson and Cunningham2001).
Second, in both surveys, chronic conditions were represented by a derived variable based on one or more positive responses to a series of questions regarding physician-diagnosed long-term conditions (e.g., asthma, heart disease). This variable was reduced into four categories: None, 1, 2, and 3-or-more chronic conditions. Finally, activity limitations measured the extent to which an individual has difficulties hearing, seeing, communicating, walking, bending, learning, or doing any similar activities. Responses were categorized as yes (experiences an activity limitation often or sometimes) and no.
Both surveys also contained questions that allow for the examination of the use of conventional health care services. In the APS, individuals were asked whether or not they saw or spoke with a health professional in the past 12 months using a yes or no response. In the CCHS, individuals were asked to indicate how many times they saw or spoke with a health professional in the past 12 months. In both surveys, the list of health professionals was varied, including family doctor, eye doctor, nurse, dentist, chiropractor, physiotherapist, and so on.
Due to low frequency levels for some variables, we focused our analysis on contact with a physician or nurse. To ensure comparability, one or more visits in the CCHS were coded as yes (i.e., saw a doctor/nurse in the past 12 months) while zero visits were coded as no (i.e., did not see a doctor/nurse in the past 12 months).
Socio-demographic factors were represented by age, sex, and marital status. Since the focus of this article is on older Aboriginal and non-Aboriginal populations, and given the relatively younger profile of the Aboriginal population, we included those aged 55 and older using three age categories: 55 to 64 years, 65 to 74 years, and 75 and over to explore differences in health for young-old and old-old populations. Marital status was divided into three categories: married, divorced/separated/widowed and single (never-married). Socio-economic status was measured by highest level of education, household income, household size, and a measure of crowding. Education was categorized as a binary variable with those not completing high school forming one category and those earning a high school diploma or more forming the other. Household income was divided into three categories: $0 to $9,999, $10,000 to $19,999, and greater than $20,000. Household size was represented by five categories: lives alone, 2, 3, 4, and 5-or-more people. To create a proxy measure for crowding, we used two variables available in both surveys, number of bedrooms and household size, and divided the number of persons in the household by the total number of bedrooms. The resulting variable persons per bedroom was divided into four categories: less than 1 person/bedroom, 1 person/bedroom, 2 people/bedroom, and 3 or more people/bedroom. The interpretation of this variable is that as the ratio of people per bedroom increases, the likelihood of overcrowding increases.
Lifestyle was represented by type of smoker and type of drinker. Smoking was measured by asking participants if they smoked daily, occasionally, or not at all. Type of drinker was a derived variable in both surveys with three categories representing regular drinker, occasional drinker, and non-drinker. Variables, such as these, that measure daily smoking and social drinking are commonly used in health studies and should not be confused with problem or addictive behaviours.
Finally, we also examined the role of place of residence in determining health and use of health care services. Place of residence was measured differently in the APS and CCHS. In the APS, respondents were categorized as living in a rural, reserve, urban-Census Metropolitan Area (CMA), other urban area, or arctic area. In contrast, the CCHS was sampled on the basis of health regions throughout the country. Since the research in this article involved comparing the Aboriginal and non-Aboriginal populations, we excluded Aboriginal participants living in arctic regions due to the very low number of non-Aboriginal populations living in these areas. To ensure comparability in examining rural and urban-based populations, we divided the APS place of residence variable in two variables: rural and urban (created by combining urban-CMA and other urban area). For the CCHS data, we needed to identify health regions as being located in either an urban or rural area. We categorized a health region as urban if it covered a CMA (e.g., City of Toronto) or an urban non-CMA area (e.g., Prince Albert, Saskatchewan). Health regions located in an area that did not include a CMA or an urban non-CMA (e.g., Bas St.-Laurent) were coded as rural. The assignment of health regions as urban or rural was carried out for all 106 health regions in the CCHS.
Due to issues related to preserving anonymity, not all variables are available for use through the APS and CCHS public use microdata files (PUMF). Thus, we accessed the master data files for both surveys through Statistics Canada’s Research Data Centre at McMaster University. Although our research and analysis were based on data from Statistics Canada, the opinions expressed in this article do not represent the views of Statistics Canada in any way.
In the first stage of our analysis, cross-tabulations were conducted for the three health variables and two health care use variables by age for both the Aboriginal and non-Aboriginal population. In the second stage of the analysis, we derived three logistic regression models predicting determinants of self-reported health status, physician use, and nurse use. Logistic regression was used to estimate all the models given the dichotomous nature of the dependent variable (0,1). Note that while logistic regression allowed us to identify statistically significant associations between the dependent and independent variables, we could not comment on causality. In the logistic regressions, coefficients were estimated using the maximum likelihood method (MLM) of estimation (Aldrich & Nelson, Reference Aldrich and Nelson1984).
The independent variables (as we have described) were recoded into categorical indicator variables. One value of each variable was chosen to be the reference category. In each case, the reference category was the one least likely assumed to be associated with fair/poor health or use of a physician/nurse. For example, the youngest age category (55 to 64 years) was selected as the reference category (see Table 1).
For ease of interpretation, the results are discussed in terms of the odds ratios (OR). The odds ratio is a measure that approximates how much more likely (or unlikely) it is for the outcome (e.g., fair/poor self-assessed health), to be present among those with a given attribute relative to the reference category and controlling for all other attributes.
For all logistic regression analyses, we reported the ORs and corresponding 95 per cent Confidence Interval (CI). All analyses were weighted using the sampling weights in both surveys supplied by Statistics Canada.
Results
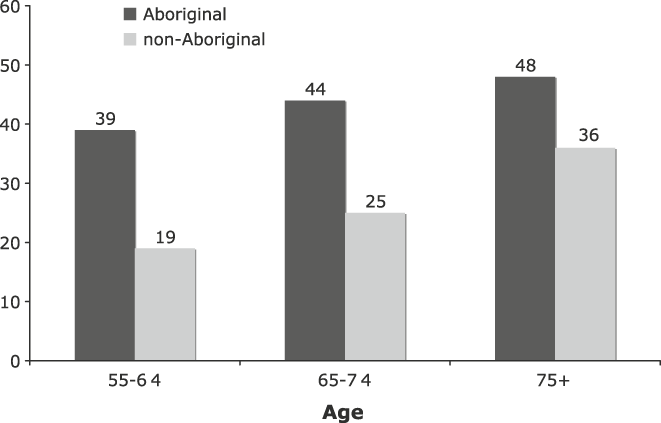
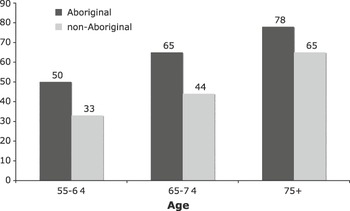
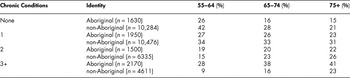
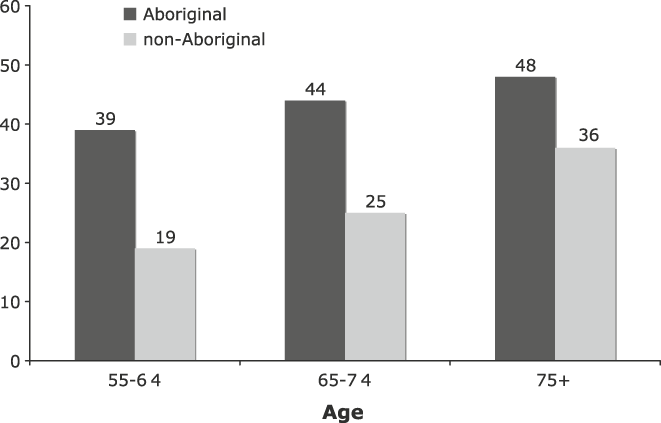
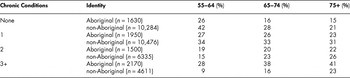
The cross-tabulations revealed interesting differences in health status between the older Aboriginal and non-Aboriginal population. With respect to self-assessed health and activity limitations, the data showed that, for both the older Aboriginal and non-Aboriginal population, as age increased the percentage reporting fair/poor health or an activity limitation also increased (see Figures 1 and 2). However, the percentage of the older Aboriginal population reporting fair/poor health or an activity limitation was higher across all three age groups. For example, among those aged 55 to 64, 50 per cent of Aboriginal people reported an activity limitation in contrast to only 33 per cent among the older non-Aboriginal population. It is, however, interesting to note that the gap in the percentage reporting fair/poor health between the older Aboriginal and non-Aboriginal population decreased as age increased. For example, slightly over two times as many older Aboriginal people, aged 55 to 64, reported fair or poor health as compared to the older non-Aboriginal population. Yet, the gap was reduced to 1.3 times as many for those aged 75 and older. In terms of chronic conditions, the results showed that for both older Aboriginal and non-Aboriginal populations, the percentage reporting no chronic conditions decreased as age increased, while the percentage reporting 3 or more chronic conditions increased as age increased (see Table 2).
Percent of the population reporting fair/poor health status by age*
*χ significant p < .001 – refers to differences among age groups within each population
Percent of the population reporting an activity limitation by age*
*χ significant p < .001 – refers to differences among age groups within each population

Percent of the aboriginal and non-Aboriginal populations reporting chronic conditions by age groupsFootnote *
* χ significant p < .001 – refers to differences among age groups within each population.
Similar to the results for self-assessed health status and activity limitations, the percentage of the older Aboriginal population reporting multiple chronic conditions (i.e., 3 or more) across all age groups was much higher than the percentage in the older non-Aboriginal population. For example, among those aged 55 to 64, 7 per cent of the Aboriginal population reported three or more chronic conditions as compared with 2 per cent in the non-Aboriginal population. Again, the data demonstrated that the gap in health status between the older Aboriginal and non-Aboriginal population appeared to decrease as age increased. Specifically, 3.5 times as many older Aboriginal people, aged 55 to 64, reported three or more chronic conditions as compared to the non-Aboriginal population, yet this figure was reduced to 1.8 times for the population aged 75 and over.
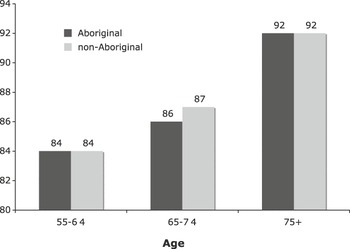
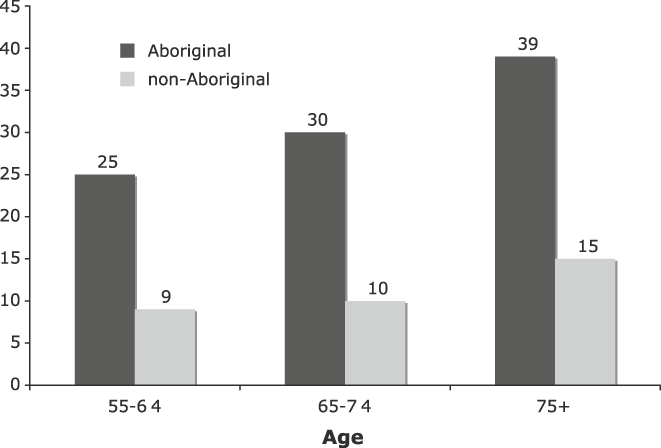
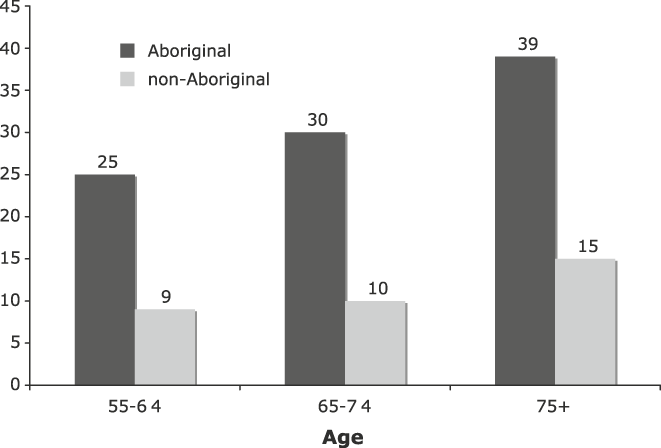
In examining use of physician services over the past 12 months, the results showed that among both populations the percentage of the population reporting use increased with age but revealed no differences in the percentage reporting use between the older Aboriginal and non-Aboriginal population (see Figure 3). In contrast, there were clear differences in nurse use in the previous 12 months (see Figure 4). In particular, a much higher percentage of the older Aboriginal population, across all age cohorts, reported use. For example, 30 per cent of the Aboriginal population aged 65 to 74 had seen a nurse in contrast with only 10 per cent of the non-Aboriginal population. The data did, however, show a narrowing in the percentage differences as age increased. All of the relationships discussed in this descriptive analysis were statistically significant when tested using chi-square tests.
Use of physician services in the past 12 months*
*χ significant p < .001 – refers to differences among age groups within each population

Use of nurse services in the past 12 months*
*χ significant p < .001 – refers to differences among age groups within each population
Having explored how health status and health care use differed between the older Aboriginal and non-Aboriginal population, we now turn to examine the extent to which differences in the determinants of health status and health care use existed between these two populations using logistic regression.
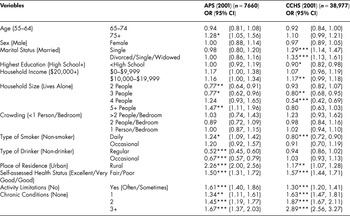
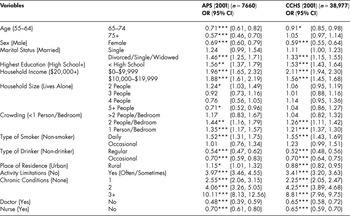
In the model of self-assessed health status, striking similarities in the determinants of health between both populations are clear (see Table 3). For example, both older Aboriginal and non-Aboriginal women were less likely to report fair/poor health than their male counterparts, whereas divorced/separated/widowed individuals were more likely to report fair/poor health than married respondents. In addition, having less than a high school education, lower levels of household income, smoking daily, and having an activity limitation were associated with increased odds of reporting fair/poor health. On the other hand, for both older Aboriginal and non-Aboriginal populations, regular and occasional drinking and no contact with a physician or nurse were associated with lower odds of reporting fair/poor health than non-drinkers and those who have had contact with a physician/nurse. For both populations, the odds of reporting fair/poor health were higher among those in homes with 1 or 2 people per bedroom as compared to those with less than 1 person/bedroom (but the odds ratios were higher among the older Aboriginal population).
Determinants of fair/poor self-assessed health status
***p < .001, **p < .01, *p < .05
That said, interesting differences arose between both populations. Specifically, household size only showed statistically significant relationships to health status within the Aboriginal population. Further, the effect of place of residence on health status was the opposite in both populations. Older Aboriginal people living in a rural area were 1.15 times more likely to report fair/poor health than their counterparts living in an urban area, while older non-Aboriginal people living in a rural area were less likely to report fair/poor health than those living in urban areas. Finally, it is interesting to note the larger effects for three or more chronic conditions among the Aboriginal population – older Aboriginal people with three or more chronic conditions were over 10 times more likely to report fair/poor health than those who had no chronic conditions as compared with an odds ratio of 8.8 reporting fair/poor health among the older non-Aboriginal population.
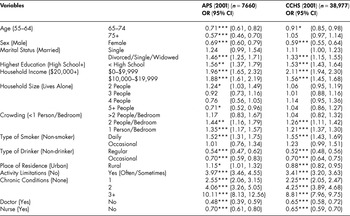
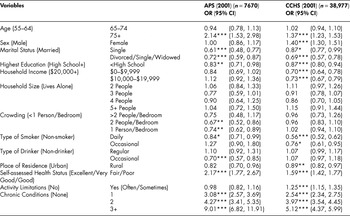
The models for physician and nurse use revealed more differences between the two populations than did the previous model predicting self-assessed health status (see Tables 4 and 5). Specifically, household income was a significant determinant of physician use among older non-Aboriginal people, showing that lower income levels were associated with lower odds of physician use, but not for the Aboriginal population. Place of residence was also a significant determinant of physician use for older non-Aboriginal people, with those living in rural areas being less likely to have visited a physician, but not for the Aboriginal population. Interestingly, older non-Aboriginal people with an activity limitation were 1.25 times more likely to visit a physician than those who did not have activity limitations.
Determinants of physician use
***p < .001, **p < .01, *p < .05
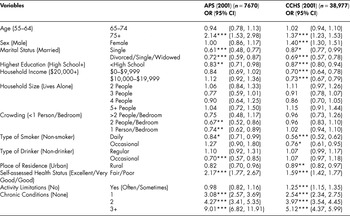
Determinants of nurse use

***p < .001, **p < .01, *p < .05
The odds ratio, while not significant for the older Aboriginal population, showed the opposite relationship. The crowding measure was only significant for the Aboriginal population showing that individuals living in households with 1 or 2 people/bedroom were less likely to visit a physician than those with less than 1 person/bedroom. While drinking status was not a significant determinant of physician use among the non-Aboriginal population, older Aboriginal people who drank occasionally were less likely to contact a physician than non-drinkers.
It is also interesting to note the different health effects on physician use between the two populations. In both populations, reporting fair/poor and chronic conditions was associated with higher odds of reporting physician use than excellent/very good/good self-reported health and no chronic conditions. However, the odds ratios were much higher in the Aboriginal population. For example, the odds ratios among the Aboriginal population reporting fair/poor and three or more chronic conditions were 2.17 and 9.01 respectively compared with 1.59 and 5.12 in the older non-Aboriginal population.
The model exploring determinants of nurse use revealed that although Aboriginal people aged 75 and older were 1.3 times more likely to have contacted a nurse than those aged 55 to 64, age was not a significant determinant within the non-Aboriginal population. Household income was a significant determinant of use for the non-Aboriginal population earning $10,000 to $19,999 but not for the Aboriginal population. Drinking was only significant within the older Aboriginal population showing that regular and occasional drinkers were less likely to contact a nurse than non-drinkers.
The effect of smoking status on nurse use also differed between the two populations. Daily Aboriginal smokers were 1.24 times more likely to report contact with a nurse while daily non-Aboriginal smokers were less likely than non-smokers to contact a nurse. While the odds for place of residence were similar, revealing that older Aboriginal and non-Aboriginal people living in rural areas were more likely to contact a nurse than those living in urban areas, the odds for the older Aboriginal population were higher. It was also interesting to observe that, whereas the odds ratios for activity limitations were higher for the Aboriginal population (1.61 vs. 1.30), the odds for chronic conditions were higher among the non-Aboriginal population. For example, among older non-Aboriginal people, those who reported three or more chronic conditions were 2.89 times more likely to contact a nurse than those reporting no chronic conditions in comparison with 1.67 for the Aboriginal population.
Discussion and Conclusions
Using data from the 2001 APS and 2000/2001 CCHS, we were able to conduct a comparative examination of health status and the determinants of health and health care use between the older Aboriginal and non-Aboriginal population. Before discussing the findings, four limitations deserve mention.
First, the research represents a snapshot in time of older Aboriginal peoples’ health. This made it difficult to explore the health of the Aboriginal population as they age and to make predictions about the health of older Aboriginal peoples into the future. Although the Assembly of First Nations in Canada has launched a longitudinal survey of health, the survey only covers health issues for First Nations individuals living in First Nations communities (Assembly of First Nations, 2009). Accordingly, it excludes Inuit and Métis populations along with First Nations people who live off-reserve (i.e., in rural or urban settings).
Second, the survey data used in the analyses is now 10 years old. As we explained, although there are more recent versions of the CCHS and APS, we chose the 2001 surveys because they captured data collected at the same point in the time. Furthermore, this article is part of a larger project aimed at understanding the health of older Aboriginal peoples. The 2001 APS is used for the larger project because it, unlike the more recent 2006 APS, does not exclude the on-reserve Aboriginal population, thereby allowing us to compare differences in health between older Aboriginal peoples living on and off-reserve.
Third, cross-sectional surveys such as the APS and CCHS are limited by response rates and recall bias (Cleary & Jette, Reference Cleary and Jette1984). Nevertheless, they are important sources of data. The 2001 APS is the only survey in Canada that specifically collects health information for all Aboriginal peoples, and the CCHS is a comprehensive health survey collecting health information for Canadian residents. They are among the only surveys available that contain common questions that allow for exploring differences in health status and health care use between older Aboriginal peoples and the older non-Aboriginal population. Even with the non-participation of some bands (especially in Québec), Statistics Canada has been especially careful to ensure that the data are representative of the Aboriginal peoples of Canada (see the Statistics Canada, 2003a, Aboriginal Peoples Survey 2001: Concepts and Methods Guide for the various strategies employed by Statistics Canada to ensure data quality).
Fourth, the Aboriginal population is highly diverse, and the picture of health and aging may vary among different segments of the population. Thus, comparison of health among different groups of the older Aboriginal population is an important avenue of future investigation (e.g., on vs. off-reserve; First Nations vs. Inuit vs. Métis; among the various Nations).
Despite the limitations, the results reveal some very interesting findings. First, as expected, within both populations, older cohorts are unhealthier (e.g., fair/poor health status, activity limitations, multiple chronic conditions) than younger cohorts. Second, in general, the older Aboriginal population appears to be unhealthier than the non-Aboriginal population across all age groups. Third, differences in health status appear to converge in the oldest Aboriginal and non-Aboriginal age cohorts. This latter finding may be due to the fact that the Aboriginal population experiences poorer levels of health (e.g., multiple chronic conditions) at a much younger age (and thus, for longer periods of time), but as the non-Aboriginal population begins to age, their health status becomes increasingly similar to older Aboriginal peoples because chronic health problems become more common in both populations. Equally intriguing is the possibility that Aboriginal peoples who survive into old age are more like non-Aboriginal people who survive into old age in terms of the choices they have made and the conditions under which they have lived in their earlier years. These two hypotheses have the potential to be tested only when longitudinal surveys (e.g., the Canadian Longitudinal Survey of Aging) become available in the coming years.
In terms of health care use, although both older Aboriginal and non-Aboriginal people reported similar levels of physician use, the older Aboriginal population appeared to have a higher reliance on nurses across all age groups. Again, there are two possible hypotheses that deserve future consideration. The first is that Aboriginal peoples are more likely to see nurses for health issues because possibly they are more likely to use community and walk-in clinics in urban places or because those who live in non-urban places lack access to physicians and are more likely to have access only to a nurse on a regular basis. Unfortunately, the APS, unlike the CCHS, does not contain questions that support analysis of access to health care (e.g., whether or not an individual has a regular physician, or whether an individual has unmet health care needs). A second hypothesis is that even though the older non-Aboriginal population often sees nurses when they see physicians, they are more likely to consider only the physician contact as part of their appointment, thereby under-reporting their use of nurses.
The logistic regression models revealed striking similarities in the determinants of self-reported health, and physician and nurse use between older Aboriginal and non-Aboriginal people. Some notable differences, however, can also be observed. In particular, household income is a significant determinant of physician and nurse use among older non-Aboriginal people but not Aboriginal peoples. While older non-Aboriginal people are covered for basic costs by their provincial health insurance plans, a growing issue for many older non-Aboriginal peoples is the indirect costs of health care (Romanow, Reference Romanow2002), which may nor may not be covered depending on provincial legislation, or they may be only partially covered (e.g., the conditions and coverage of provincial drug plans vary considerably from province to province). For the older Aboriginal population, many of whom are covered by the federal government through the First Nations and Inuit Health Branch, indirect costs might not be a significant issue, but both hypotheses (i.e., for older Aboriginal and non-Aboriginal people) need more investigation than can be done within the scope of this article.
Household size and crowding are significant determinants of health and nurse use respectively in the Aboriginal population but not in the non-Aboriginal population. Poor housing conditions are well documented among Aboriginal populations (Peters and Robillard, Reference Peters and Robillard2009; Walker, Reference Walker2008), and thus it should come as no surprise that household size and crowding appear in the models for older Aboriginal peoples. The high rates of home ownership and home care likely mediate any effects that household size and the lack of crowding have on older non-Aboriginal people. It should also be noted that by definition neither survey captures homelessness, and this is likely a more sensitive marker for housing stress, especially among both groups. In the older Aboriginal population, living in a rural area is associated with the increased likelihood of poor health status in contrast to the older non-Aboriginal population where the opposite is true. A plausible explanation is that rural life for older Aboriginal peoples is often associated with the disappearance of traditional lifestyles and culture in conjunction with a life of poverty, while rural life for the older non-Aboriginal population is associated with outdoor manual labour such as farming, fishing, and forestry, and a healthier lifestyle. Obviously, both sides of the explanation merit consideration and deserve in-depth research independently and together.
Although chronic conditions are a significant determinant of physician and nurse use in both populations, the effect of chronic conditions on nurse use is much stronger for older non-Aboriginal people while the effect on physician use is much stronger for older Aboriginal peoples. Previously, we suggested that older non-Aboriginal people might discount their use of nurses when seeing physicians in contrast to older Aboriginal peoples who might see nurses more regularly for everyday health issues because they do not have access to physicians. We can only speculate as to why the links between chronic conditions and health service use might seem to contradict our earlier suggestion, but above a certain number of chronic conditions, again there might be two different processes occurring. For the older non-Aboriginal population, we might be picking up those older persons who are most likely to use home care, and thus odds effects are stronger for the use of nurses compared to the odds effects for older Aboriginal peoples. In contrast, the lack of, for example, home care services for older Aboriginal peoples might amplify the relative likelihood of physician use by those with multiple chronic conditions compared to older non-Aboriginal people.
Finally, it should be noted that with many of these speculations, we are limited because the two surveys do not necessarily ask the questions needed to test some of the hypotheses suggested in a comparative framework. For example, we do not know the severity of the chronic conditions, and in the case of the APS there are no questions concerning home care.
To date, extensive information on the health status and utilization of health services of older Aboriginal peoples remains undocumented. Further, little is known about relative differences in health status and utilization of health services between older Aboriginal and non-Aboriginal persons. By examining differences in health and health care use between these two populations, this research fills key gaps in both Aboriginal health and seniors’ health research. It also raises as many questions as it answers. In particular, we suspect that many of the differences in health status and determinants of health and health care use observed in this research are directly linked to overall differences in the life experiences of older Aboriginal and non-Aboriginal people (e.g., residential school system and other government policies aimed at the cultural assimilation of Aboriginal peoples, dispossession from land and traditional territories, etc.; [Royal Commission on Aboriginal Peoples, 1996]). Such different life experiences have resulted in what Reading and Elias (Reference Reading and Elias1999) identified as a unique set of social determinants of health among older Aboriginal peoples. We have suggested a number of avenues for future research on the health and utilization of health services by older Aboriginal peoples. Certainly, there is a need for further research that situates the social determinants of older Aboriginal peoples’ health in the context of historical influences and their impacts (Reading & Elias). These are aspects not captured in the current surveys but which are clearly very important in terms of their influence on health status, as well as patterns of access to health care services. Our research is limited by the constraints imposed by the structure of APS and CCHS and the comparative framework we have constructed to contrast older Aboriginal and non-Aboriginal populations. However, as a starting point, this research is important because without expanding our current knowledge of older Aboriginal peoples, there will be little room for shaping health policy and thereby developing services sensitive to the needs of older Aboriginal peoples as their numbers increase in the coming decades.