Increasing milk production has been related to a decline in the reproductive performance of dairy cows (Royal et al. Reference Royal, Darwash, Flint, Webb, Woolliams and Lamming2000; Buckley et al. Reference Buckley, O'Sullivan, Mee, Evans and Dillon2003). Physiological adaptations to high milk production explain part of this decline. For the majority of lactating dairy cows dry matter intake immediately post partum is insufficient to meet the demands of milk production. Cows mobilize body tissue and lose body weight to cover the requirement for energy related to milk production. This status in early lactation, known as negative energy balance (NEB), is associated with alterations in metabolism and concentrations of a range of metabolites and metabolic hormones which affect cows' ovarian function (Diskin et al. Reference Diskin, Mackey, Roche and Sreenan2003). Commencement of luteal activity post partum is related to the extent and duration of NEB after calving, ovarian cyclicity post partum resuming mostly after the nadir of NEB (Canfield & Butler, Reference Canfield and Butler1991; Beam & Butler, Reference Beam and Butler1999). In a large proportion of lactating cows the complex endocrine signalling between the hypothalamic-pituitary axis and the ovaries is disturbed; Opsomer et al. (Reference Opsomer, Coryn, Deluyker and de Kruif1998) found that 49% of lactating dairy cows had ovarian disorders during the pre-service post-partum period. Royal et al. (Reference Royal, Darwash, Flint, Webb, Woolliams and Lamming2000) observed an association between an increase in atypical patterns in milk progesterone profiles and a rapid decline in fertility. NEB during the first 3–4 weeks of lactation further exerts carry-over effects on fertility during the insemination period (Butler & Smith, Reference Butler and Smith1989; Patton et al. Reference Patton, Kenny, McNamara, Mee, O'Mara, Diskin and Murphy2007). Recent results indicate that the typical metabolic changes that can be found in the serum of high-yielding dairy cows shortly post partum, are reflected in the follicular fluid and, therefore, may affect the quality of both the oocyte and the granulosa cells (Leroy et al. Reference Leroy, Vanholder, Delanghe, Opsomer, Van Soom, Bols, Dewulf and de Kruif2004).
Despite much study, debate continues regarding the influence of management and production on the frequency and character of ovarian disturbances and consequent conception rates in dairy cows. Some studies have shown that dairy cows in farms with high milk production and good management can have a better reproductive performance than in farms with lower production and poorer management (Nebel & McGilliard, Reference Nebel and McGilliard1993; Windig et al. Reference Windig, Calus and Veerkamp2005).
The present study had the following objectives: to examine the metabolic and energy status of dairy cows during the post-partum period; to characterise the ovarian function of dairy cows; and to study the influence of ovarian dysfunctions on subsequent fertility performance in two situations with different management and milk production levels.
Materials and Methods
The study was carried out on two Estonian commercial dairy farms (farm H having about 250 and farm L over 500 dairy cows) where Estonian Holstein dairy cows were housed in tie-stall barns. On farm H all cows were kept in one cow barn, farm L consisted of seven cow barns in the same location. The cows were milked twice a day and the average 305-d milk yields were 7977 kg on farm H and 6353 kg on farm L. The ration consisted of haylage, corn meal, rapeseed cake and high-moisture barley on farm H and haylage and compound feed on farm L. Both rations were supplemented with minerals and water was available ad libitum. On farm H cows received on average 245 MJ metabolizable energy (ME) and 2400 g digestible protein a day and on farm L 183 MJ ME and 2300 g digestible protein a day. The management practice on both farms was to start insemination of cows not <50 d after calving. On farm H a single trained herdsman observed the herd twice daily (9.00 and 17.00) for signs of oestrus, including normal and abnormal vulval discharge, and the data were recorded. On farm L oestrus detection was performed before and after milking by the milker. On both farms experienced veterinarians carried out artificial insemination. Cows detected in oestrus in the morning were artificially inseminated in the afternoon; cows detected in oestrus in the afternoon were inseminated in the morning of the following day.
Data were collected from farms H and L for 4 and 2 consecutive years, respectively. On both farms up to 20 cows in their second to eighth lactation (mean 3·5) were investigated each year. On farm H the number of cows involved in the final data analysis was 54 and the number of lactations investigated was 71 (11 cows in 2 and 3 cows in 3 consecutive years). On farm L 39 cows were investigated. Seasonal effects were minimized as only dairy cows that had calved during the housed period, from December to March, were included in the study. The relative breeding values for milk production were similar on both farms ranging from 65 to 99 points and from 69 to 98 points (with mean values 81·2 in both farms) respectively on farms H and L.
Energy balance was assessed by indirect methods appropriate for farm conditions such as milk composition, body condition score (BCS) and blood metabolites. BCS, on a 5-point scale according to the chart of Edmonson et al. (Reference Edmonson, Lean, Weaver, Farver and Webster1989), was estimated on both farms about 3 weeks before calving, and thereafter after every 10 d on farm H, and every fortnight on farm L, by two assessors. The evaluators had trained together before and during the study period. Milk yield was recorded and milk composition was analysed to determine milk fat and protein content twice a month in the milk laboratory of the Estonian Animal Recording Centre using the analyser System 4000 (Foss Electric A/S, Hillerød, Denmark).
Blood samples were obtained from the coccygeal vein or artery using 10-ml plain Vacutainer® tubes (Becton, Dickinson and Company, Franklin Lakes NJ, USA) during four periods: 1–14 d before calving and 1–14, 28–42, and 63–77 d after calving. Blood samples were kept at room temperature during transportation. After centrifugation the serum was stored at 1–4°C and analysed within 2 d. Concentrations of ketone bodies, non-esterified fatty acids (NEFA), cholesterol and aspartate aminotransferase (AST) activity were measured spectrophotometrically. NEFA concentration was determined using the method described by Lutskii et al. (Reference Lutskii, Žarov, Šiškov and Šiškov1978). Concentrations of ketone bodies were determined using the Trubka method (Trubka, Reference Trubka and Kjaune1974) and total cholesterol concentration was determined by the method described by Siedel et al. (Reference Siedel, Rollinger, Röschlau, Ziegenhorn and Bergmeyer1985). AST activity was determined using an enzymic u.v. kinetic method and commercial test kits (Human Gesellschaft für Biochemica und Diagonostica GmbH, Wiesbaden, Germany). The CV of the analytical methods (ketone bodies 18·9%, NEFA 24·2%, AST 6·5% and total cholesterol 5·7%) was below 25%, the acceptable limit in clinical chemistry according to Lumsden (Reference Lumsden2000).
For the determination of progesterone (P4), from approximately 1 week after calving, pooled quarter milk samples were obtained thrice a week not later than 1 h after the morning milking. Milk was placed in plastic tubes containing potassium dichromate as a preservative, stored at 4°C for 1 week and frozen at −18°C until subsequent analysis. P4 concentrations were measured using enzyme immunoassay (Waldmann, Reference Waldmann1993). The specificity of the monoclonal antibody and this assay has been described previously (Waldmann, Reference Waldmann1999). The inter-assay and intra-assay CV was <10%. The sensitivity limit, using a 20-μl sample was <0·5 ng/ml. Cows were categorized into four groups according to their milk progesterone profile using the criteria described by Opsomer et al. (Reference Opsomer, Gröhn, Hertl, Coryn, Deluyker and de Kruif2000). Milk P4⩾5 ng/ml was considered a valid indicator of luteal activity. Cows were categorized as normal if the interval between calving and the onset of first luteal activity was up to 50 d, followed by regular cyclicity. If the interval between calving and the onset of first luteal activity was >50 d, the cows were categorized as having delayed resumption of ovarian cyclicity (DC). Cows with a prolonged interluteal interval (P4<5 ng/ml) with a duration of 14 d or more between two adjacent luteal phases were categorized as having cessation of luteal activity (CC). Cows whose P4 levels remained elevated for ⩾20 d without preceding insemination were categorized as having prolonged luteal phase (PLP).
All the statistical analyses of the data were implemented with SAS statistical software system version 9.1. Values are expressed as mean±sem. The incidences of different types of ovarian cycles post partum during the pre-service period were expressed as percentages. Associations between parameters were analysed by correlation analysis. To test the differences of milk production traits, blood metabolites, BCS and fertility parameters between the two farms and also fertility parameters between the farms within P4 groups (normal and DC) the following model was used:

where y ij is the observed value of studied parameter, μ is the model intercept, F i is the effect of farm (i=1, 2), b is the regression coefficient and P ij is the corresponding parity, e ij is the model error. The coherence of values measured on the same cow in different lactations was considered with the compound symmetrically structured error covariance matrix. Data for blood serum concentrations of ketone bodies, total cholesterol, AST and NEFA, also days to the first P4 rise, interval between calving and the onset of first luteal activity, interval between calving and the first service and days open were log-transformed prior to testing. Length of service period and number of services per conception were modelled with the Poisson generalized linear model and first service conception rate with the binomial generalized linear model. In the first service conception rate analysis only cows inseminated at the P4<5 ng/ml were involved. A P value of <0·05 was considered significant and <0·1 a trend.
Results and Discussion
During the first month of lactation there was no difference in milk yield between the farms (Table 1) but on farm L a higher milk fat content led to a milk fat/protein ratio of 1·65. This was above the critical level indicating energy deficit according to Heuer et al. (Reference Heuer, Schukken and Dobbelaar1999). This suggestion was supported by more pronounced body condition loss during the first month after calving in cows on farm L: BCS decreased during the 40 d after calving in cows on farm H by 0·5±0·04 and on farm L by 0·9±0·08 BCS units (P<0·01). However, reduced BCS loss continued thereafter and by day 100 cows on farm H had lost 0·9±0·04, and on farm L 1·15±0·08 BCS units (P<0·01). There was no difference between the farms in the average BCS at 10–20 d before calving (3·5±0·05 on farm L and 3·6±0·09 on farm H). However, the distribution of cows by BCS near calving differed: on farm H 76% of cows and on farm L only 44% of cows investigated had BCS of 3·25–3·75, the range traditionally recommended at calving (Edmonson et al. Reference Edmonson, Lean, Weaver, Farver and Webster1989). At the same time the ratio of over-conditioned cows (BCS⩾4·0) was 28% on farm L and 16% on farm H. It is recognized that cows over-conditioned at calving tend to have a greater depression in feed intake in the period immediately pre-calving (Hayirli et al. Reference Hayirli, Grummer, Nordheim and Crump2002) and also a slower increase in dry matter intake and more pronounced BCS loss in the first weeks of lactation compared with cows in lower condition (Garnsworthy, Reference Garnsworthy, Garnsworthy and Wiseman2006).
Milk yield and milk components during the first three months after parturition on farms H and L. Values are means±sem

† Values marked with different superscripts between the farms within the same row are different (ab: P<0·01).
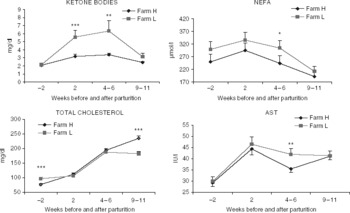
Serum NEFA and ketone body concentrations are both indirect measures of the magnitude and adaptation to NEB (Herdt, Reference Herdt2000; LeBlanc, Reference LeBlanc, Navetat and Schelcher2006). An increased NEFA level during the first 2 weeks of lactation on both farms reflected intense body fat mobilization. Blood ketone bodies were higher in cows on farm L up to week 2 and in weeks 4–6 after calving compared with farm H (P<0·05). During these periods on farm L 33%, and on farm H 10%, of ketone body concentrations exceeded the upper reference level of hyperketonaemia established for the method we used (>6 mg/dl). On farm L the cumulative incidence of cows with hyperketonaemia at 11 weeks was 54%, and on farm H 16%. The increased milk fat percentage and fat/protein ratio, decline in BCS and increased concentrations of ketone bodies, led us to the suggestion that cows on farm L had a greater energy deficiency during the first month after calving than cows on farm H.
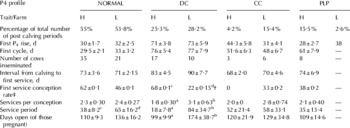
Despite differences in energy balance there was no significant variation in the commencement of luteal activity post partum, on farm H 40·8±2·57 d and on farm L 43·7±3·71 d but on both farms the period was somewhat longer than reported in several other studies (Butler & Smith, Reference Butler and Smith1989; Opsomer et al. Reference Opsomer, Gröhn, Hertl, Coryn, Deluyker and de Kruif2000; Royal et al. Reference Royal, Darwash, Flint, Webb, Woolliams and Lamming2000; Mann et al. Reference Mann, Mann, Blache and Webb2005). Categorizing cows by milk P4 profiles revealed that on both farms >50% of the cows investigated had normal resumption of ovarian activity post partum (Table 2), this outcome being in accordance with results reported by Opsomer et al. (Reference Opsomer, Coryn, Deluyker and de Kruif1998). The most prevalent abnormal P4 profile on both farms was delayed first ovulation which occurred in 25% of cows on farm H and in 28% of cows on farm L. Prolonged luteal activity and cessation of luteal activity accounted for one-third of atypical ovarian patterns on farm H and L respectively. Deep NEB is considered a major risk factor for the occurrence of delayed cyclicity (Beam & Butler, Reference Beam and Butler1999; Opsomer et al. Reference Opsomer, Gröhn, Hertl, Coryn, Deluyker and de Kruif2000). This is consistent with our results, all trial cows losing less than one BCS unit during the 40 d after calving recorded 38·6±2·18 d, and cows losing one BCS unit or more 50·6±4·83 d, prior to resumption of luteal activity (P<0·05). Butler & Smith (Reference Butler and Smith1989) showed that cows losing 0·5–1·0 BCS unit between calving and first service had a mean conception rate of 53% compared with only 17% for cows losing >1·0 BCS unit. Since the correlation between the BCS decline 40 d after calving and the period of resumption of luteal activity was weaker on farm H (r=0·158, P<0·1) than on farm L (r=0·465, P<0·05) we suggest that several other risk factors such as winter season and tie-stall barn (Opsomer et al. Reference Opsomer, Gröhn, Hertl, Coryn, Deluyker and de Kruif2000) might also have contributed to the extent of the delay on both farms. According to Beam & Butler (Reference Beam and Butler1999) a delayed energy balance nadir, even in situations of relatively modest energy deficits, such as in herd H, would probably result in low LH pulse frequency, low production of oestradiol, ovulation failure and atresia of the dominant follicle.
Comparison of fertility parameters of farms H and L inside normal, delayed resumption of ovarian cyclicity (DC), cessation of luteal activity (CC) and prolonged luteal phase (PLP) P4 profile category groups. Values are means±sem

† Values marked with different superscripts between the farms within P4 category groups and within the same row are different (ab: P<0·05; cd: P<0·1).
‡ For first service conception rate analyses cows inseminated at P4⩾5 ng/ml were eliminated.
While comparing fertility parameters of different P4 categories between the two farms it is also essential to note that on farm L, for 16% of cows the first insemination was carried out in the luteal phase compared with only 3% on farm H. With accurate oestrus detection fewer than 10% of cows bred should have a high milk progesterone level (Reimers, Reference Reimers, Smith and Newman1985). Both factors; poor expression of oestrus and lack of milkers' skills in detecting oestrus, might contribute. Thus first service conception rate was calculated only for cows inseminated at the low-P4 period (Table 2). On farm H delayed first ovulation did not impair subsequent fertility performance; cows maintained high first service conception rate and other fertility parameters. This result is in accordance with those of Horan et al. (Reference Horan, Mee, O'Connor, Rath and Dillon2005), who also showed that post-partum progesterone profiles did not differ between cows pregnant and not pregnant from first service. Comparison of the dynamics of BCS of the different P4 categories revealed no differences on farm H (Samarütel et al. Reference Samarütel, Ling, Waldmann, Jaakson, Kaart and Leesmäe2008), while on farm L the DC category cows had lower BCS values from day 10 to day 90 after calving compared with normal cows (P<0·01). Cows lost more BCS (1·2 units) during the 40 d after calving than normal resumption cows (0·75 units; P<0·05).
Based on values for ketone bodies and NEFA we suggest that on both farms the NEB started to improve by the second month of lactation, resulting in initiation of luteal activity, but the NEB nadir was lower on farm L. This probably led to reduced conception rates. Recently studies have started to focus on the detrimental effect of deep NEB on oocyte, and subsequent embryo, quality. It has been shown that high levels of NEFA might influence the fertility of high yielding dairy cows by hampering the oocyte maturation process (Leroy, Reference Leroy, Vanholder, Delanghe, Opsomer, Van Soom, Bols, Dewulf and de Kruif2004). Serum cholesterol concentrations were also higher on farm H before calving and 9–11 weeks after calving, at first insemination (Fig. 1). Westwood et al. (Reference Westwood, Lean and Garvin2002) found a positive association between cholesterol concentrations and reproductive performance of dairy cows; however, the mechanism by which cholesterol may influence fertility of dairy cattle is unclear.
Levels of blood metabolites (ketone bodies, NEFA, total cholesterol) and AST on farms H and L. Values marked with asterisks differ between the farms: *P<0·1; **P<0·05; ***P<0·01.

In conclusion, our study indicates that, despite differences in energy balance between the farms during the first month of lactation, the commencement of luteal activity and the proportion of normal and abnormal ovarian cycles post partum was similar. On both farms up to 50% of recently calved dairy cows suffered some ovarian dysfunction during the post-partum period. However, on farm H, with moderate NEB, the delayed start of ovulations post partum did not impair subsequent reproductive performance.
This work was supported by the Estonian Science Foundation (Grants5422, 6065) and TARPM 0421. We would also like to acknowledge Mrs Ülle Lätt for her technical assistance and Dr David Arney for the linguistic correction. We thank the Piistaoja Experimental Station and AS Tartu AGRO for their cooperation.