

Women are underrepresented in political institutions. Yet descriptive representation is vital for representative democracies. Democratic theorists point to the importance of “descriptive likeness” (Pitkin Reference Pitkin1967, 92). Phillips (Reference Phillips1995) and Mansbridge (Reference Mansbridge1999) support the idea of the politics of presence. They argue that the gender composition of parliaments becomes a legitimate matter for democratic concern. Simply put, the presence of women can make a difference. In turn, democratic practitioners regard gender equality in politics as an important policy goal and focus on how to enhance women's descriptive representation in practice. So, what can contribute to a greater representation of women in parliaments?
This article examines the significance of politcal recruitment and candidate selection processes, which influence women's presence in parliaments. Candidate selection analysis from a gender perspective was proposed by Norris and Lovenduski (Reference Norris and Lovenduski1995), who put forward a supply and demand model of candidate selection to explain the underrepresentation of women in politics. They argue that candidate selection is an interactive process in which both political parties (demand side) and aspirant candidates (supply side) affect outcomes (see Lovenduski Reference Lovenduski2016). The role of political parties is undeniable because they are gatekeepers to political office, and they are in charge of political recruitment (e.g., Baer Reference Baer1993; Gallagher and Marsh Reference Gallagher and Marsh1988). It is argued that “candidate selection is at the core of what political parties stand for and what they do” (Ranney Reference Ranney, Butler, Penniman and Ranney1981, 103). Resources and motivation shape the supply side.
Building on the supply and demand model, this article tests how the election of a woman, instead of a man, makes a difference for the candidate nomination patterns of a party in future elections. Moreover, this article tests whether there is a “contagion” effect—that is, whether other parties follow suit in promoting women. More specifically, the article contributes to recent research discussing the idea that the gender gap in political ambition (Fox and Lawless Reference Fox and Lawless2004) might be mitigated if a single woman is present in politics (Bhalotra, Clots-Figueras, and Iyer Reference Bhalotra, Clots-Figueras and Iyer2018; Broockman Reference Broockman2014; Giliardi Reference Gilardi2015). This literature suggests that a single female legislator can serve as a role model for other women and empower them to run for office. Broockman summarizes this strand of research as follows: “One novel hypothesis about how to increase women's participation has gained particular prominence: that the election of female officeholders and the presence of female candidates on ballots itself causes more women to politically participate, both in more routine acts of participation in the mass public (such as contacting one's representatives) and by running for elected office themselves” (Reference Broockman2014, 191). Crucially, this mechanism is different from theories that argue that female representation increases after women are “sufficiently” represented by a large number of elected women. Instead, the empowerment hypothesis envisages that the election of a single woman can make a difference for future female selection patterns. However, research testing these mechansims has only found mixed evidence and remains focused on plurality systems. Our article contributes to this debate by providing, to the best of our knowledge, the first analysis of the empowerment hypothesis for the case of an open-list proportional representation (PR) electoral system.
We hypothetize that there are three possible effects when a woman instead of a man is elected from a party list under PR. First, we test the incumbency hypothesis. That is, we provide an answer to the question of whether women are able to benefit from their status as incumbents by securing better list placement and thus having higher reelection probabilities in future elections. Second, we directly test the empowerment hypothesis—that is, whether the election of a single woman has an effect on the overall gender list composition in future elections. Finally, our third hypothesis concerns a mechanism that has been described as contagion by Matland and Studlar (Reference Matland and Studlar1996). We analyze whether a success by a female representing one party has an impact on selection decisions by other parties in a given district in subsequent elections.
Our empirical analysis is based on data from the Polish open-list PR system used in the elections to the lower house of the Polish parliament, the Sejm, as well as in the elections to the subnational parliaments. The Polish case merits scholarly attention. Poland has seen a steady increase in the number of women in politics since the 1989 regime change (see Gwiazda Reference Gwiazda2015, Reference Gwiazda2017). Hence, it is a good testing ground for theories that explain women's enhanced presence in politics. Moreover, because of the use of the identical electoral systems at different tiers of government over a longer period of time (2001–15), we have access to a large data set from which we can draw an “estimation sample” fulfilling the conditions necessary for applying a regression discontinuity design (RDD), which enables us to analyze the causal effect of electing a woman (instead of a man). The quasi-list PR system (Shugart Reference Shugart, Gallagher and Mitchell2005) used in Poland also makes it possible to conduct a test of the impact of the election of a woman at time t on nomination patterns at time t + 1 while holding the electoral district constant. Hence, we are not constrained to examining the spatial spillover that has been the focus of earlier studies using data from elections taking place under plurality systems with single-member districts.
The article is structured as follows: The next section discusses the three assumed theoretical mechanisms in more detail. The third section describes the data used and the employed research design. The fourth section presents the results, and the last section concludes.
THEORY
As outlined in the introduction, we expect three potential effects of the election of a single woman on future female candidate selection patterns: incumbency, empowerment, and contagion. In the following sections, each of these three aspects will be discussed separately.
Incumbency
Analyses of the incumbency advantage have peaked in recent years. Although research has been conducted on incumbency for several decades in political science (e.g., Gelman and King Reference Gelman and King1990), pioneering work by Lee (Reference Lee2008) has led to a renewed interest in the question of how being elected in election t affects the reelection probabilities of a candidate in election t + 1. There is strong evidence that candidates benefit from being the incumbent (a summary of the existing literature is provided by, e.g., de la Cuesta and Imai Reference de la Cuesta and Imai2016). While many of these studies focus on the case of single-member districts for examining incumbency effects, there is also increasing evidence that incumbency is beneficial in open-list PR system (e.g., Dahlgaard Reference Dahlgaard2016).
How is the analysis of the incumbency advantage relevant for the discussion of female representation? The basic idea is rather simple. Since men are strongly overrepresented in almost every parliament in the world, it will become more challenging for women to increase their level of representation as incumbents are more likely to be reelected (Schwindt-Bayer Reference Schwindt-Bayer2005). Therefore, incumbency has been described as a “mechanism of reproduction for male dominance (understood … as the numerical over-representation of men in politics)” (Chiva Reference Chiva2017, 82).
However, it is important to differentiate between incumbency as a mechanism that solely hinders the creation of a gender-balanced parliament and as a mechanism that disadvantages women (or favors men). The differentiation of these two concepts is crucial. The first concept of hindering female representation is closely related to the idea of path dependency and makes no claim about whether the incumbency advantage is stronger for men than for women. Instead, this argument simply implies that the incumbency advantage is solely unfavorable to female representation as it increases the probability that existing patterns of descriptive representation will be reinforced. Put differently, the argument implies that once women are sufficiently represented, they are equally likely to benefit from the incumbency advantage, but becoming the incumbent is harder for women than for men. The results reported by McGregor et al. speak in favor of this explanation, as they indicate that “[f]emale candidates perform very well in wards with a female incumbent candidate, but men and women are equally likely to support female candidates in these settings” (Reference McGregor, Moore, Jackson, Bird and Stephenson2017, 142). Similar results are reported by Allik (Reference Allik2015) for the case of Estonia.
The second mechanism is quite different, as it raises the question of whether the incumbency advantage might be particularly strong for men. If this is the case, then it is not just that men are more likely to be reelected, but also that women are less likely than male incumbents to hold their seats. The research regarding the gender specificity of the incumbency effect is mixed. Some authors have found evidence for a particular disadvantage of female incumbents. Chiva (Reference Chiva2017), for example, provides a comparative analysis of incumbents’ rerunning and reelection probabilities in Central and Eastern Europe. Her findings suggest that female incumbents are often equally likely to rerun for parliament but show lower proportions of being reelected compared to male incumbents (Chiva Reference Chiva2017, 95). She argues that this might be caused by “party gatekeeper's [(un)]willingness to place women candidates in winnable seats or positions.” This assumption is not unwarranted, as previous research has shown that list placement is a particularly important factor for electoral success, even in open-list PR systems (Jankowski and Marcinkiewicz Reference Jankowski and Marcinkiewicz2019). Even more importantly to support this argument, Fiva and Rohr (Reference Fiva and Røhr2018) find a strong effect of incumbency on future list placement in party-centered systems.
Others, however, have found that incumbency might be particularly beneficial for women. Bhavnani (Reference Bhavnani2009) exploits a natural experiment in India to analyze how the election of women affects the future patterns of female representation in the same district. The random assignment of certain districts to elect only female candidates allows for such an analysis. The results clearly demonstrate that the election of women has a positive effect on future female representation. The treated districts were more likely to elect women in the future, and more women ran for parliament in those districts. In a similar vein, Shair-Rosenfield and Hinojosa (Reference Shair-Rosenfield and Hinojosa2014) argue that the presence of female incumbents can decrease the amount of gender bias in elections and within parties. By demonstrating their qualification as a politician, becoming an incumbent helps women to overcome an otherwise existing prejudice against female candidates among voters and party leadership.
Building on these different perspectives on how incumbency might affect female representation, we ask how female incumbency affects the probability of female representation in open-list PR systems. Our focus is on list placement and, more specifically, list leadership. Becoming the list leader in an election is an important signal to the electorate. The candidate placed at the first ballot position is the party front-runner; such placement reflects the highest level of endorsement of a party for this candidate (Folke, Persson, and Rickne Reference Folke, Persson and Rickne2016). Moreover, being placed at the first ballot position is a very strong predictor of getting elected to parliament (Faas and Schoen Reference Faas and Schoen2006). This obviously holds true in closed-list PR systems, but in open-list PR systems as well, ballot position effects for the top-placed candidates are so strong that being placed first is an important prerequisite for getting elected (Marcinkiewicz Reference Marcinkiewicz2014). Therefore, our empirical analysis focuses on the effects of electing a female candidate on the probability of having a female candidate as the list leader in the following election. It is important to note at this point that we focus on cases in which only one candidate from the party list was elected to parliament. It is also important to highlight that we focus only on the gender of the list leader in the next election and do not directly control for whether the incumbent is the candidate who reruns at the top of the party list. This is due to the fact that our data do not allow us to match individual candidates between the elections. Focusing on the gender of the list leader in the next election, however, is in line with our research question of how gender representation patterns are affected by a female incumbent. We also want to highlight that we think that the rerunning incumbents largely account for the potential effects.Footnote 1
We expect that incumbents have an advantage over other candidates because they remain politically active for the next several years, have the chance to build local political networks, and are well informed about local problems. Therefore, their position within the party should be strengthened, and they should have more influence on their list placement in the next election (Folke, Persson, and Rickne Reference Folke, Persson and Rickne2016). Moreover, parties should often have a strategic incentive to nominate the incumbent to the first ballot position in the hope that this candidate will attract more votes. Consequently, we expect that once a woman (man) is elected to parliament, this party list is more likely to have a woman (man) at the top of the list in the next election. This constitutes our first hypothesis:
H 1:
The election of a woman to the parliament in election t increases the probability of a woman appearing on the first position on the list of a given party in a given district in election t + 1.
Empowerment
The previous section was concerned with the effects of electing a woman on the future career prospects of this particular woman. We were not concerned with the effect of electing a woman on the overall future selection patterns of female candidates. Such a process is commonly referred to as the “empowerment” effect.
Empirical evidence suggests that political engagement of females may motivate other women to become involved in politics as well. A number of studies relying on data from India report the existence of a substantive empowerment effect (e.g., Bhavnani Reference Bhavnani2009). In districts that were reserved for female candidates at a certain point in time, other women were also more likely to win in the following elections. Also, the overall number of female candidates increased. In general, it may be concluded that in districts where females contested the election, subsequent increases in different forms of political engagement by women can be observed. The phenomenon of empowerment has been analyzed both in the temporal (as was done by Bhavnani Reference Bhavnani2009) and in the spatial context (Broockman Reference Broockman2014; Gilardi Reference Gilardi2015). In the former case, the increase in political engagement by females is expected to be found in the period following female candidacy or electoral victory. The latter approach attempts to identify the spillover effects on neighboring districts.
The evidence in favor of the empowerment effect, however, is not uniform. Wolak (Reference Wolak2015) finds in her experimental study that women's political engagement is insensitive to the gender of the candidate. A study by Broockman (Reference Broockman2014) relying on data from U.S. state legislative elections demonstrates that the patterns observed in industrialized countries may be different from what could be observed in the Indian context studied by Bhavnani (Reference Bhavnani2009). In the case of U.S. state elections, no positive empowering effect of female candidacy could be identified. Broockman (Reference Broockman2014) tests the empowerment effect by analyzing whether the election of a woman in a single-member district has an impact on the probability of nominating a woman in spatially proximate districts in the next election. More differentiated results are offered by Gilardi (Reference Gilardi2015), whose analysis stretches over a period of 40 years. Using data from municipal elections in the Swiss canton of Zurich, Gilardi (Reference Gilardi2015, 966) demonstrates that spatial spillover of the empowerment effect is substantive in the first elections after women were granted voting rights. It becomes weaker over time, however, and in the end disappears. Finally, Foos and Gilardi (Reference Foos and Gilardi2017) conduct a field experiment to test whether female politicians can function as a role model for other women and motivate them to become politicians. Their results suggest that female role models can acutally demotivate other women to become politicians. One explanation for this finding is that other women might feel intimidated when seeing how many obstacles lie in the way of a female career in politics.
Since we examine a party-list-centered system, we can avoid analyzing the impact of electing a woman on the probability of nominating more women in regionally proximate districts. This type of spatial spillover was the focus of the studies by Broockman (Reference Broockman2014) and Gilardi (Reference Gilardi2015), who discuss examples of majoritarian voting systems. We believe that the composition of the party list in the same district in the next election provides an even more interesting and convincing case for analysis (temporal spillover). As already explained with regard to the incumbency effect, we expect that being the only elected candidate from a list gives the incumbent more influence in the internal hierarchy of the party in the future. Therefore, the incumbent should be more likely to secure herself a better placement in the next election. If the empowerment effect exists, it should have a strong effect on the list composition directly within the district (and not only on candidates in proximate districts).
The empowerment effect should be more likely to occur in the context that we analyze, as the “costs” of nominating additional women are relatively low in PR systems compared with majoritarian systems. Being placed close to the bottom of the ballot paper is associated with a very low election probability. This is drastically different than in single-member districts, where only one candidate per party is nominated. Bluntly put, if a party member wants to run for parliament in PR systems, she or he can easily be added to the party list without significantly lowering the electoral chances of the most preferred candidates of the party too much. In a single-member district, in contrast, only the most powerful candidate in the intraparty selection process is eventually nominated. In these cases, some women might be more motivated to run for election, but they ultimately do not appear at the ballot paper because they have lower chances during the selection process. Therefore, analyzing the gender composition of party lists in PR systems should provide a better testing ground for empowerment effects. Of course, we cannot fully exclude the possibility that we are analyzing cases in which more candidates wanted to run for office than positions on the list were available. However, the number of candidates who were not selected to the list as well as the ratio of potential candidates to the number of available seats should be drastically lower in PR systems compared with majoritarian systems.
Following the idea of empowerment, we expect that the election of a woman in election t will lead to an increase in the number of female candidates in election t + 1. We use two different outcome variables to test this effect: the raw number of women on the party list in election t + 1 and the proportion of women in election t + 1.Footnote 2 Therefore, our second hypothesis is as follows:
H 2:
The election of a woman to parliament in election t increases the number/proportion of women appearing on the list of a female legislator's party in a given district in election t + 1.
Contagion
The third objective of our study is to examine the effect of female electoral success on selection decisions by other political parties. We expect that the election of a woman from one party may encourage other parties to nominate more women to their party lists. If this is the case, we can speak of the existence of a specific kind of spillover effect that Matland and Studlar (Reference Matland and Studlar1996) describe as “contagion.” The contagion effect differs from the empowerment effect addressed in the previous section because of its external character. The success of a woman appearing on one party list is expected to have impact on other parties. Matland and Studlar (Reference Matland and Studlar1996) theorize and find empirical support that such effects are particularly strong under PR systems—the case we are focusing on. They argue that contagion should appear as the election of women “may demonstrate that there is no electoral penalty associated with women candidates” and because “parties feel increased pressure to respond by more actively promoting women themselves” (Matland and Studlar Reference Matland and Studlar1996, 712). This explanation is followed by Broockman (Reference Broockman2014, 192), who suggests that the success of a woman running for office may motivate party elites to decrease their bias against female candidates. The positive example of a female legislator representing one party may motivate elites of other parties to be more supportive of female candidates.
There is also the possibility that the candidate selection process has a strategic character. While deciding who should be placed on the list, party leaders must take into consideration decisions made by the leaders of other parties. If at time t one party managed to get a female candidate elected to the parliament in a given district, leaders of other parties may be compelled to place in a prominent position on the party list a candidate who is similar to that successful candidate. The electoral victory of a female candidate may indicate that voters in a given district are less biased against female candidates. Therefore, other parties might see it as an electoral advantage to gain votes by nominating a woman to the top of their list as well. Finally, one might expect that there is variation in the contaigon effect, depending on whether a left-wing or a right-wing party elected a woman in the previous election. More specifically, we expect a “contagion from the right” (Matland and Studlar Reference Matland and Studlar1996, 710), meaning that the election of a woman from a right-wing party will have a stronger contaigon effect. The reason for this expectation is simple: in contrast to more left-wing parties, Polish right-wing parties put less emphasis on the representation of women in parliament or are even directly opposed to the idea of gender parity (see the debate on the implementation of a gender quota in 2011 as described in Gwiazda Reference Gwiazda2015). Therefore, right-wing parties should care less about the gender of competing candidates, also because their voters might be less likely to vote for female candidates. (Both Jankowski and Marcinkiewicz Reference Jankowski and Marcinkiewicz2019 and Górecki and Kukołowicz Reference Górecki and Kukołowicz2014 demonstrate that women of right-wing parties in Poland often receive fewer votes than men.) For left-wing parties, however, increasing the share of women is often an important issue. Thus, left-wing parties can be expected to be particularly inclined to nominate a woman in cases in which a right-wing party has a female incumbent. In doing so, left-wing parties avoid being perceived as potentially less female-friendly than right-wing parties. Consequently, we formulate two hypotheses:
H 3a:
The election of a woman to the parliament in election t increases the probability of a woman appearing on the first position on the list of other parties in a given district at the election in t + 1.
H 3b:
The effect described in H 3a should be particualrly strong when right-wing parties elect a woman to parliament.
DATA AND METHODS
Data Set
Our data cover various elections in Poland, all using the same version of the open-list PR system. The Polish open-list PR system in its current form remained virtually unchanged between 2001 and 2015 and allows voters to cast one vote for a candidate appearing on a certain party list. Preference voting is compulsory, which means that voters cannot simply confirm the list order provided by the parties but have to cast their vote for a specific candidate (Marcinkiewicz and Stegmaier Reference Marcinkiewicz and Stegmaier2015). The party magnitude is determined based on a seat allocation method (in most cases the D'Hondt method) given the vote shares of the parties in a district. Candidates are elected based on the number of preferential votes received. This version of the open-list PR system is applied in national, regional, county, and local elections in larger municipalities (and, prior to 2011, in medium-sized municipalities; see Górecki and Kukołowicz Reference Górecki and Kukołowicz2018).
We combine data from all of these levels for all elections held since 2001. The raw data cover 64,106 unique lists. However, we restrict our sample to the party lists of the four major Polish parties: the right-wing populist Law and Justice party (PiS), the centrist/liberal Civic Platform (PO), the conservative-agrarian Polish People's Party (PSL), and the left-wing Democratic Left Alliance (SLD). Other parties are not considered, since they were not continuously represented in most of the analyzed (local, county, regional, and national) representative bodies for the whole period of analysis and usually existed for only a short period of time. Of course, it would be interesting to analyze the effects for these smaller lists as well. However, even when some of those lists reran in the next election, they often used different party names and thus matching lists between the elections becomes quite challenging. There is also no party registry that could be used to match identical lists. As we have to remove these smaller parties, the number of unique party lists in our data set is reduced to 24,185.
Regression Discontinuity Design
We are interested in estimating the causal effect of electing a single woman to parliament on future female candidate selection patterns. However, the relationship between electing a woman in election t and female selection patterns in election t + 1 is obviously endogenous. A woman who has won by a large margin might be particularly qualified as a politician, and she is both more likely to receive preferential votes and to become the list leader in the next election. In order to overcome this problem, we make use of the regression discontinuity design.Footnote 3
The RDD can be applied to cases in which a continuous variable (commonly referred to as a “scoring,” “forcing,” or “running” variable) with a known cutoff value determines treatment assignment. Using the RDD, we are able to estimate the causal effect of the treatment under the plausible assumption that subjects cannot fully control their placement on the running variable. Consider the simple case of a two-candidate election as an example (Lee Reference Lee2008). The treatment of being elected is assigned only to the candidate with a positive vote margin—that is, the candidate who received more votes. However, candidates cannot fully control how many votes they receive in an election. This implies that there is a certain amount of “randomness” in the observed election outcome for each candidate. Since the cutoff at which the treatment is assigned is fixed, the treatment is “as-if” randomly assigned around the cutoff. Put differently, when two candidates compete against each other and the race between the candidates is decided by only a few votes, then both candidates basically have the same probability of winning the election. In short, the RDD exploits the “as-if” random assignment around the cutoff of the continuous variable as a natural experiment. It should be noted, however, that the causal effect of the treatment can only be observed around this threshold and is thus “local.”
In order to apply the RDD to the case of open-list PR elections, we have to make some tough decisions and restrict our data set to an “estimation sample” for which causal effects can be identified (compare, e.g., Folke, Persson, and Rickne Reference Folke, Persson and Rickne2016). Speficially, we have to focus on cases in which only one candidate has been elected in election t. Moreover, we use cases in which the two candidates with the highest number of preference votes were of different genders. Then we estimate the vote margin between these two candidates as a measure of closeness between the top two candidates.Footnote 4 The vote margin is defined with regard to the female candidate, meaning that it is positive if and only if a woman was elected and negative if a man was elected (in this case, the woman was a runner-up). Eventually, this implies that for very small vote margins, it was basically as-if randomly assigned whether a male or female candidate was elected to parliament from that list. Therefore, these lists are comparbale and differ only with regard to the gender of the elected candidate. Put differently, we focus on cases that resemble the situation of a single-member district in which only one candidate is elected. The main difference is that our outcomes are different from the single-member district case because we cannot only analyze the effects with regard to a single candidate but to a whole list of candidates in the next election.
We acknowledge that the decision to focus only on lists with a party magnitude of one and where the top two candidates were of different genders makes our data set less representative. In fact, we are left with 2,978 observations—a rather small subset of our full data set. In this regard, our research design reflects the trade-off between using as many observations as possible in an analysis that does not necessarily allow for identifying causal relationships or using only those observations that can be used for identifying a causal effect. Recent work on causal inference has often advocated the latter position (Keele Reference Keele2015), and we follow this strand of research. However, we are aware that our estimates provide only a causal effect for a specific sample of cases. Still, it should be mentioned that this is—to our knowledge—the first time that the empowerment hypothesis has been tested for the case of PR systems using a causal identification strategy.
One might think of other modeling strategies to apply the RDD. For example, one might want to give up the restriction to focus on lists with a party magnitude of one and focus on lists on which a woman was barely elected or not elected, ignoring whether male candidates were elected as well. While this is possible, we opt against such a strategy for theoretical and methodological reasons. Theoretically, this approach strongly weakens the assumed mechanisms underlying the “empowerment” or “role model” argument. Under this alternative modeling startegy, the elected woman would be, by defintion, the last elected candidate. This woman is the potentially weakest incumbent as she received the smallest number of preference votes among all elected candidates. Methodlogically, this alternative approach is also problematic because the running variable becomes imbalanced around the threshold. The reasons for this aspect are rather technical and related to the nonlinearity between ballot positions and the number of preference votes. Put bluntly, when we focus on lists with more than one elected candidate, then the number of lists for which one women was elected by a close margin increases, while the number of lists on which a woman was not elected by a close margin decreases. This eventually results in an imbalanced running variable that violates the McCrary test as the density of the running variable is no longer continuous around the threshold (see the next section for details).
Estimation of the RDD
While the basic setup of the RDD is rather simple, the estimation of the local average treatment effect is a bit more complex, as potential pitfalls have to be taken into account (see, e.g., Lee and Lemieux Reference Lee and Lemieux2010). First, while the treatment is “as-if” randomly assigned around the threshold, the treatment effect is usually identified by running local linear regression analyses inside a certain estimation window around the threshold using the running variable as a predictor. By using a triangular kernel, more weight is given to observations close to the cutoff, and less weight is given to observations more distant from the cutoff. Observations outside the estimation window do not contribute to the result, as they are assigned a weight of zero. Second, a crucial question is how the estimation window is determined (for an overview, see Cattaneo and Vazquez-Bare Reference Cattaneo and Vazquez-Bare2016). The dominant approach is to use the Imbens and Kalyanaraman bandwidth selector (Imbens and Kalyanaraman Reference Imbens and Kalyanaraman2012; IK) or the more flexible method developed by Calonico, Cattaneo, and Titiunik (Calonico, Cattaneo, and Titiunik Reference Calonico, Cattaneo and Titiunik2014; CCT). Both estimators minimize the mean squared error. We use both approaches in our analysis, but we report—if not explicitly mentioned differently—the results based on the CCT bandwidth selector. Third, as demonstrated in Calonico, Cattaneo, and Titiunik (Reference Calonico, Cattaneo and Titiunik2014), statistical inference is biased in conventional RDD analysis, and thus we report the results using the bias-correction method for p-values developed by CCT.
Fourth, the RDD is based on the assumption that subjects cannot fully control their placement on the running variable. This assumption can be tested by two different procedures. First, when subjects cannot fully control their placement on the running variable, then candidates should not be able to select themselves systematically into the treatment or control group (e.g., Caughey and Sekhon Reference Caughey and Sekhon2011). This means that the number of observations around the threshold should be fairly similar. This can be tested empirically by controlling for discontinuity in the density of the running variable (McCrary Reference McCrary2008) with the expectation of finding no such discontinuity. The second way to control for the validity of the RDD is by estimating the RDD on predetermined outcomes. For example, the treatment should only have an effect on outcomes measured for election t + 1, but it cannot have an effect for outcomes in election t. Therefore, we can expect predetermined outcomes to be fully balanced around the threshold and not display any discontinuities. In the next section, we present these analyses and demonstrate the validity of the RDD for our case. Finally, the robustness of the RDD results can be strengthened by running placebo analyses. For this purpose, we estimate the RDD using hypothetical cutoffs with the expectation of finding no effects for these cases.
Validity Checks for the RDD
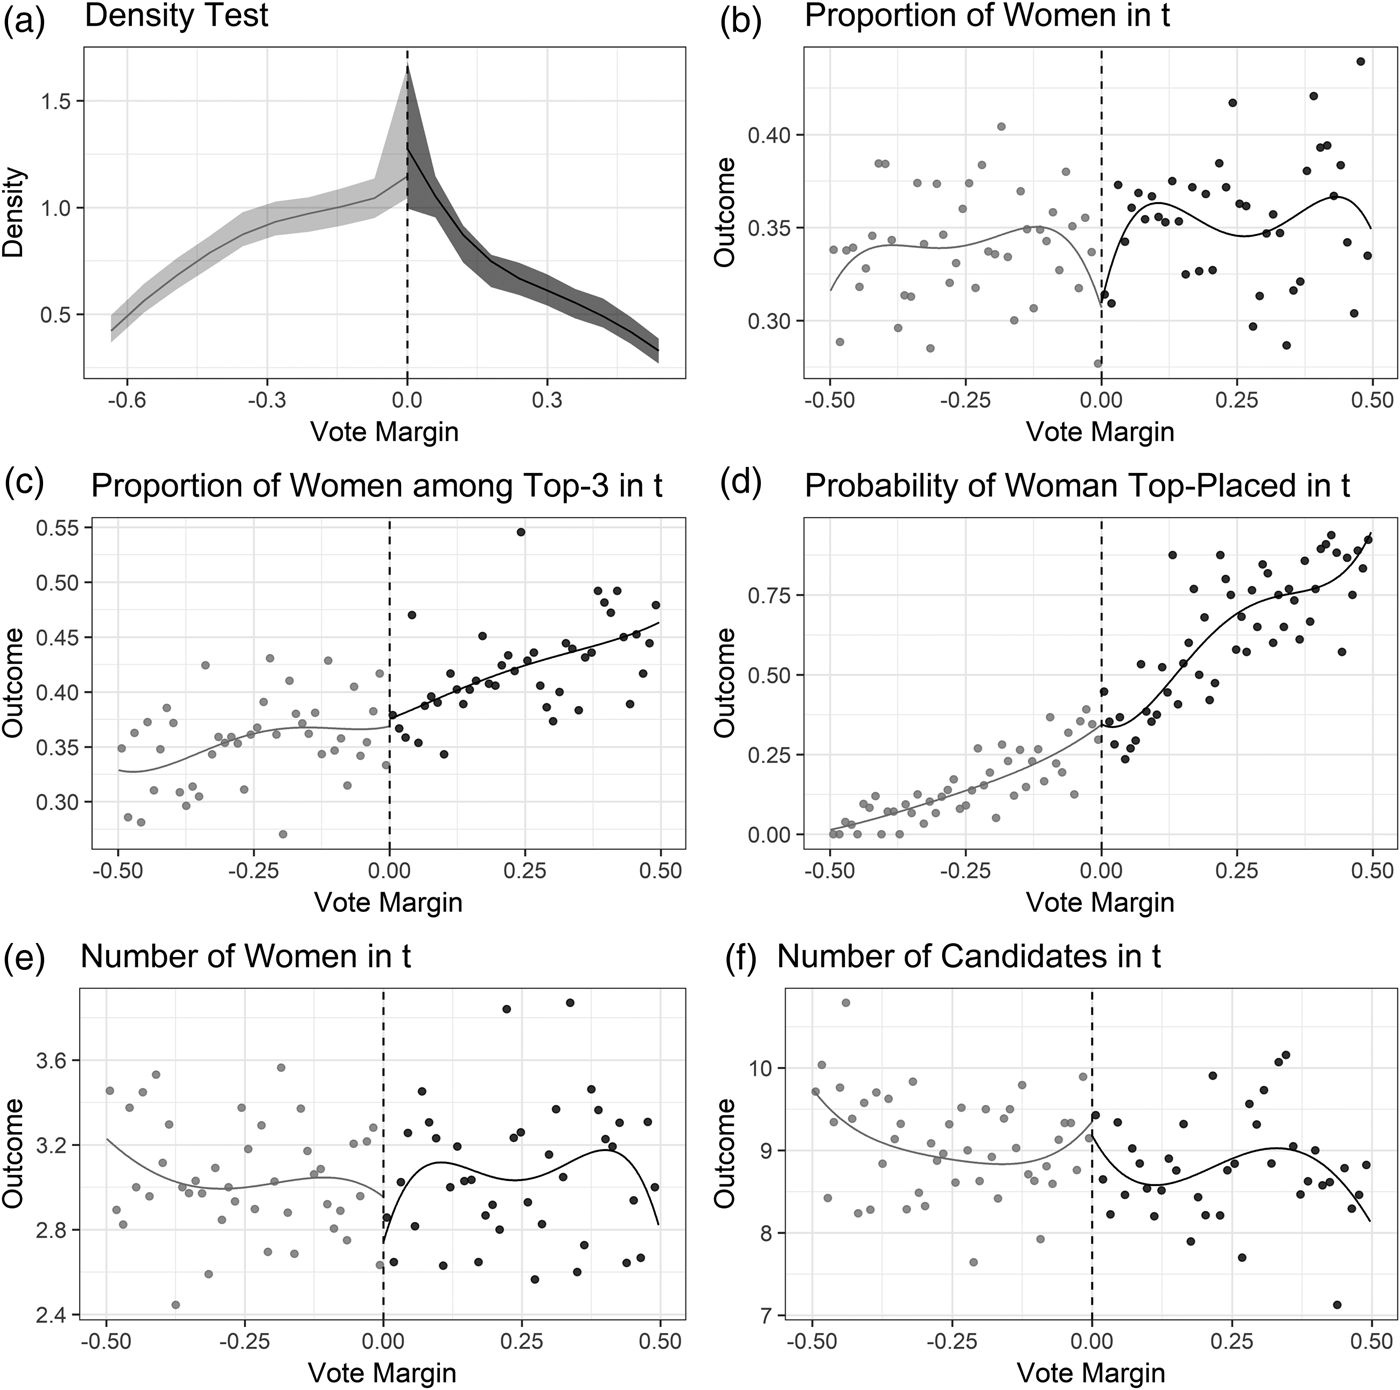
As described in the previous section, we now present validity checks for the RDD. First we control for the density in the running variable. For this purpose, we use the approach developed by Cattaneo, Jansson, and Ma (Reference Cattaneo, Jansson and Ma2017), which improves on the McCrary test (Reference McCrary2008). As explained earlier, the RDD is only valid when there is no sorting around the threshold, implying that candidates cannot systematically select themselves in the treatment and control group. This assumption is fulfilled in our case, as demonstrated in Plot a of Figure 1. The p-value of the test is .8987 and thus does not allow us to reject the null hypothesis of no discontinuity in the density of the running variable. Plots b–f in Figure 1 display the results of applying the RDD to predetermined outcomes in election t (instead of election t + 1, as we will do later in the empirical analysis). There is no discontinuity at the cutoff for any of these outcomes, which again strengthens our confidence in the validity of the RDD.
Validity checks for the RDD. Plot a displays the density of the running variable for the control group (gray) and treatment group (black) based on the procedure developed in Cattaneo, Jansson, and Ma (Reference Cattaneo, Jansson and Ma2017), which is comparable to the McCrary (Reference McCrary2008) test. There is no discontinuity in the density around the cutoff (vertical dashed line). Plots b–f display the effect of the treatment on predetermined outcomes. As expected, predetermined outcomes are not affected by the treatment. The vote margin in plots b–f is only displayed for the range –0.5 to 0.5 to increase the clarity of the plots.

RESULTS
We distinguish three different effects of the election of women. The first part of the analysis is concerned with the career development of women after being elected. This part of the analysis is related to standard assessments of the incumbency advantage (Lee Reference Lee2008) and does not necessarily imply a spillover effect. In this part of the analysis, we simply concentrate on whether electing a woman instead of a man in election t has a positive effect on the selection and election of a woman in election t + 1 (in most cases, the woman who was elected in t). The second and third parts of the analysis are concerned with how the election of women affects the female representation of other women in the next election on the same or other party lists.
Incumbency Effect
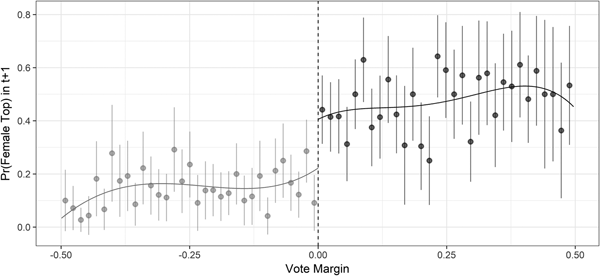
Figure 2 provides evidence for H 1, that the probability of a woman becoming a list leader in future elections increases when a woman is the incumbent. This is obvious by the clear discontinuity at the threshold. When a woman is elected to parliament, the probability that this list places a woman at the top of the ballot is approximately .4, while it is below .2 when a man is elected.Footnote 5 Euphemistically speaking, this is a strong effect: the chances of a woman being the list leader are twice as high when a woman is the incumbent. However, in absolute terms, the effect size is rather small. Even when a woman is the incumbent, the probability that a woman will be at the top of the list is below .5. Put differently, the probability that a man will become the list leader is still higher.
Effect of electing a woman in election t on the probability of a woman being placed at the first ballot position in election t + 1. Plot is a standard regression discontinuity plot following the advice of Calonico, Cattaneo, and Titiunik (Reference Calonico, Cattaneo and Titiunik2015). Points are binned averages of the dependent variable. Vertical lines are 90% confidence intervals.

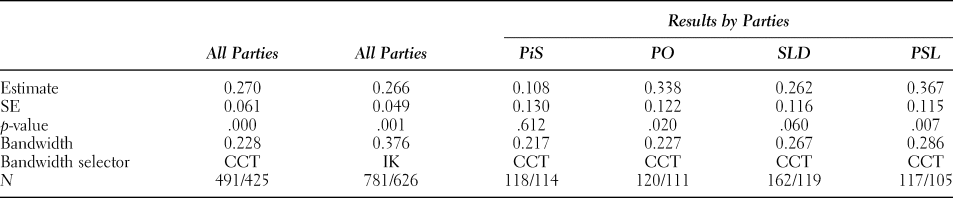
The precise estimates are almost identical for the CCT and IK bandwidth selectors: both estimate an increase in the probability of placing a woman at the top of the list in the next election of τ = 0.231 that is statistically significant at p < .01. Table 1 reports the exact estimates, standard errors, robust p-values, and bandwidths.
Effect of electing a female candidate on the probability of nominating a female candidate on the first ballot position in election t + 1

Notes: Results are from an RDD in which the dependent variable is binary and measures whether a party list nominated a woman to the first ballot position in the election t + 1. The running variable is the female vote margin in election t, so positive values indicate that a woman was elected in election t. The p-values are computed based on the robust method developed in Calonico, Cattaneo, and Titiunik (Reference Calonico, Cattaneo and Titiunik2014). All models are based on local linear regressions using a triangular kernel. The number of observations denote the effective number of observations included left and right of the cutoff within the estimation window. Columns 1 and 2 report results for all parties, and Columns 3–6 report results for specific parties.
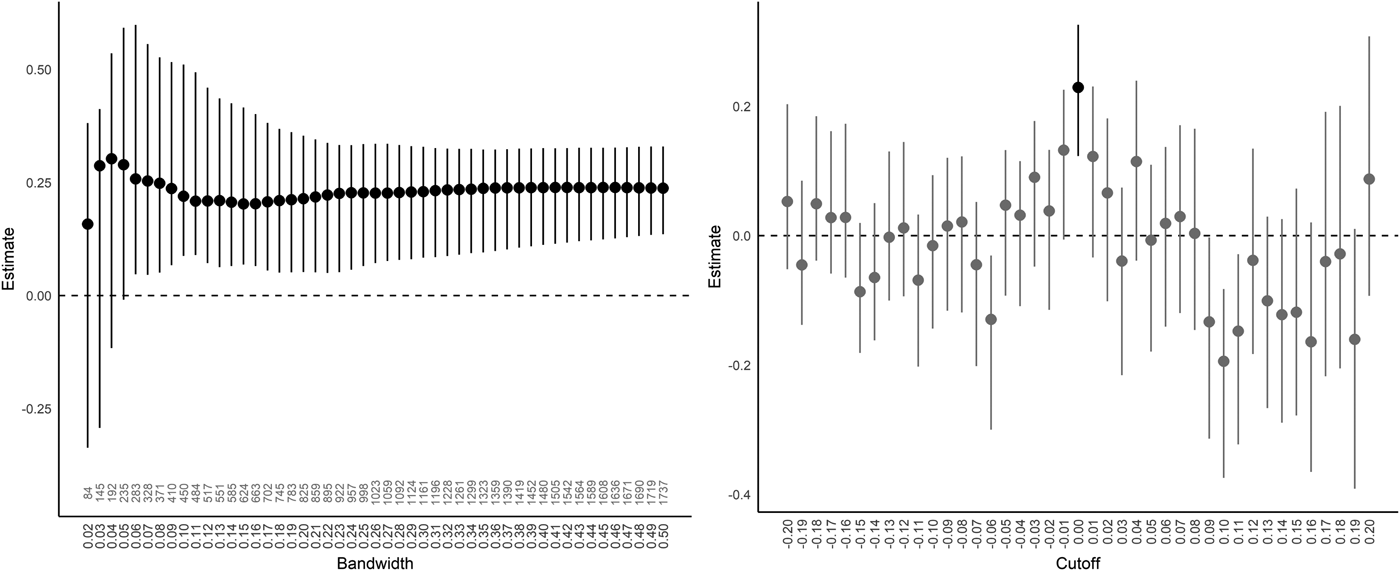
To strengthen confidence in our findings, Figure 3 displays two additional analyses. The left panel shows the effect size for various bandwidths. The plot reflects the variance-bias trade-off faced in many experimental studies. With fewer observations, the randomization assumptions are more likely to hold, but variance increases. The wider the estimation window, the more potential bias is introduced, while the variance is reduced. As can be seen from this analysis, the point estimate is rather stable for various bandwidths. Therefore, our results are not simply the product of a specific estimation window. The right panel of Figure 3 displays the results from the hypothetical cutoff analysis. We ran various RDD models changing the cutoff from –0.2 to 0.2 in steps of 0.01. The effect at c = 0 is a clear outlier, suggesting that our results are not merely the product of chance.
Effect of electing a female candidate on list leadership for different bandwidths (left panel) and placebo cutoffs (right panel). Left panel displays local average treatment effect for various estimation windows and 90% confidence intervals. Numbers at the bottom of the plot indicate the number of observations used for the estimation. Right panel displays effects when using hypothetical cutoff values. True cutoff is c = 0, and the estimate is highlighted in black.

Finally, we address whether the effects are the same for all parties. That is, are women equally likely to increase their future list placement as a result of being elected to parliament for all four parties under consideration? The Columns 3–6 in Table 1 report the effects for the four major Polish parties separately. The effect size increases for the PO, SLD, and PSL and remain statistically significant at p < .1. The results are very different for the right-wing populist party PiS. No effect can be found for this party. The point estimate is close to zero, and the effect is not statistically significant. This might indicate that women face greater challenges of benefiting from the status as incumbents in parties that are actively opposed to the idea of gender equality (Jankowski and Marcinkiewicz Reference Jankowski and Marcinkiewicz2018). While the effect of PiS is not significant and the other effects are, the difference between the effects is not directly signficant.Footnote 6
Since candidate selection and electoral success are closely related in open-list PR systems (e.g., Faas and Schoen Reference Faas and Schoen2006; Marcinkiewicz Reference Marcinkiewicz2014), the results suggest that lists that elected a woman instead of a man should also be more likely to elect a woman to parliament in election t + 1, since elected women benefit from better list placement in the next election. When we use the election of a woman from the party list in the next election as the dependent variable, the estimates are very similar to the analysis of female candidate placement at the first ballot position. Since the results are so similar, we do not report them here in more detail but present the estimated effects in the online appendix to this article (see Table A1).Footnote 7
In sum, we have demonstrated in this section that the election of women has a positive effect on future selection chances for at least one woman. Female legislators are more likely to be placed at the top of a party list after being elected to parliament, and thus they are more likely to remain represented in politics. Since tracking individual candidates between the elections is not possible based on the data that we have, we did not directly test whether the incumbent was renominated as the party list leader or whether some other woman was nominated to the top of the list. However, we manually checked some of the cases and found that the effect is, as could be expected, primarly driven by the renomination of the incumbent woman. Therefore, the next section turns to the question of whether the election of a woman empowers other women to run for office.
Empowerment Effect
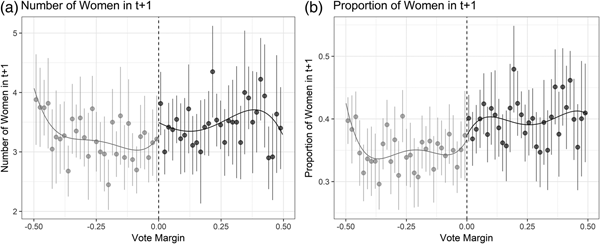
Various outcomes can be used to analyze whether the election of a female legislator makes a difference for other women. We first focus on whether an overall increase in the number of women on the list can be observed. The assumption of empowerment is that women will serve as role models for other women and thus motivate them to run for office. Elected candidates might also become more powerful in their party and thus have more influence on who is going to be nominated. Therefore, successful women might be more likely to motivate other women to run for office. We use two different outcomes to test this basic assumption that the election of a woman will increase the number of other women running for office: the proportion of women on the list and the raw number of female candidates on the list in election t + 1. While both outcomes are strongly correlated, they reflect slightly different concepts.
The results from these analyses are displayed in Figure 4. There is no evidence for an empowerment effect. The number of women and the proportion of women nominated to the list in election t do not seem to be affected by the gender of the elected candidate in election t. Visually, this null result becomes evident by the absence of a clear discontinuity in Figure 4. In the online appendix to this article, we provide a table containing the precise RDD estimates that confirm the absence of an effect (see Table A2). It should be noted, however, that all point estimators are positive but also rather small in magnitude. We omit the robustness checks for these analyses as they simply highlight the robustness in the absence of the effect.
Effect of electing a female candidate on the number of women (left panel) and the proportion of women (right panel) on the list in election t + 1. Plots are standard regression discontinuity plots following the advice of Calonico, Cattaneo, and Titiunik (Reference Calonico, Cattaneo and Titiunik2015). Points are binned averages of the dependent variable. Vertical lines are 90% confidence intervals. Dependent variable in the left panel is the number of women on the list in election t + 1. The right panel uses the proportion of women in election t + 1 as the dependent variable.

These results indicate that the election of a woman at time t does not make a difference for the selection of women in future elections. Similar to the findings presented in Broockman (Reference Broockman2014), our results suggest that there is no spillover effect of electing a woman on the selection of other women in future elections. We have also tested whether there are more subtle empowerment effects. For example, one might argue that the overall proportion or number of women should not increase, but that list placement of other female candidates increases. We tested such mechanisms, for example, by using the number of women placed on favorable ballot positions or the list placement of the second woman on the list as outcome variable but found null effects for these cases as well.
Contagion Effect
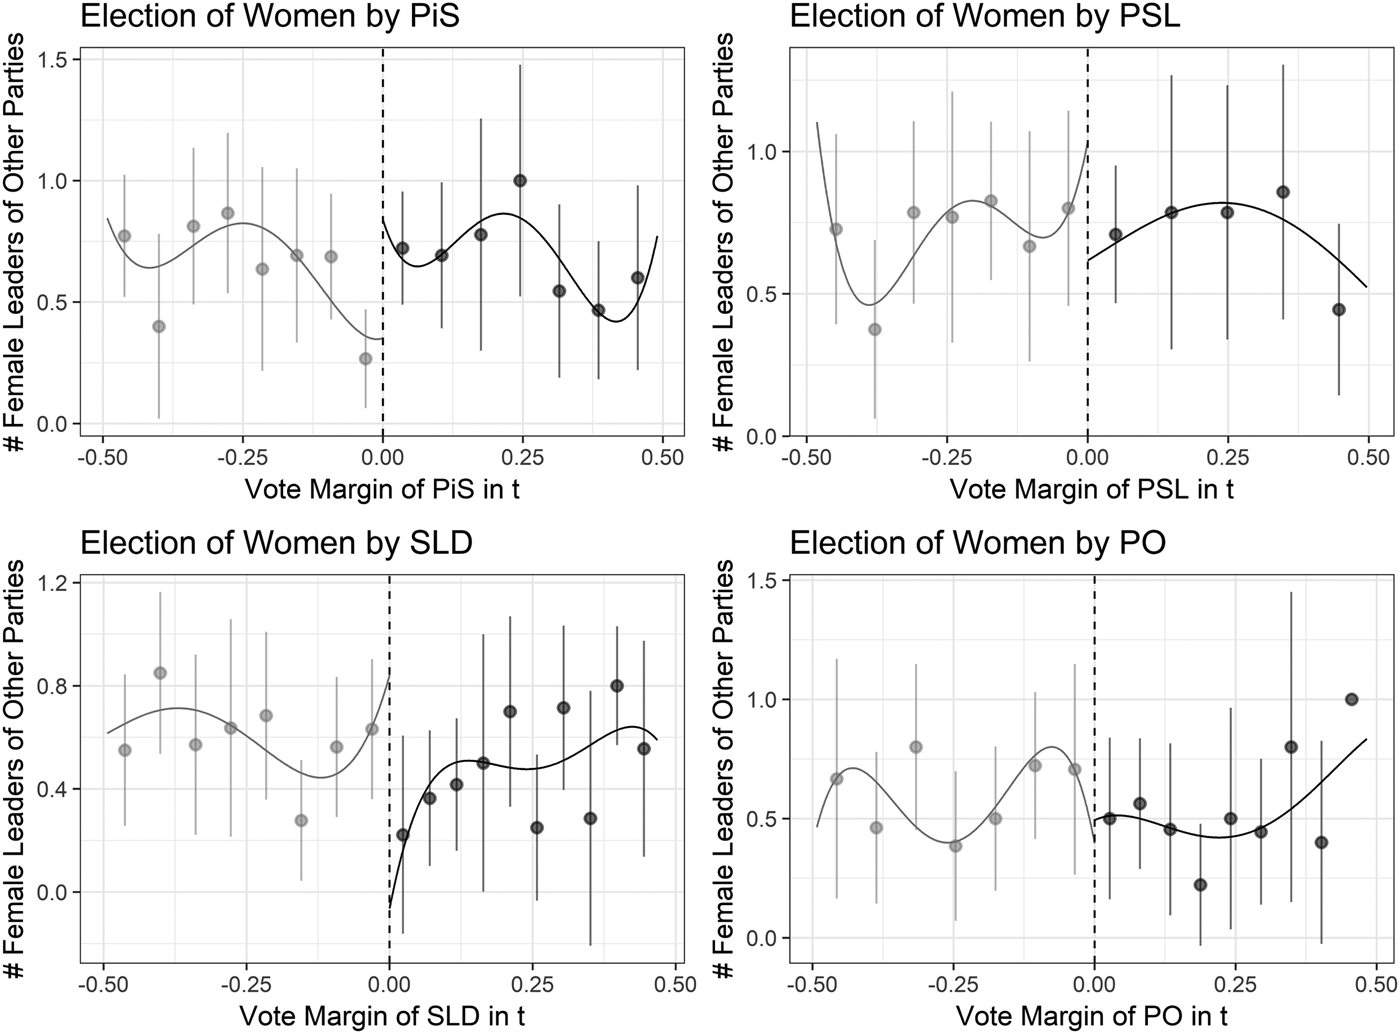
The last step of our empirical analysis addresses whether the election of women from one party list has an effect on the selection patterns of women running from other party lists. For this purpose, we estimate the RDD for each of the four parties separately.Footnote 8 The outcome variable is the number of women placed on top of the party lists for the three other parties in the same electoral district in the next election.Footnote 9
Figure 5 and Table 2 display the effects. For the two parties closest to the political center—the liberal PO and the agrarian PSL—there is no effect. For the two more radical parties—PiS on the right and SLD on the left—we find effects. When these parties barely elect a woman to parliament instead of a man, other parties show significant differences in the number of women placed at top positions. Interestingly, the treatment effects are reversed for the two parties. When the right-wing PiS elects a woman instead of a man, the other parties are more likely to nominate more women at the top of the party list as well. When the left-wing SLD elects a woman, the other parties are more likely to nominate more men to the top of their party list. It should be noted, however, that the number of observations on which this analysis is based is rather small, and thus the results might be affected by the small sample size.Footnote 10
Effect of electing a female candidate on the number of female list leaders of other parties in the same district in election t + 1. Plots are standard regression discontinuity plots following the advice of Calonico, Cattaneo, and Titiunik (Reference Calonico, Cattaneo and Titiunik2015). Points are binned averages of the dependent variable. Vertical lines are 90% confidence intervals.

Effect of electing a female candidate on the number of female list leaders of other parties in the same district in t + 1

CONCLUDING DISCUSSION
This article has discussed the effects of electing a woman instead of a man in the context of the open-list PR systems. By using a rich data set with thousands of lists, we are able to estimate the local average treatment effect of electing a woman using the RDD. We find that women benefit from the incumbency effect. Once a woman is elected to parliament, the chances that a woman is nominated as list leader for the same party in the same district in the next election are significantly higher. While previous work has argued that incumbency contributes to the manifestation of female underrepresentation in politics, our results indicate that incumbency also benefits women once a female candidate has won over a male candidate. However, it must be highlighted that the effect size is rather small as the probability increases only from .2 to .4—meaning that a man is still more likely than a woman to lead the list in the following election, despite a woman being the only incumbent on that list.
We have also argued that the open-list PR system in Poland provides an ideal ground for testing the empowerment hypothesis, that is, whether the election of a woman influences the overall gender composition of future lists. We find no evidence of such an empowerment effect, which is in line with the study by Broockman (Reference Broockman2014). This finding might challenge the idea of symbolic representation and instead highlight the importance of enhanced descriptive representation. It should be mentioned, however, that we cannot fully exclude the possibility that the election of a woman makes a difference. For example, it is possible that more women feel motivated to run for office, but gatekeppers keep them from being placed on the list. Also, parliamentary behavior (substantive representation) might differ.
Finally, we found a relationship between the election of women and female candidate selection by other parties. More specifically, we have demonstrated that other parties are more likely to nominate a woman to the top of the list in the next election when the right-wing party PiS elected a woman to parliament in the previous election. A potential causal mechanism behind this finding could be that other parties feel particularly inclined to nominate women at the top of the list as they do not want to appear as misogynistic compared with the right-wing populist party. We also found that the effect is reversed for the election of women for the left-wing party SLD. A potential explanation might be that other parties, particularly right-wing parties, see women as an “electoral disadvantage” and try to gain votes by nominating men to the top of their list in the hope that voters are more likely to vote for a man. While the direct causal mechanisms could not be tested in this study, the findings call for more research on this relationship in the future.
Still, some limitations of this study should be mentioned. One important caveat is that the estimated effects are “local.” This is due not only to the RDD, which identifies the treatment effect only around the threshold, but also to the fact that we had to restrict our estimation sample to a very special subset of the full data set. The generalizability of our findings should be explored in more detail by cross-country studies. Moreover, the strategic responses of other parties to the election of women by a certain party need more attention. While the number of observations in the estimation window was still sufficient for a robust estimation of treatment effects, it would be rewarding to see whether these effects are also found in different contexts.
SUPPLEMENTARY MATERIAL
To view supplementary material for this article, please visit https://doi.org/10.1017/S1743923X19000096