

INTRODUCTION
The information Age. Cyberspace. The images are clean and lean. They offer a vision of business streamlined by smart machines and high-speed telecommunications and suggest that the proliferation of e-commerce and dot-coms will make the belching smokestacks, filthy effluent, and slag heaps of the Industrial Revolution relics of the past. With this in mind communities everywhere have welcomed high technology under the banner of ‘clean industry’, and as an alternative to traditional manufacturing and traditional exploitation of natural resources. (Grossman Reference Grossman2006: 4)
The world is undergoing a large wave of urban population growth with a majority of people living in cities of the developing world. Currently, Africa is the least urbanised but has the fastest rate of urban growth, estimated around 3·3% and 3·7% between 2000 and 2010 (United Nations 2008). However, this is not accompanied by economic growth, job creation and service provision. In Ghana, the process accelerated between 1984 and 2000, following a steady economic decline in the 1970s, when the economy recovered following the adoption of the World Bank/International Monetary Fund (IMF) sponsored Structural Adjustment Programme (SAP) and liberalisation policies (Yankson et al. Reference Yankson, Kofie and Moller-Jensen2004). This culminated in trade liberalisation, privatisation of state-owned enterprises, removal of government subsidies and retrenchment (Owusu Reference Owusu2007). The shrinkage in the formal economy was further propelled by globalisation, increasing unemployment levels and a weakening of the government's capacity to respond to growing poverty (Grant Reference Grant2009). Hence, documenting the impact of privatisation in terms of the changing livelihood strategies through informal e-waste recycling activities has become necessary.
The informal economy, whose recent growth is a direct response to the economic crisis, remains the biggest primary focus for urban residents (Owusu Reference Owusu2007). The International Labour Organization (ILO) (2002) estimates that the sector engages more than 50% of the urban workforce in sub-Saharan Africa (SSA), constituting 78% of non-agricultural employment and 93% of new jobs (Kessides Reference Kessides2005). In Ghana, the private sector remains the largest employer, accounting for two-thirds (66·7%) of employment, with 28·5% in formal public sector employment and 93% in private sector jobs and 22% of gross domestic product (GDP) (GSS 2008). The agricultural sector which employs 55% of the population is being shunned, due to non-remunerative commodity prices (GSS 2008). The situation in northern Ghana is worsened by recurrent ethnic conflicts and difficult climatic terrain that does not guarantee all-year round agriculture and has triggered southwards migration in search of greener pastures. To such a vulnerable society, engagement in informal livelihood strategies and the dispersal of family members geographically is one way for survival. The commonest informal activities such as hawking, head portering (kayayei) and provision of ‘street services’ such as shoe repairs and retail of mobile phone cards, are currently saturated – hence, the emergence of e-waste recycling.
E-waste is a generic term encompassing the end-of-life of EEE such as computers, televisions, cell phones, home appliances, etc. that are of no value to the owner. Today's globalised world is marked by a revolution in the ICT sector which thrives on obsolescence. The increasing use of ICT has stimulated the generation of e-waste, which poses management challenges to many authorities, and Ghana is no exception (Oteng-Ababio & Amankwaa Reference Oteng-Ababio and Amankwaa2013). E-waste has both valuable (e.g. iron, copper, aluminium, gold, platinum) and hazardous substances (e.g. lead, mercury, cadmium, flame retardants). The term recycling is used in this context to comprise scavenging for materials; manual dismantling and sorting; and recovery of valuable components.
This paper posits that a more holistic analysis of the e-waste sector offers balanced insights in terms of environmental health risks and socio-economic benefits. It investigates three issues: the dynamics of e-waste workers within the urban economy; the potential environmental health implications of e-waste recycling; and the coping strategies and the way forward. The paper is organised in seven sections. The introductory part is followed by an overview of waste management in Ghana, and the study area and methodology. Sections 4 and 5 discuss the field results. The final sections draw on the findings to give policy options for consideration.
CONTEXTUALISING WASTE MANAGEMENT IN GHANA
Generally, a chronic problem confronting sub-Saharan African cities including Accra (the capital city of Ghana) is a proliferation of informal settlements, peripheral sprawl and central city tenement, lacking basic infrastructure services with poor sanitation (Boadi & Kuitunen Reference Boadi and Kuitunen2003). Increasingly, cities are beset with unhealthy environmental conditions as the provision of waste management services remains a challenge to central governments (Post Reference Post1999; Fobil et al. Reference Fobil, Armah, Hogarh and Carboo2008). The systems applied are unscientific, outdated and inefficient; population coverage is low; and the poor are marginalised (Medina Reference Medina1997). Therefore, privatisation of solid waste management (SWM) has become more attractive to local authorities. Meanwhile, Post & Obirih-Opareh (Reference Post and Obirih-Opareh2003) consider that ‘… privatisation has benefited consumers in terms of wider coverage, higher frequency, and more reliable services, but [also accept] that there are also a number of drawbacks, notably worsened labour conditions and increased environmental dangers'.
Thus, a key challenge facing Accra is sanitationFootnote 1 and waste management. The Medium-Term Development Plan (MTDP) 2006–2009, of Accra's local government, namely Accra Metropolitan Assembly (AMA), has described the current state of affairs as unsatisfactory and characterised by choked drains, indiscriminate disposal and overflowing central waste containers (AMA 2006).Footnote 2 This situation is attributable to poor conceptualisation of sanitation; inadequate facilities; lack of community action; and more importantly, lack of regular budgetary allocation; and virtual absence of fee-based service provision in low-income areas. As a result, a substantial proportion of the waste generated in Accra is uncollected and ends up in drainage systems and open spaces (Ayee & Crook Reference Ayee and Crook2003). With an estimated population of 24·6 million and average daily waste generation per capita of 0·45 kg, Ghana generates annually about 3·0 million tonnes of solid waste. Accra has a daily waste generation of 1,800 tonnes and average daily per capita of 0·51 kg with daily collection coverage of 1,200 tonnes (67%) (Oteng-Ababio Reference Oteng-Ababio and Kumar2011).
In an attempt to effectively manage waste, AMA has divided Accra into six collection zones. Two types of solid waste collection (SWC) systems operate in the city, namely, house-to-house (HH) and central container collection (CCC). Approximately 20% of the population (high-income neighbourhood) receives weekly scheduled HH collection at a fee from private companies. The remaining 80% (low-income areas) either receives this service through the publicly provided CCC at virtually no cost, or by the Kaya BolasFootnote 3 at between GH¢1·00 (US$0.70) and GH¢3·00 (US$2.04) per collection depending on the waste quantity (Oteng-Ababio Reference Oteng-Ababio and Kumar2011). Currently, the Kaya Bolas are becoming more professional and gaining acceptability in the affluent neighbourhoods. A cross-sectional study by Oteng-Ababio (Reference Oteng-Ababio and Kumar2011) revealed that between 500 and 700 Kaya Bolas operate in AMA, with a daily earning average of GH¢50·00 (US $35.10), compared with the minimum wage of GH¢3·11 (US$ 2·12), a difference of over 1,500%. It must be noted however, that they have to pay for their daily expenses – a toll to city authorities and the hiring of carts, among others. Generally, they are able to collect waste from hitherto inaccessible areas which have been denied formal services technically because of infrastructural constraints.
The prevailing gaps in SWM and the increasing recognition of the Kaya Bola, as well as consumers' motivation to dispose of their used EEE at a fee, triggered by the increasing awareness of the value of e-waste, has brought e-waste recycling to the limelight, a livelihood strategy that was virtually unknown in the Ghanaian urban livelihood vocabulary before the last three to four years (Oteng-Ababio Reference Oteng-Ababio2010). Meanwhile, analysis of environmental and human samples in Agbogbloshie – the e-waste recycling hub in Ghana – shows that backyard recycling has dire environmental health risks (Brigden et al. Reference Brigden, Labunska, Santillo and Johnston2008; Caravanos et al. Reference Caravanos, Clark, Fuller and Lambertson2011). Agyei-Mensah & Oteng-Ababio (Reference Agyei-Mensah and Oteng-Ababio2012) reveal that the workers may be aware of these implications. Yet, evidence from the Agbogbloshie Scrap Dealers Association (ASDA) which represents a self-generated organisation that helps protect the interests of workers at the site suggests that they are not willing to halt the process and will resist any attempt to ban it, apparently because of the dwindling formal sector job opportunities and the fact that e-waste appears to provide a livelihood for thousands of unemployed migrant youth (Prakash et al. Reference Prakash, Manhart, Amoyaw-Osei and Agyekum2010).
While providing valuable inputs in their respective areas, these studies do not comprehensively examine the negative and positive impacts of the practice, targeting more optimal balances in environmental, economic and social performances. Moreover, there is a dearth of knowledge on the complete assessment of how e-waste is managed in the final destination. While there is agreement about the increasing amount of e-waste (in terms of importation) (Grant & Oteng-Ababio Reference Grant and Oteng-Ababio2012), there is considerable disagreement about the relative risk, and whether curtailing trade in EEE will improve conditions or otherwise. This paper contributes to the debate by providing empirical data on the Ghanaian situation, given that the current situation presents many challenges. It envisages an optimal solution for e-waste recycling without compromising livelihoods and environmental health.
STUDY AREA AND METHODOLOGY
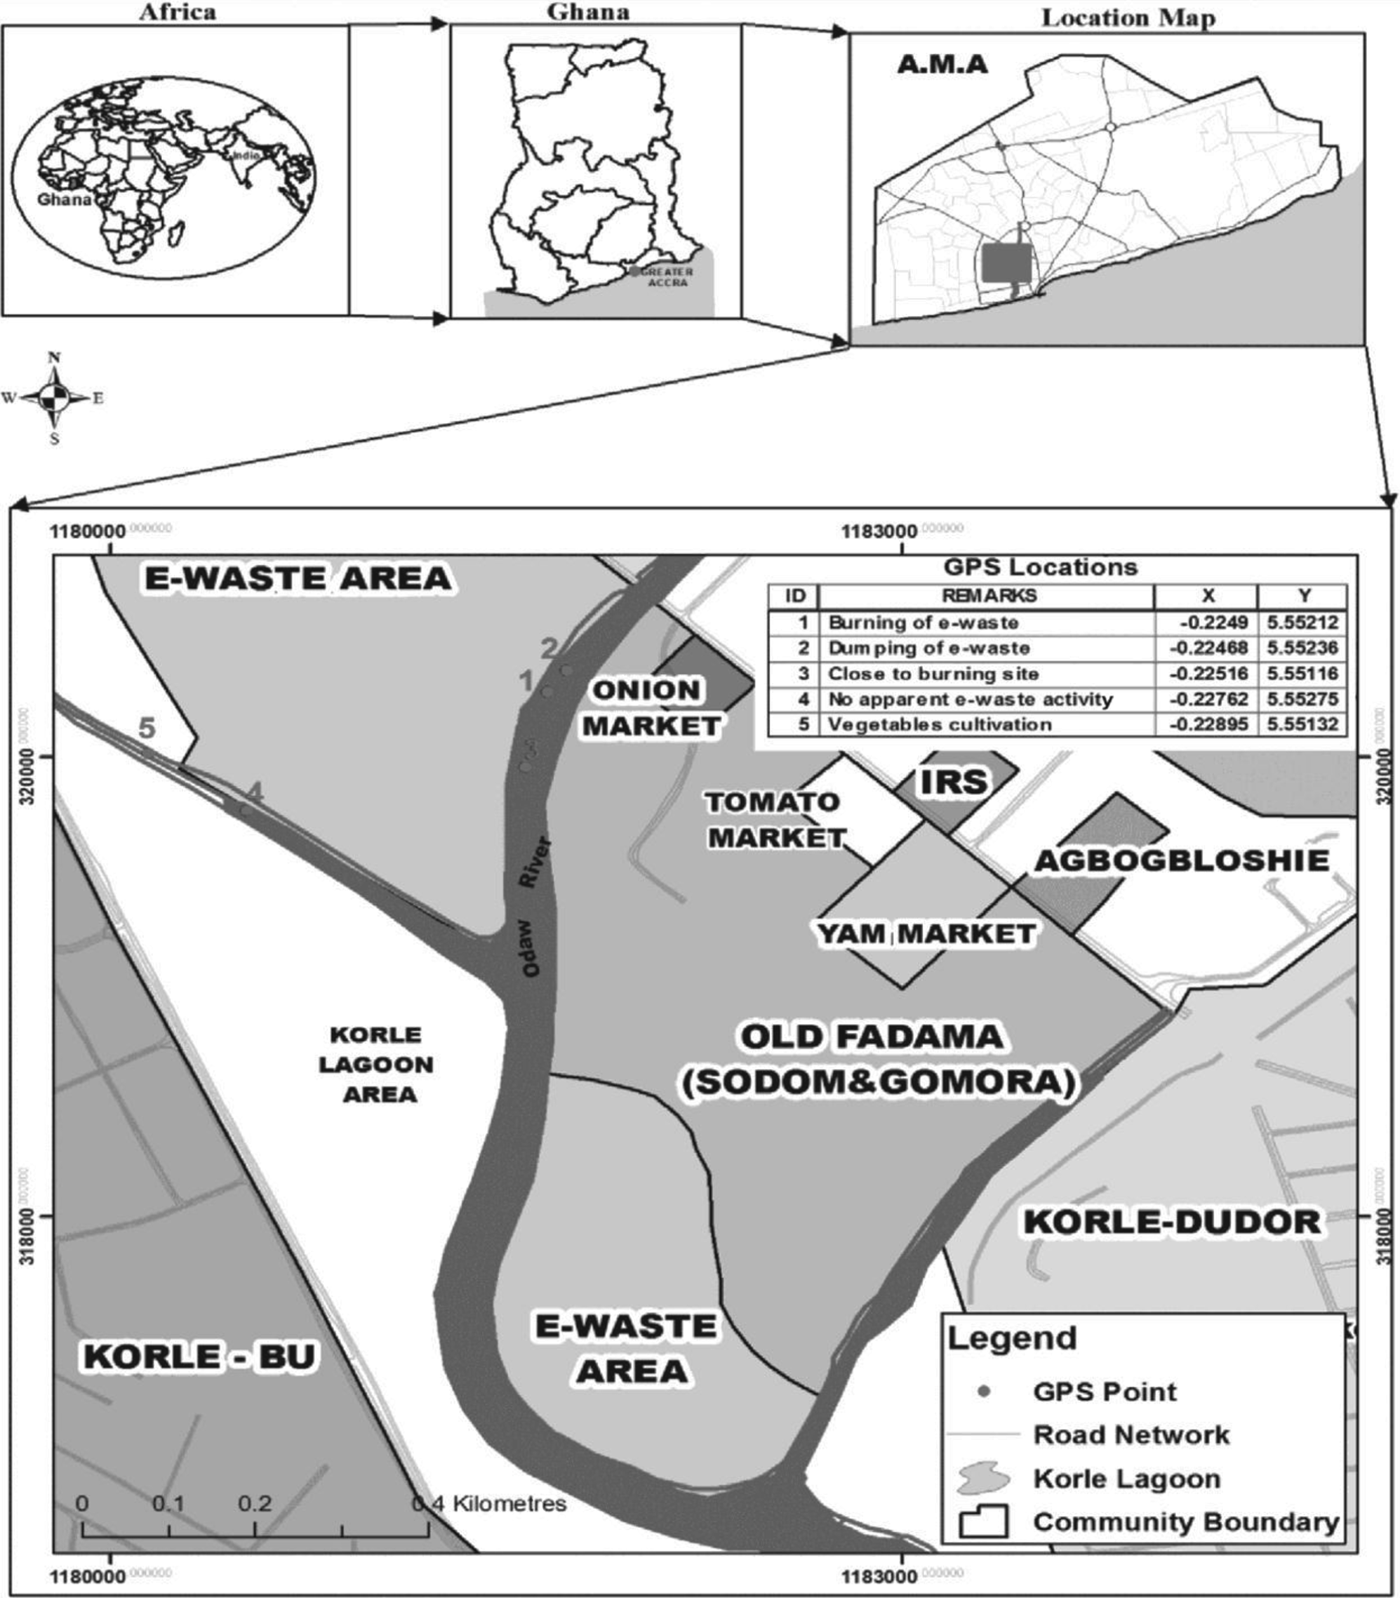
The study area, Agbogbloshie, is situated in Accra. It is a triangle of land 1·4621 km2 in area, bounded by the Abossey Okai road and the Odaw River (in the upper reaches of the Korle lagoon), less than a kilometre from the Central Business District (CBD) (see Figure 1), with an estimated population of 79,684 (People's Dialogue 2010). Its genesis dates back to the early 1980s following the bloody ethnic clashes between Konkomba and Nanumba traders (from Northern Ghana) that triggered migration to the Yam Market in Accra. On another account, the genesis is traced to the eve of the 1992 Non-Aligned Movement (NAM) conference in Ghana, when the city authorities relocated squatters and street hawkers to Agbogbloshie to enable them to construct the conference centre and also give the city a beautiful facelift. The resultant effect was that a new wave of settlement began with every ‘homeless person’ relocating to the area, for its housing affordability, informal job opportunities and existing social capital. E-waste recycling as a work category emerged seven years ago, and checks with ASDA – an umbrella association at the site – reveal that about 1,500 e-waste workers are registered with the association.
Map showing the Agbogbloshie e-waste recycling site

In terms of methodology, a multi-stage cluster sampling technique was employed for the fieldwork. The first step involved a stratification to distinguish six clusters within the e-waste chain of activities: collectors, recyclers, refurbishers, middlemen, scrap dealers and petty traders. This method was selected because variations in the population of workers are within the clusters and not between them; each cluster has its own peculiar dynamics (procedure of entry, start-up capital, networking, etc.). Quota sampling was then applied to the clusters depending on the intensity of the impact of e-waste activities and the concentration of population. This was done with the help of the executives of ASDA who provided an estimated number in each group. Thereafter, random sampling was employed to select respondents in each stratum. A total of 140 questionnaires were administered: 30 collectors, 35 recyclers, 20 refurbishers, 20 middlemen, 20 scrap dealers; and 15 petty traders who provided ancillary services. The questionnaire probed into their socio-economic characteristics, roles in the recycling process, wages, self-identified environmental health risks, and ways of improving the practice. It was administered to the workers personally at the site, which provided the opportunity to observe labour intensities and recycling processes. This included the disassembling and sorting of reusable parts using rudimentary tools, open incineration to retrieve materials, weighing and metal trading.
In addition, five focus group discussions (FGDs) were conducted: two each with workers and ASDA executives and one with People's Dialogue, a Community-Based Organisation (CBO) seeking solution to the problems of informal settlements. Officials responsible for e-waste trade and/or management, including the AMA; Ministries of Trade and Industry, and Health; and the Environmental Protection Agency (EPA) were purposefully selected for in-depth interviews. The interviews covered themes on the magnitude of the trade, their observation about the potential risk, and possible policy options to address the situation. The primary data were computed and analysed with SPSS 17. The analysis was based on the current available recycling technologies and management paths as against the socio-economic and environmental health circumstances of those involved.
E-WASTE WORKERS' PARADISE: EXPLORING THE DYNAMICS
People consume leisure, space and time as if our lives were simply an eating up and a throwing away … it is clear that capitalism, once it is connected to the mass market, is motivated to increase consumption. (Lynch Reference Lynch1990: 148)
Socio-demographic characteristics of respondents
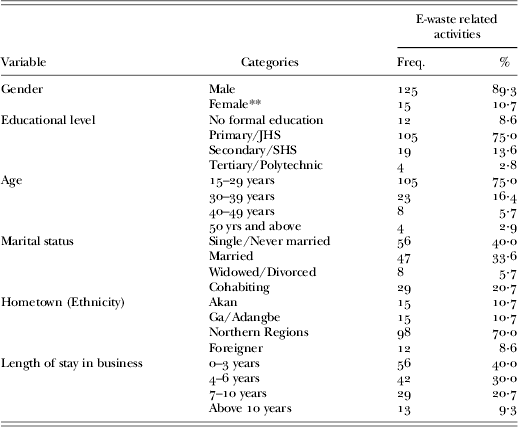
The demographic characteristics of the respondents captured during the survey include gender, education level, age, marital status and home town (see Table 1). The findings reveal that e-waste recycling is male-dominated (89·3%) with only a 10·7% female representation.
Socio-demographic characteristics of respondents.
Source: Field data, 2012.
** Respondents not directly involved in e-waste recycling, i.e. traders, visitors, etc.
Female involvement revolves around petty trading (food, water, drinks), providing other life-support services, as well as trading in refurbished electronics and working equipment (hammers, spanners, screwdrivers, chisels etc.), which is quite a saturated activity. Interactions with key informants revealed an emerging trend where some women move to offices, institutions, auction stations, and other commercial centres to ply their trade and engage in the collection of e-waste. It was realised that in such environments, sales are more often a task given to women.
The findings show that the workers are young: 105 of them (75%) were between 15–29 years. Studies by the ILO (2004) and Lundgren (Reference Lundgren2012) have identified the engagement of children (mostly boys, as young as 5 and mostly between 11 and 18 years old), who are primarily involved in burning activities and manual dismantling after school hours and on weekends, though this study did not report on them. This resonates with an enumeration report stating that Agbogbloshie has a young population with 76·9% aged 35 years or below (People's Dialogue 2010). The Ghana National Youth Policy defines a ‘youth’ as ‘a person who is within the age bracket of 15 and 35’ (Ministry of Youth and Sports 2010). By implication, the age dynamics suggest that e-waste recycling continues to offer opportunities to new entrants, particularly the youth, who see it as a way of accessing instant cash and accumulating wealth.
The educational levels of the respondents show that 12 (8·6%) had no formal education, while 105 (75%) and 19 (13·6%) had primary and secondary education respectively. Only 4 (2·8%) of the respondents, a Ghanaian and three Nigerians had attained tertiary education. Thus, about 89% of the respondents had at least a senior high certificate, which by Ghanaian standards can only guarantee the minimum public sector work that is poorly paid and nearly non-existent. That explains why many find sanctuary at Agbogbloshie e-waste enclave, and it is reflective of the Ghanaian formal employment sector where one's educational background is a likely determinant of job access and income earnings. The findings further show that 56 (40%) of the respondents are single, 47 (33·6%) are married, 29 (20·7%) are cohabiting, and only 8 (5·7%) are divorced or widowed. The seemingly high number (60·7%) of respondents yet to be married is not surprising as a majority of the workers are still youthful and may want to secure good financial status before they enter into marriage. In terms of nationality, 128 (91·4%) of the respondents were Ghanaians, out of which 70% were of northern extraction, while the remaining 12 (8·6%) were of Nigerian, Liberian or Togolese nationality. This confirms the assertion that majority (80%) are migrants who have travelled to Accra in hope of increasing opportunities.
E-waste as a livelihood strategy – an overview
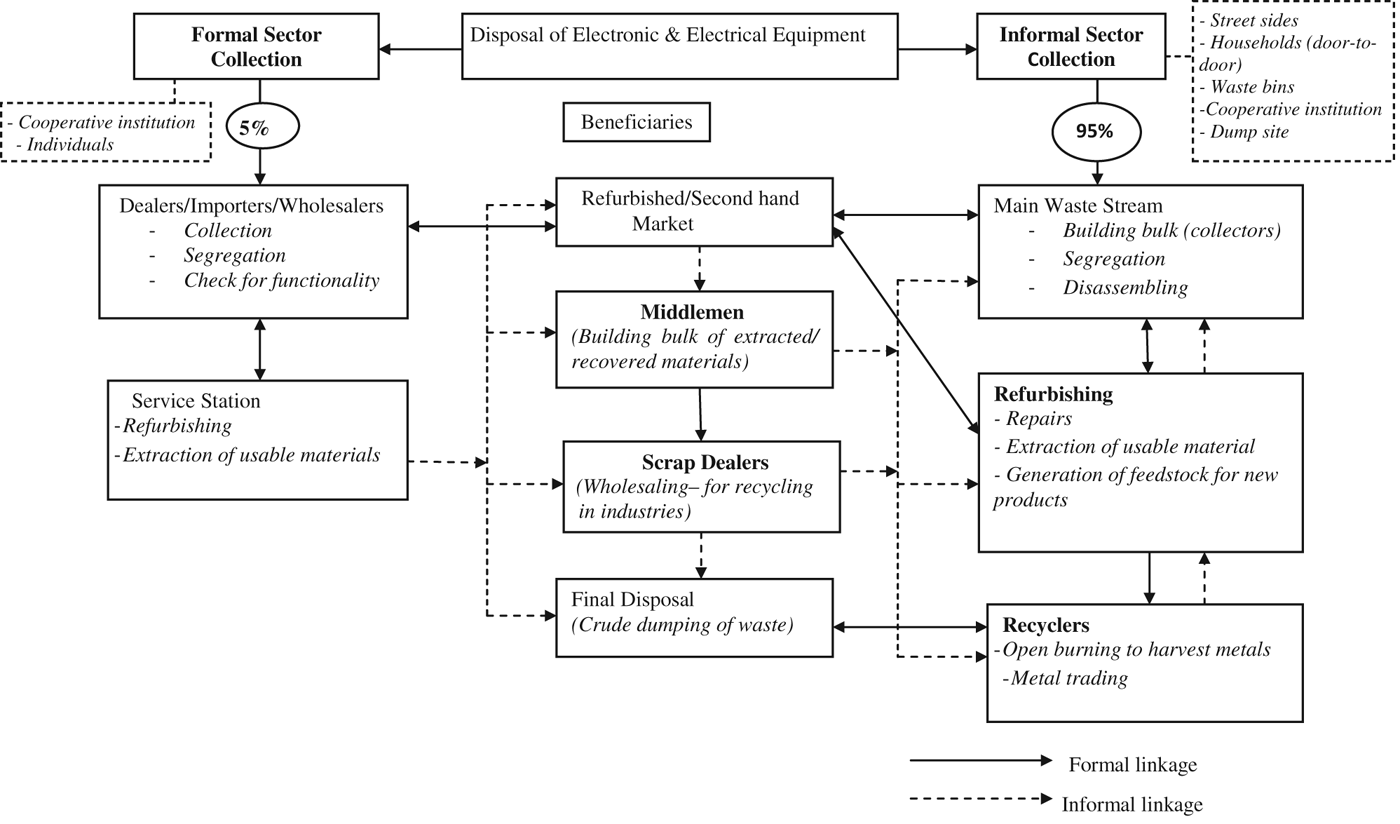
E-waste recycling plays a pivotal role in the urban economy, employing about 4,500 to 6,000 people directly, and indirectly about 20,300 to 33,600 people in Accra. Also, it generates about $105 million to $268 million annually and sustains the livelihood of about 200,000 people nationwide (Prakash et al. Reference Prakash, Manhart, Amoyaw-Osei and Agyekum2010). Figure 2 presents the current recycling practice. As stated earlier, the survey captured six main clusters in the value chain of e-waste recycling.
The current recycling and disposal practices in the study area
Collectors
The findings show that 21·4% of the respondents engage in e-waste collection, which is the first point of entry into the e-waste economy. The collectors also known as ‘Kaya Bola’ are mostly youthful, and their activities involve daily rigorous hours of pulling handcarts and trucks to collect recyclable elements from different parts of the city, including households, mechanic shops, market centres, auction points and institutions to the scrap yard for sale to the middlemen and scrap dealers. In their daily expeditions they decide for themselves where they will go for scavenging, even though that does not guarantee access to goods. Indeed, there are occasions where they return to the scrap yard without any goods or profits on the goods collected. They often work individually or in pairs with their disassembling equipment (hammers, spanners and screwdrivers) and trucks and push carts, which they hire for GH¢2 and GH¢3 daily respectively from the truck market managed by some middlemen at the site. The competitive nature of the business occasioned by increasing youth unemployment and entrance of more prospective collectors produces two consequences. First, it has compelled collectors to extend mining expeditions to ‘unmined’ environments and spend days and build bulk before returning to their base at Agbogbloshie. Second, it has increased consumer awareness of the value and necessitated negotiation for payment of e-waste that hitherto was given for free. The amount is increasing steadily as the market gets saturated with the daily entrance of new migrants. Furthermore, the collection process is not without risk. AzizFootnote 4, one of the collectors, noted:
Not discounting the prospects of scavenging leading to customer networks like becoming shop attendant or a house help, most of us are verbally abused, tagged with all sort of derogatory names and some even fight us because our activities have been outlawed. Even though we do not have the legitimate power, we have to defend our lives. This is the unseen cost we have to pay in the e-waste work environment.
Recyclers
Recycling of e-waste aimed at material recovery is emerging as a lucrative business which stimulates the business to flourish within the value chain. The results show that 25% of the respondents are recyclers, and their activities include manual disassembly and segregation of printed circuit boards (PCB) with IC (integrated circuits) chips, electronic components and connectors (gold-plated terminals). The connectors have valuable metals such as copper, aluminium, silver, gold and tantalum, therefore providing motivation for recycling. Their recovery, however, requires professional skills and expensive equipment which are non-existent.
The knowledge and affordable technology deficiency coupled with the desire for quick money compels recyclers to employ crude methods to isolate copper from the rubber casings through open burning. During the process, workers use insulating foam from dismantled refrigerators or car tyres which are readily available at the site as the main sources of fuel for the fires without any protective wear. This was reflected in a comment by one respondent, Ayaba who stated:
It is unfortunate outsiders only see the thick smoke in the clouds but not the thick economic returns that come with the smoke. We admit the burning process is fraught with risk, yet it is the working environment that poses it and not us. It is only when the authorities recognise this inherent exposure of our work that a possible marriage between e-waste recycling and health safety can be achieved.
The process reveals potential health threats facing the workers in their quest to eke out a living. Though this may possibly result in loss of resources and environmental pollution, it remains a source of livelihood for many of the urban poor because of the quick cash returns it offers.
Refurbishers
Generally, re-use of obsolete EEE is a common practice in Ghana and the most environmentally preferable option in handling e-waste. It is an ‘economic window’ through which many people can access EEE, due to the fact that 28·5% of the population lives below the poverty line (GSS 2008). Beyond affordability, it also conserves energy and raw materials needed to produce new products and reduces pollution associated with energy use and manufacturing. The interaction with stakeholders shows that the refurbishing sector employs over 10,000 people, and according to Prakash et al. (Reference Prakash, Manhart, Amoyaw-Osei and Agyekum2010) between 14,000 and 24,000 people nationwide are involved in this enterprise. The results show that 14·3% of the respondents are refurbishers. Refurbish shops have extensive inventories of accumulated parts to service the re-use cluster as well as the city refurbishers who travel to the area to service or source parts. Refurbishers engage in cleaning and repairing activities in order to make the product more attractive and affordable to the populace, and also cannibalise the unserviceable items for workable components that are used to repair others for the second-hand market.
Middlemen
The middlemen who represent 14·3% of the respondents are intermediaries between collectors, recyclers and scrap dealers. They provide a micro-level and easy market for collectors and recyclers who have gathered relatively small goods and lack the economic advantage to access the scrap dealers market. It was discovered that they adjusted their measuring scales to their advantage (in order to pay lower prices for materials) which accounts for the price disparity between Agbogbloshie and TemaFootnote 5 – an industrial area where the big scrap recycling companies are located. After weighing, cash changes hands and goods enter the stock and are eventually sold to the scrap dealers who in turn sell to companies in Tema. The scrap dealers appear to have gained dominance over Tema market because of their relatively large capital base (to buy bulk quantities, offset overhead cost) and the existing market network. The study revealed an influx of well-financed and better-connected middlemen from Nigeria, Togo and Liberia which has internationalised the e-waste economy. These entrants are adding another dimension to the enterprise by pre-financing the activities of waste collectors and changing the oligarchic position of local scrap dealers. Thus, they provide them with the ‘financial capacity’, though the practice comes with the risk of some absconding.
Scrap dealers
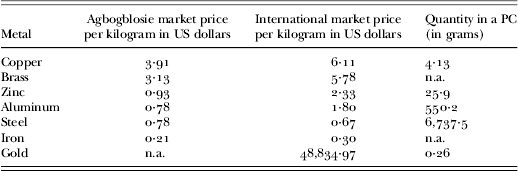
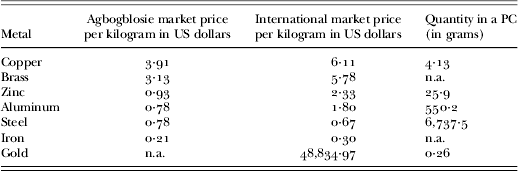
The scrap dealers form an intermediary zone of value addition between collection and final marketing of recovered materials. They constitute 14·3% of the respondents and occupy the highest rank within the value chain at the site. They have their business connected to the urban economy at Tema, where companies promote downstream activities by processing materials from recycled mixed scraps – e-waste and body works of cars – into construction materials such as iron rods and roofing sheets, and household equipment such as cooking utensils and pots, gas cookers, etc. It was interesting to note how the scrap dealers could discern the perceived impact of the global economic crisis on the prices of goods at Tema, as most companies traded in dollars and the fluctuations on the international market meant that prices are not always stable. Additionally, most of the companies are export based (either exporting directly abroad or being used by local industry who may export some of the goods), which suggests that changes in international prices affected the prices at Tema (see Table 2). It can be observed from the table that most local prices with the exception of steel are well below international market prices, which range from 40% to 150% higher than local prices. One can infer that the e-waste market is growing mainly because of the ready markets both internally and internationally, and the high price of its components.
Comparison of local and international metal prices.
Source: Prakash et al. (Reference Prakash, Manhart, Amoyaw-Osei and Agyekum2010); Oteng-Ababio (Reference Oteng-Ababio2012).
Petty traders
Petty traders constitute 10·7% of the respondents and their activities are dominated by women. They are indirectly involved in the chain of e-waste activities through the provision of ancillary services, from life-support to service and entertainment – sale of water and energy drinks, and retailing of either household consumables (tabletop trade) or second-hand clothing and jewellery – for the workers. There is a thriving market for iced-water traders because water is a precious commodity with both domestic and occupational functions – drinking, cooling the recovered metals after burning, and preparing for daily prayers, since around 70% of the e-waste professionals are migrants from the North, who are predominantly Muslims and normally represent marginalised groups from ethnic or religious minorities with about 8 years of experience in the waste profession. A majority of the traders had their young children strapped to their backs as they plied the site, indicating that the health risks may not be limited to workers but also to traders and other actors who constantly stay on the site for business. This may have long-term consequences on health of women and children as studies elsewhere have indicated (Keirsten & Michael Reference Keirsten and Michael1999).
Remuneration and economic viability of e-waste recycling
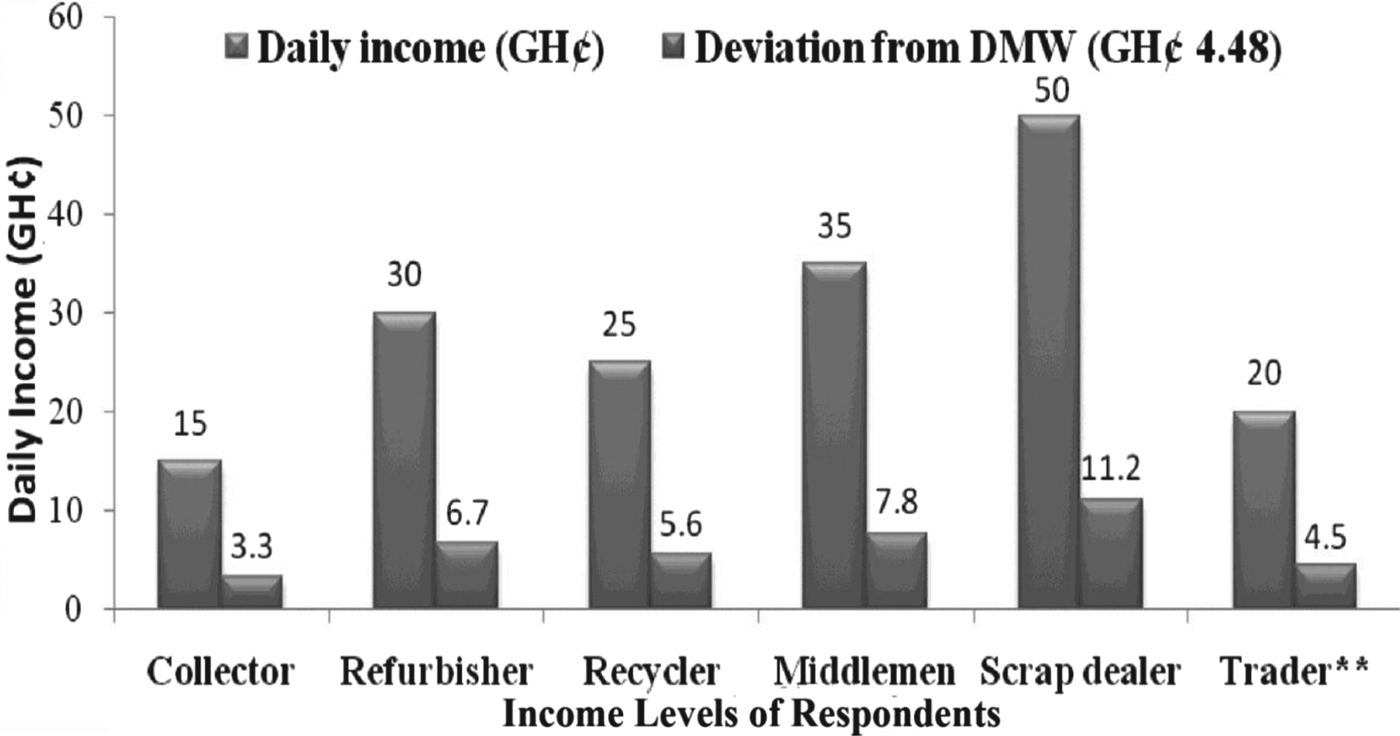
A recent study has shown that unemployment among the economically active population in Ghana is about 17·6% while about 28·5% of the total population lives below the poverty line (GSS 2008). The World Bank (2007) adds that 44·8% of the population lives on less than $1 daily. The results show that waste collectors, who are at the bottom of the value chain, earn on average GH¢ 15 daily, which is very high by Ghanaian standards (see Figure 3). This is because the daily minimum wage (DMW) is GH¢ 4·48Footnote 6 and it implies that collectors earn about three and a half times the average income of most formal workers. As would be expected, collectors who double as recyclers earn even more than GH¢ 25 per day while the occasional collectors (who participate as part-time) earn approximately GH¢ 50 per month.
Daily income distribution of e-waste-related workers.
It must however be stated that one has to treat figures and expenditure generated from operators in the informal economy with caution due to the significant fluctuation in their fortunes and their tendencies to mix business with personal spending. Viewing their earnings against the local economic realities, however, gives a clue why the ‘supposed economic viability’ and the wealth creation in the business are a factor. Generally, a public servant earns an average basic monthly salary of GH¢ 137·28 or GH¢ 0·78 per hour (GSS 2008). All the participants indicated that e-waste recycling is very lucrative, supporting their families/dependents.
Wealth accumulation in the e-waste economy
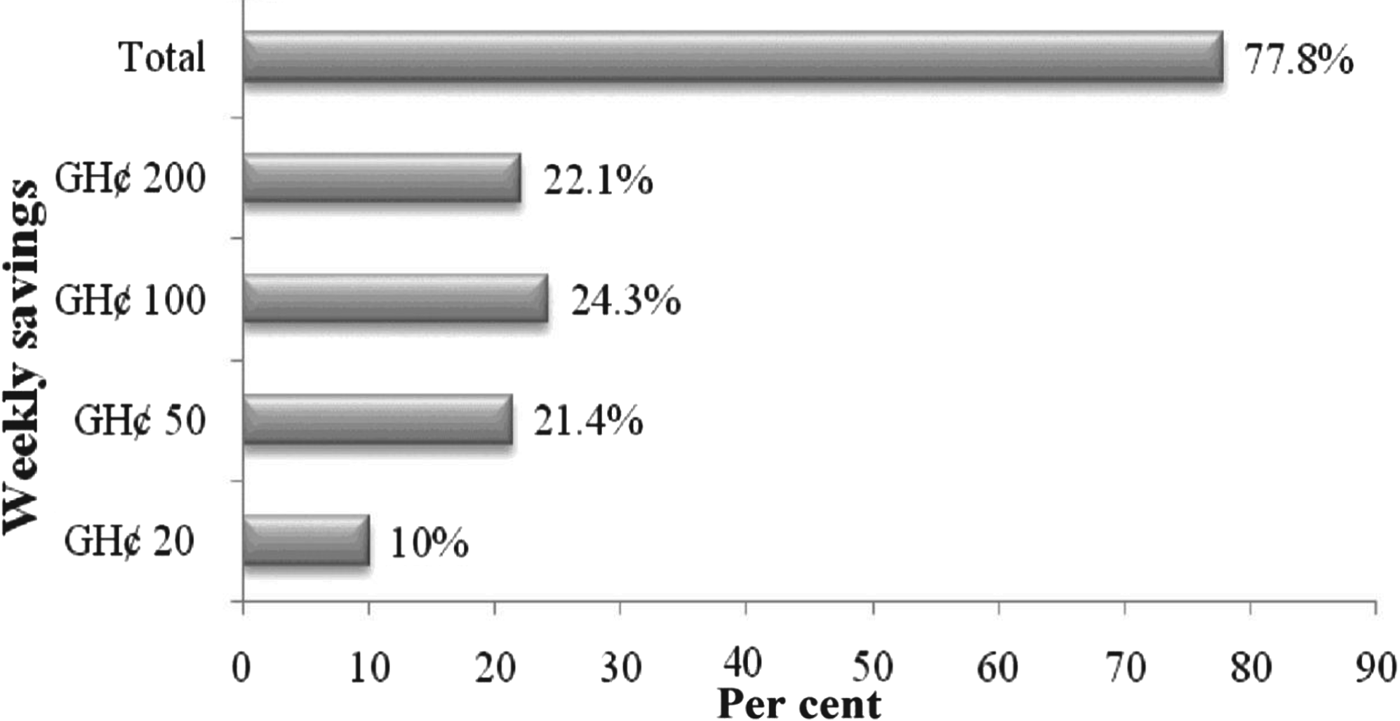
The study further examines the extent to which respondents accumulate wealth, as captured by way of their saving habits and whether they engage with formal or informal banking institutions. Interestingly, about 77·8% responded that they were doing well in terms of creating and accumulating wealth while 22·2% responded otherwise (see Figure 4). The findings reveal very high levels of savings and weekly investments. In all, over 67% of those in the savings category save more than GH¢ 50 per week after all overhead costs have been settled.
Weekly savings of respondents.
During interactions, they revealed that their motivation stems from their irregular earnings and contingencies associated with their business. Also, about 75% of them save with the ‘local susu operators’Footnote 7 (i.e. informal mobile bankers) while the remaining 25% engage with formal banking facilities. Perhaps this group is made up of those who have stayed in the business for a long time, accumulated enough income and might have benefited from some banking facilities. It was realised that 22·2% of the total respondents who do not save do make a contribution to ASDA and enjoy some form of support in times of need. Recounting the successes of those who use the formal banking institutions, Karim, a scrap dealer remarked:
In my early years here, I did not know anything about keeping money with someone else since back in the North I had always lived from hand to mouth. However, after representatives from Ecobank [a private bank] visited us I have not only benefited from their loans in times of emergencies but I also own a life insurance policy for my wife and two children. Even though I keep on spreading this news, people think saving at the bank still remains the preserve of the rich.
UNRAVELLING HEALTH AND ENVIRONMENTAL RISKS OF E-WASTE
Discussions so far have demonstrated that e-waste recycling is an economically viable livelihood strategy albeit laden with health- and environment-threatening possibilities. The study sought to analyse participants' perception on these contrasting tendencies, and finds that about 96% of the respondents perceived the process as posing a health challenge. Explaining why they continue to engage in e-waste recycling despite the perceived implications, they unanimously argued that they have no better alternative sources of livelihood, emphasising that the risks involved are not different from other activities (formal or informal) within the urban milieu.
Respondents' perceived environmental impact
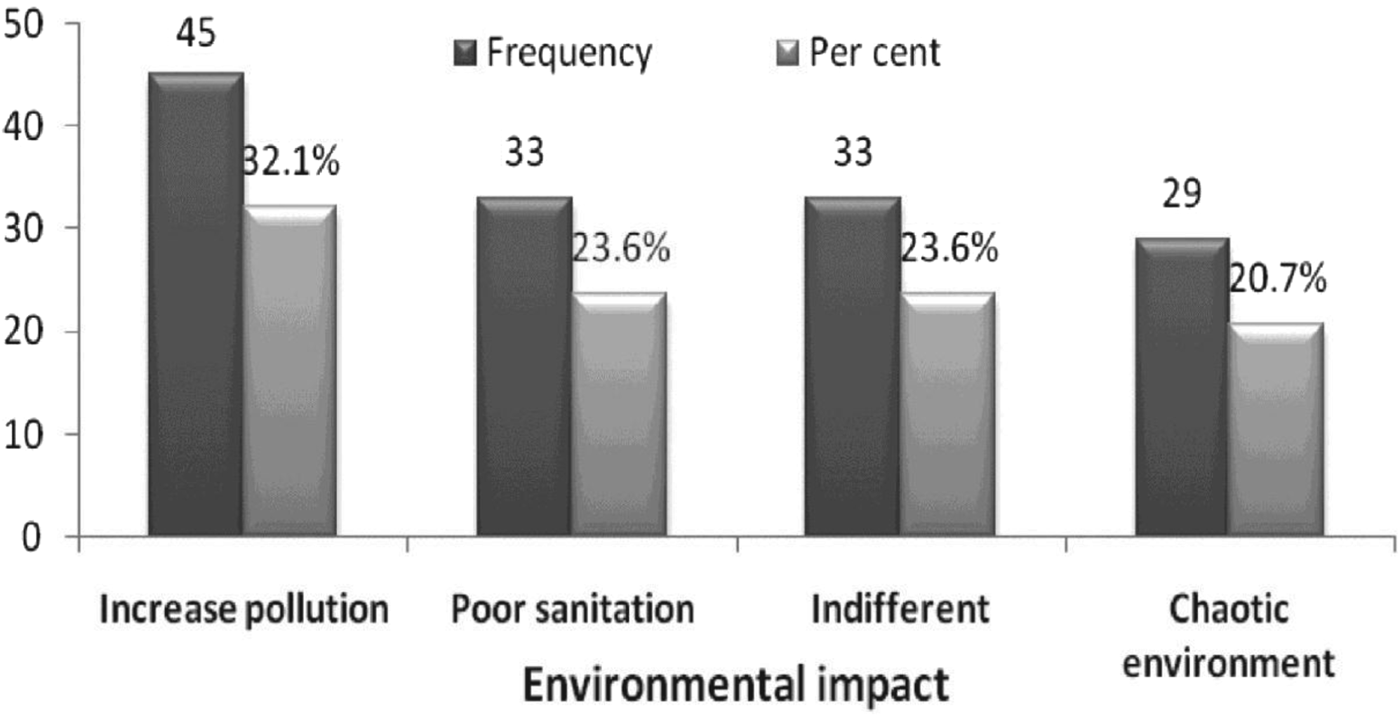
Figure 5 presents respondents' perception on the environmental risks of e-waste recycling. A majority of respondents (32·1%) perceived air pollution from the constant burning of e-waste as the major challenge, followed by poor sanitation (23·6%). This may be due to the fact that AMA does not provide infrastructural services e.g. water, electricity and sanitation facilities to informal settlements, including Agbogbloshie. Also, the low-lying, water-logged nature of the area and its proximity to the Odaw River makes flooding a recurring event whenever there is a heavy downpour. A member of ASDA lamented on the April 2012 drowning incident of a colleague:
One sunny afternoon after a heavy downpour on the previous day, the Odaw River which ordinarily is stagnant had overrun its bank, and one of our colleagues' dropped his money (GH¢ 10). His attempt to retrieve the amount cost him his life.
These conditions are aggravated by the deliberate use of the Odaw River as an outlet for discharging household and human waste. It was realised that most people (including those from outside the community) rather prefer using the open spaces along the Odaw River as ‘free-range’ probably due to the cost involved in accessing the few private toilet facilities. The workers have to pay GH¢ 0·40 for bathing, GH¢ 0·20 for a toilet, and GH¢ 0·10 for a urinal, to the operators of these facilities in order to access them. The findings also show that 23·6% of respondents appeared indifferent to any environmental risk possibly due to the employment generating potential of the enterprise. Such respondents contrasted the ‘alleged’ impact of e-waste recycling with the open dumping of waste and indiscriminate defecating in the area, which they claim to be more environmentally threatening and needed more immediate attention. Thus, the situation cannot be fully attributed to the local population as castigated by the urban populace.
Respondents' perception of environment impact.
Respondents' perceived health impact
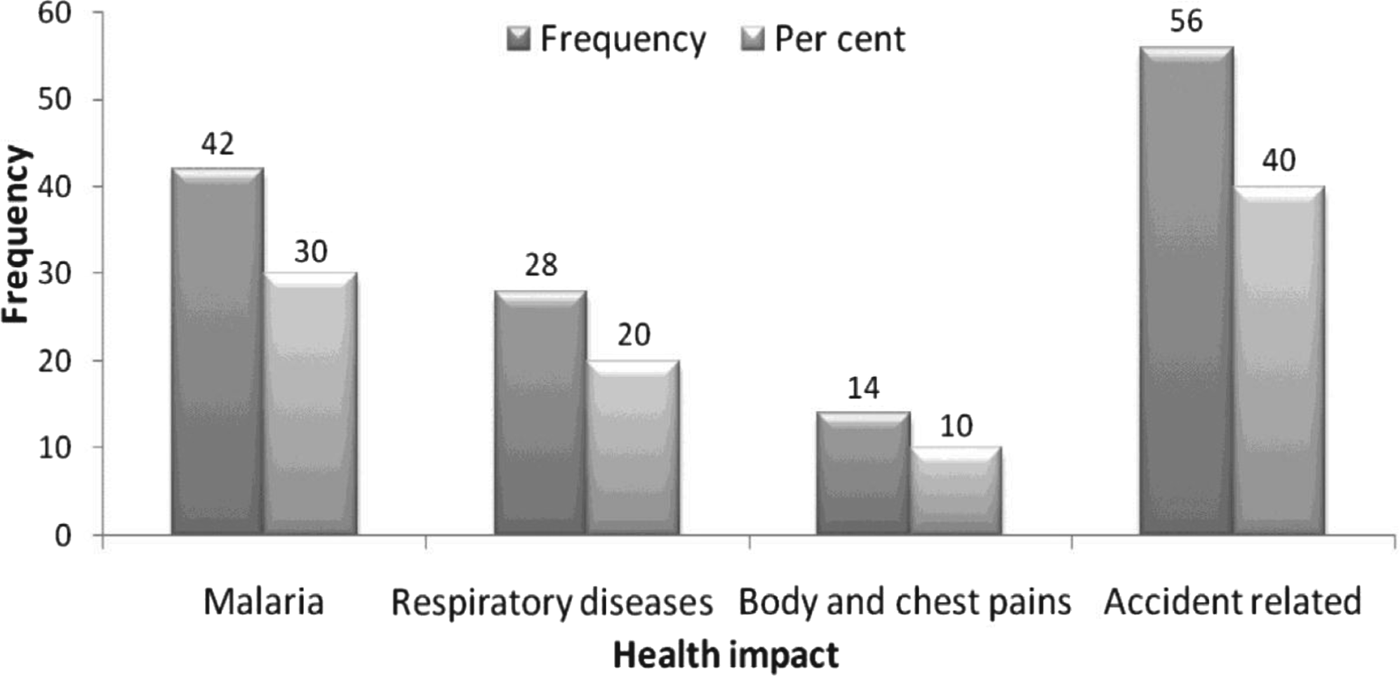
Studies elsewhere have shown that poor e-waste recycling can cause high rates of miscarriages, birth defects and cancer clusters among workers (Keirsten & Michael Reference Keirsten and Michael1999). In Ghana, the Country Environmental Analysis conducted by the World Bank estimates that poor resource management in general costs the country about 10% of GDP, with 4% due to water and air pollution (World Bank 2007) (see Figure 6).
Respondents' perception of health impact.
Significantly, they all alluded to some health effects due to the current practices. Overall, 30% of respondents alluded to the breeding of mosquitoes culminating in the prevalence of malaria. This contradicts the report by Agyei-Mensah & Oteng-Ababio (Reference Agyei-Mensah and Oteng-Ababio2012) about the lower incidence of mosquitoes due to the presence of smoke from burning. The observation could be due to the fact that many of them do not have proper places of abode and are therefore at the mercy of the vagaries of the weather. Also, 40% of respondents reported on accident-related issues and this is to be expected in the collection and recovery processes where incidents such as burns, cuts and other bodily injuries are normally the major health concerns.
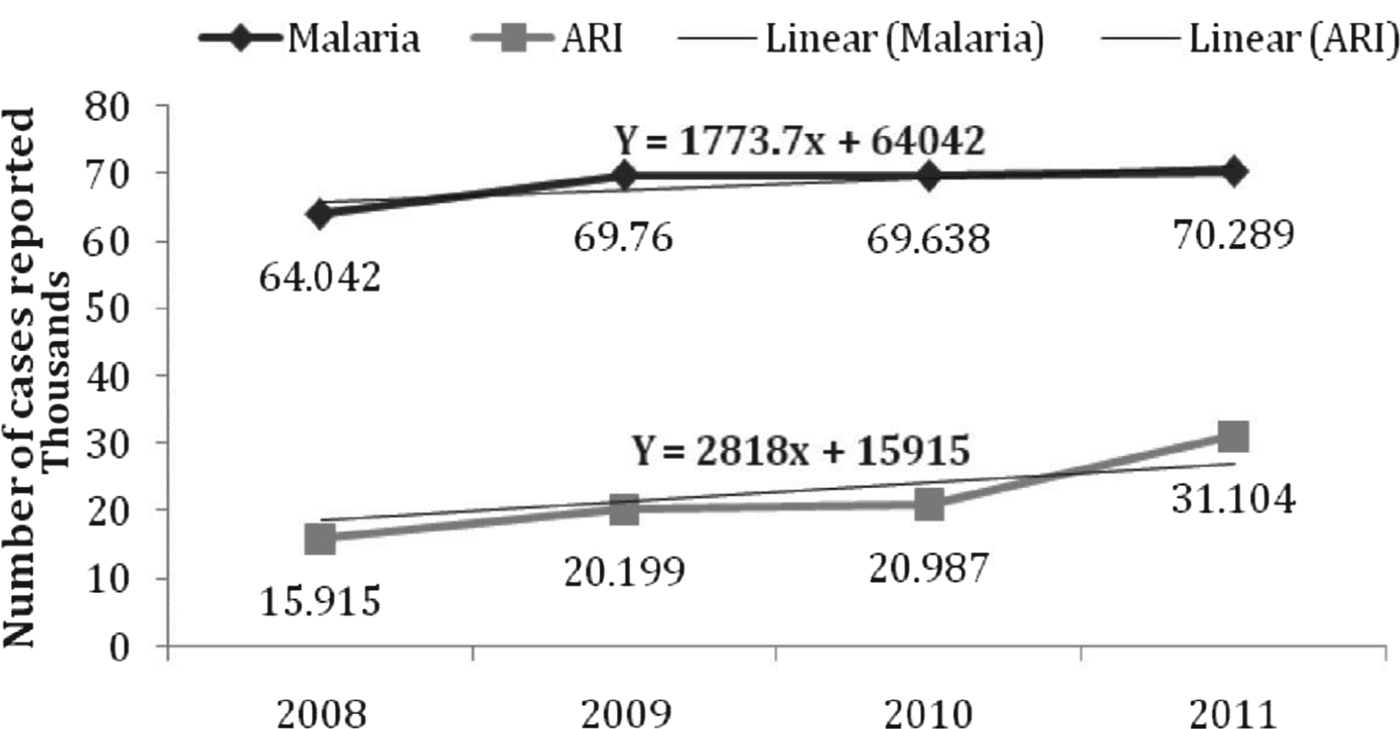
It is important to emphasise that participants failed to mention most of the reported effects of poor e-waste management as reported in the literature. This display of uncertainty or ignorance is not unique to the respondents, as a study by Agyei-Mensah & Oteng-Ababio (Reference Agyei-Mensah and Oteng-Ababio2012) which identified a positive relationship between crude e-waste management and health implications also established participants' ignorance. Checks were conducted at the health records unit of the Ashiedu Keteke Sub-Metro, which collates hospital records from the two public health facilities (Usher Polyclinic and Children's Hospital) within the immediate neighbourhood of Agbogbloshie where most of the respondents are likely to seek medical attention (see Figure 7).
Trends in malaria and ARI diseases at the Sub Metro (2008 to 2011). ARI, Acute respiratory infection.
From Figure 7, it can be seen that reported cases of ARI (Acute Respiratory Infection) increased steadily since 2008, almost three years after the activity had assumed astronomical proportions (Oteng-Ababio Reference Oteng-Ababio2010). Even though malaria is known to be the primary environmentally related disease in Ghana, the findings reveal a higher ARI prevalence rate than malaria. ARI increased from 15,915 in 2008 to 31,104 in 2011, an increase of about 100%. The growth rate indicates that ARI is likely to increase by 2,818 in 2012, while the increase in malaria may reach 1,773. As indicated earlier, the implications of this finding on individual lives and the nation in general are not farfetched (World Bank 2007).
CREATED HOME OR DISPLACED HOPE: IMPROVING E-WASTE RECYCLING
We need to change the dominant paradigm that has prevailed over the past three decades. The lust for faster, smaller and cheaper products must be governed by a new paradigm of sustainability that demands that our products are cleaner, long-lived, up-gradable, and recyclable. (BAN/SVTC 2002)
Stakeholders' perspective
The study engaged some stakeholders from the EPA, Ministry of Health, AMA and NGOs in a number of in-depth interviews and FGDs in the bid to solicit their opinion on how to ensure ‘proper e-waste recycling’. During interactions with officials of the EPA, a Senior Programme Officer disclosed that the challenge of e-waste disposal control was being compounded by the lack of management guidelines. He stated:
Currently, there are no effective mechanisms to regulate the generation, collection, storage, transportation, importation and exportation of e-waste, which would ensure an environmentally friendly recycling regime. It is our hope that the draft bill at cabinet passes the necessary legal requirements and the process expedited to come to fruition.
It was however discovered that the Agency is sensitising the workers and the general public about the possible risks through education and public forums, at the national, regional and community levels. Participants in FGDs from the health sector suggested the establishment of an e-waste collection system and a control on how copper is harvested through burning. They advocated the building of an environmentally sound refurbishment and recycling plant (in the long term), and promulgation of e-waste legislation for mandatory provisions reducing hazardous substances as well as encouraging producer responsibility.
It was revealed that officials of AMA have been pushing for the eviction of the squatters over the years without success. One official remarked: ‘We think that Agbogbloshie must go. There are no toilets, bathing, and urinal facilities and rooms are overcrowded with some numbering to 10 people. Do you think human beings should be left to live in such conditions?’
An Executive Director of People's Dialogue on Human Settlement, however expressed a contrary view to the comment by the Assembly:
Agbogbloshie is currently home to nearly 80,000 people. It remains a job and income generation point. You cannot say because the squatters are trespassing on governments' land, they cannot have access to education, water and other necessities of life. The truth of the matter is that eviction would deny the people of their income and livelihood source. The poor are in the city because they want to eke a living.
The community's perspective
As already noted, the informal e-waste recycling sector provides jobs to thousands of people and supports the formal waste management agencies. Many participants objected to any attempt to disband their operations. They however called for the rationalisation of their work, possibly through the formation of cooperatives preferably around their institutionalised Association – ASDA – as an important option for achieving sustainable e-waste management. Membership is open to all but not compulsory and no requirement is needed. New entrants obtain association membership at a cost of GH¢ 6·00 ($3.16) and are supposed to pay monthly dues of GH¢1 ($0.53). For the youthful, vulnerable and inexperienced workers, membership offers ‘temporary shelter’ and solidarity. A member cited economic, social and security benefits of joining the Association, adding:
We enjoy support in the form of money and companionship especially during ‘outdoorings’, marriages, funerals, etc. and more importantly, we sometimes use the Association as a guarantor when we cannot readily pay for materials (e-waste). We also fall on it when we have police cases.
CONCLUSION
Admittedly, the evidence so far suggests that e-waste recycling practices are not only complex, but they also manifest themselves at different scales in terms of impact on livelihood, environment and health risk. First, in environmental terms, the collection, processing and trading of e-waste contribute to resource conservation as well as reducing the use of primary raw materials by making recovered valuable materials available for re-use. Second, the economic viability of the venture is evident through the creation of employment and income opportunities with economic enticement which appears more attractive to majority of the urban poor who are mostly migrants from deprived areas. Its contribution to reducing cost of transportation and saving government expenditure for waste disposal cannot be overemphasised. Finally, the e-waste enterprise manifests a social function because it offers a better opportunity for accumulating capital and provides a platform for social cohesion and network building e.g. through the scrap dealers association. This function transcends from the local site to sustaining ties with external relations that are mostly left at the place of origin.
The above notwithstanding, the study also highlights some environmental and health tendencies and indicates that the risk perceptions among respondents are consistent with the findings of earlier studies. However, if their operations are organised into cooperatives, it will become an effective means of improving the income, health, working and living conditions of workers. It will also provide a formidable force that will represent the workers at the local level and thereby partnering government to fashion appropriate means without creating disaffection to both parties. This consensus unites with the proposal of Oteng-Ababio & Amankwaa (Reference Oteng-Ababio and Amankwaa2013) for a ‘federated model’ that integrates the formal and informal sectors on the principle of comparative advantage. They envisage a situation where the informal sector is encouraged to concentrate on the collection, disassembly and segregation of e-waste, in which they have adequate knowledge, experience and networks, whereas the formal sector concentrates on managing the upstream processing of the computer motherboards, etc. which requires huge capital, specialised skills, technology and expertise.
For policy makers and metropolitan assemblies to remain an effective urban development authority, they need to appreciate the fact that informality is not a problem to urban development per se, but it is part of the urbanisation process which needs to be ‘nurtured’ and inculcated in the scheme of planning. Otherwise, those within the informal sector will make their presence felt by all means in the urban economy, albeit in a negative way. For example, Gill's (Reference Gill2007) study on the waste recovery market in India recounts that the erroneous conclusions about the e-waste sector result partly from the problematic, limited focus of studies on selective groups engaged in the waste chain. They also result largely from a failure to take a political economy approach to understanding the differential nature of each exchange relationship and consequently, to derive relevant and feasible policy recommendations. This present study concurs that any attempt to jeopardise recyclers' continued access to livelihoods, without undertaking the task of reforming the geographic origins, occupational specificities and underlying institutional realities that gave rise to inequitable outcomes in the first place, will ultimately meet with abject failure.