1. Introduction
An unstable heated liquid layer penetrating into a stably stratified fluid layer is known as penetrative convection, which is closely linked with geophysical (Townsend Reference Townsend1964; Deardorff, Willis & Lilly Reference Deardorff, Willis and Lilly1969; Tennekes Reference Tennekes1973) and astrophysical systems (Brummell, Clune & Toomre Reference Brummell, Clune and Toomre2002). A well-known example of penetrative convection is stellar convection, which is thought to play an important role in the mass-momentum transport in the tachocline (Dintrans et al. Reference Dintrans, Brandenburg, Nordlund and Stein2005). Penetrative convection can be caused by a parabolic base temperature profile due to internal heating (Goluskin & Spiegel Reference Goluskin and Spiegel2012; Goluskin & van der Poel Reference Goluskin and van der Poel2016) or a complicated dependence between the liquid density and the temperature (Veronis Reference Veronis1963; Musman Reference Musman1968; Payne & Straughan Reference Payne and Straughan1987; Lecoanet et al. Reference Lecoanet, Le Bars, Burns, Vasil, Brown, Quataert and Oishi2015; Toppaladoddi & Wettlaufer Reference Toppaladoddi and Wettlaufer2018; Wang et al. Reference Wang, Zhou, Wan and Sun2019). The present work will focus on the second case, i.e. penetrative convection due to a nonlinear constitutive relationship between the liquid density and temperature.
Thermal convection of water is a good candidate for penetrative flow since the density maximum occurs at  $T_M=4\,^{\circ } \text {C}$ (higher than the icing point). Unlike the classical Boussinesq assumption, where the density
 $\rho$ is assumed to be linearly dependent on the temperature difference, the water density
 $\rho$ near
 $T=T_M$ is nonlinearly dependent on temperature difference
 $T-T_M$ as follows (Gebhart & Mollendorf Reference Gebhart and Mollendorf1977):
 \begin{equation} \rho=\rho_0 (1-\beta|T-T_M|^{q}), \end{equation}
where  $\beta >0$ is the thermal expansion coefficient and
 $\rho _0$ is the density at
 $T=T_M$. For the classical Rayleigh–Bénard convection, the exponent is
 $\rho =\rho _0(1-\alpha (T-T_M))$. Historically,
 $q=2$ was chosen as the empirical exponent for penetrative convection in most previous studies (Veronis Reference Veronis1963; Musman Reference Musman1968; Payne & Straughan Reference Payne and Straughan1987; Lecoanet et al. Reference Lecoanet, Le Bars, Burns, Vasil, Brown, Quataert and Oishi2015; Toppaladoddi & Wettlaufer Reference Toppaladoddi and Wettlaufer2018). Very recently, Wang et al. (Reference Wang, Zhou, Wan and Sun2019) adopted
 $q=1.895$ from experiments (Gebhart & Mollendorf Reference Gebhart and Mollendorf1977). In this study, we adopt
 $q=2$ because it is more convenient for analysis, e.g. deriving a rigorous upper bound on the heat flux (see Appendix A). But it should be noted that the quadratic constitutive relation is accurate around
 $4\,^{\circ }\text {C}$ but it deteriorates when the water temperature is high, e.g. it causes approximately
 $10\,\%$ error at
 $14\,^{\circ }\text {C}$.
The temperature  $T_M$ can be lower than the bottom-wall temperature
 $T_{bot}$ but higher than the top-wall temperature
 $T_{top}$. In such a situation, the flow is unstably stratified in the lower layer (
 $T_M\le T\le T_{bot}$) and is stable in the upper layer (
 $T_{top}\le T\le T_M$). Linear stability analysis of penetrative flow was pioneered by Veronis (Reference Veronis1963), who considered a heated liquid layer bounded by two stress-free plates. He found that the instability is suppressed by increasing the thickness of the stable layer and the heat transfer efficiency is lowered by the stable layer due to the appearance of multiple convection cells arrayed in the wall-normal direction. He also noted that any finite-amplitude disturbance near the stable–unstable interface (
 $T=T_M$) will develop into a thicker unstable layer (Veronis Reference Veronis1963). Musman (Reference Musman1968) and Moore & Weiss (Reference Moore and Weiss1973) obtained non-trivial solutions below the critical linear instability, which is not possible in the classical Rayleigh–Bénard problem (Joseph Reference Joseph1976; Ahlers, Grossmann & Lohse Reference Ahlers, Grossmann and Lohse2009). It was conjectured that the subcritical instability is independent of the velocity boundary conditions, i.e. subcritical transition can also be observed when the stress-free boundary conditions at the top and bottom walls are replaced by no-slip boundary conditions. However, there has been no detailed examination of this conjecture over the past years, which will be investigated in this paper.
Most early studies on penetrative convection were conducted at low Rayleigh numbers ( $Ra$). Recently, direct numerical simulations (Lecoanet et al. Reference Lecoanet, Le Bars, Burns, Vasil, Brown, Quataert and Oishi2015; Toppaladoddi & Wettlaufer Reference Toppaladoddi and Wettlaufer2018; Wang et al. Reference Wang, Zhou, Wan and Sun2019) have pushed the study of turbulent penetrative convection between two non-slip planes into the high-Rayleigh-number regimes, aiming at understanding the influence of the stable layer's thickness on the turbulent heat flux across the liquid layer. The numerical results demonstrated that the global heat flux across the liquid layer is reduced by the stably stratified layer. The heat flux was found to be dependent on the domain size (Wang et al. Reference Wang, Zhou, Wan and Sun2019), i.e. the convection cell size was found to have a significant impact on the heat transfer. The convection cell size effect has been recently reported by direct numerical simulations of the classical Rayleigh–Bénard convection, in which multi-turbulent states of different numbers of convection cells arrayed in the horizontal direction were found (Wang et al. Reference Wang, Verzicco, Lohse and Shishkina2020). For small aspect ratios, multiple states with different convection cells arrayed in the wall-normal direction were observed in the classical Rayleigh–Bénard convection as well (van der Poel, Stevens & Lohse Reference van der Poel, Stevens and Lohse2011). However, multiple states with different convection cells in two-dimensional (2-D) classical Rayleigh–Bénard convection at the critical aspect ratio predicted by the linear instability,
 $L=2$, are not seen in numerical simulations and only a pair of large convection cells was reported even at very high Rayleigh numbers (Zhu et al. Reference Zhu, Mathai, Stevens, Verzicco and Lohse2018). This is a significantly different feature from penetrative convection, in which the subcritical nature of penetrative convection should admit different types of solutions even if the aspect ratio is critical (see figure 4 of the present study). But it remains unknown what flow field can transfer more heat in penetrative convection.
To understand the physics of turbulent heat transfer in the classical Rayleigh–Bénard convection, early research works assumed that turbulence wants to maximize the heat transfer, which resulted in a variational problem. An upper bound on turbulent heat flux was derived from the variational problem. This approach was established by Malkus (Reference Malkus1954) and Howard (Reference Howard1963) for the classical Rayleigh–Bénard convection and was extended to plane Couette flow by Busse (Reference Busse1969) (referred to as the MHB formulation). In the 1990s, an alternative approach, called the ‘background’ method, was introduced by Doering & Constantin (Reference Doering and Constantin1992, Reference Doering and Constantin1994, Reference Doering and Constantin1996) to produce a rigorous upper bound on energy dissipation in shear flows and an upper bound on heat transport in the classical Rayleigh–Bénard convection. This method decomposes the physical field into a steady background field and an arbitrary fluctuation field and has the advantage that even a trial background field can yield an upper bound. Kerswell (Reference Kerswell1997, Reference Kerswell1998) proved that the ‘background’ approach yields a minimization problem, which is complementary to the maximization problem in the MHB formulation. It is as yet unknown how the stably stratified layer affects the bound on heat transport in penetrative convection. Is the bound on heat transport higher or lower than the bound  $Nu\le 0.026Ra^{1/2}$ (where
 $Nu$ is the Nusselt number) on heat transport in the classical Rayleigh–Bénard convection? A quick answer to this question in Appendix A shows that the bound on heat transport is lowered by the stably stratified top layer but the power exponent remains the same as for the classical Rayleigh–Bénard convection. It is noted that the upper bound on heat flux is at least an order higher than the numerical and experimental data at high Rayleigh numbers. Recent study by Ding & Kerswell (Reference Ding and Kerswell2020) demonstrated that the upper bound derived from the background method, however, is not observable, because there is no steady state satisfying the momentum equation.
In a different approach, Waleffe, Boonkasame & Smith (Reference Waleffe, Boonkasame and Smith2015) and Sondak, Smith & Waleffe (Reference Sondak, Smith and Waleffe2015) solved the 2-D optimal steady solutions of the full Boussinesq equation for the classical Rayleigh–Bénard convection. The 2-D optimal solution was optimized by varying the width of one pair of convection cells (the aspect ratio  $L$), which was tracked from the linear stability point (
 $Ra=1708$) and continued to high Rayleigh number till
 $Ra=10^{9}$. A surprising feature of the 2-D optimal steady solution is that it yields the same scaling of heat transfer as most experimental data of three-dimensional (3-D) turbulent Rayleigh–Bénard convection:
 $Nu\sim Ra^{0.31}$. A recent study of 3-D multi-scale steady solutions in a fixed cubic box, bifurcated from the 2-D stationary rolls, also showed that
 $Nu\sim Ra^{0.31}$ and the 3-D steady solution captures many statistical features of turbulent flows (Motoki, Kawahara & Shimizu Reference Motoki, Kawahara and Shimizu2020) (actually, the heat transfer by the 3-D hierarchical flow field is very close to the 2-D optimal solution). Both the 2-D and 3-D steady solutions indicate that
 $Nu\sim Ra^{0.31}$, which is independent of the Prandtl number. The computation of the 2-D optimal solution shows that the scaling of heat transfer is more consistent with the simple theoretical prediction by Malkus (Reference Malkus1954),
 $Nu\sim Ra^{1/3}$, rather than the ultimate scaling by Kraichnan (Reference Kraichnan1962),
 $Nu\sim Ra^{1/2}$. Recent computations of steady states have shown that Malkus's
 $Ra^{1/3}$ scaling can be achieved asymptotically at higher Rayleigh number (
 $Ra>10^{9}$) (Chini & Cox Reference Chini and Cox2009; Wen et al. Reference Wen, Goluskin, LeDuc, Chini and Doering2020; Wen, Goluskin & Doering Reference Wen, Goluskin and Doering2020). Indeed, the
 $Ra^{1/3}$ scaling was also proposed in penetrative convection by Veronis (Reference Veronis1963). However, the 2-D direct numerical simulations showed that the heat transfer via a 2-D turbulent flow field is close to
 $Ra^{1/4}$, which is much lower than
 $Ra^{1/3}$ (see Toppaladoddi & Wettlaufer Reference Toppaladoddi and Wettlaufer2018). In this paper, we follow Waleffe et al. (Reference Waleffe, Boonkasame and Smith2015) and Sondak et al. (Reference Sondak, Smith and Waleffe2015) and aim to examine if there exists a 2-D optimal steady solution that can touch or exceed the
 $Ra^{1/3}$ scaling in penetrative convection. In addition, we shall examine if the Prandtl number has a significant impact on the optimal solutions.
The rest of the paper is organized as follows. Section 2 formulates the problem mathematically and presents the dynamical systems theory approach to the 2-D steady solutions. Section 3 presents the results of steady solutions, which bifurcate from the linear stability of a stationary base state. The subcritical instability is discovered and the influences of the thickness of the stable layer and the Prandtl number on the steady solutions are examined. The 2-D optimal heat transfer is further sought by varying the aspect ratio in § 4, in which the relationship between the optimal heat transfer and the Rayleigh number will be discussed and the influences of the thickness of the stable layer as well as the Prandtl number will be investigated. A conclusion is given in § 5.
2. Mathematical formulation and numerical method
By introducing the liquid depth  $d$ as the length scale,
 $\Delta T=T_{bot}-T_{top}$ as the temperature scale,
 $\kappa /d$ (with
 $\kappa$ being the thermal diffusivity) as the velocity scale and
 $d^{2}/\kappa$ as the time scale, we obtain the following dimensionless equations for the 2-D penetrative convection:
 \begin{gather} \boldsymbol{\nabla}\boldsymbol{\cdot}\boldsymbol{u}=0, \end{gather}
 \begin{gather} \partial_t\boldsymbol{u}+\boldsymbol{u}\boldsymbol{\cdot}\boldsymbol{\nabla}\boldsymbol{u} ={-}\boldsymbol{\nabla}p+Pr\nabla^{2}\boldsymbol{u}+PrRa(\theta-\theta_M)^{2}\boldsymbol{e}_z, \end{gather}
 \begin{gather} \partial_t\theta+\boldsymbol{u}\boldsymbol{\cdot}\boldsymbol{\nabla}\theta=\nabla^{2}\theta. \end{gather}
Here  $\theta =(T-T_c)/\Delta T$ is the dimensionless temperature,
 $Ra:=\beta g(\Delta T)^{2}d^{3}/\nu \kappa$ (with
 $\beta$ being the thermal expansion coefficient) is the Rayleigh number and
 $Pr:=\nu /\kappa$ (with
 $\nu$ the kinematic viscosity) is the Prandtl number. Here
 $\theta _M=(T_M-T_c)/\Delta T$ describes the maximal density effect and
 $\theta _M=0\ (\theta _M=1)$ indicates that the maximal density is located at the top (bottom) boundary, respectively. When
 $\theta _M=1$, the conduction state is stable for all
 $Ra$.
The boundary conditions for  $\boldsymbol {u}$ and
 $\theta$ are
 \begin{equation} \boldsymbol{u}|_{z=0,1}=\boldsymbol{0},\quad\theta|_{z=0}=1,\quad \theta|_{z=1}=0. \end{equation}
The heat flux is characterized by a Nusselt number defined as
 \begin{equation} Nu:=1+\langle w\theta\rangle=\langle |\boldsymbol{\nabla}\theta|^{2}\rangle, \end{equation}
where  $\langle (\cdot )\rangle =\lim _{\mathcal{T}\rightarrow \infty }({1}/{\mathcal {T}L})\int ^{\mathcal {T}}_0\textrm {d}t\int ^{L}_0\int ^{1}_0(\cdot )\,\textrm {d}x\,\textrm {d}z$ is the spatial–temporal average.
The aim of this paper is to find the exact steady solutions of (2.1)–(2.3) subject to the boundary conditions. We apply the dynamical systems theory approach and denote the solution of (2.1)–(2.3) as  $\boldsymbol {q}=(\boldsymbol {u},\theta )^{\textrm {T}}$, which obeys the following evolution law:
 \begin{equation} \boldsymbol{q}_t=\boldsymbol{\mathscr{F}}^{t}(\boldsymbol{q}_0). \end{equation}
Here  $\boldsymbol {q}_0$ is the initial condition and
 $\boldsymbol {q}_t$ is the state at time
 $t$;
 $\boldsymbol {\mathscr {F}}^{t}$ is an operator integrating the initial condition
 $\boldsymbol {q}_0$ subjected to the governing equations (2.1)–(2.3) from
 $t=0$ to time
 $t$. Hence, to find the steady solutions, it is equivalent to find the solutions satisfying
 \begin{equation} \boldsymbol{q}_t-\boldsymbol{q}_0=0,\quad \forall t. \end{equation}
The system is invariant under the following transformation,
 \begin{equation} u({-}x,z)={-}u(x,z),\quad w({-}x,z)=w(x,z),\quad \theta({-}x,z)=\theta(x,z). \end{equation}
In this paper, we only consider the solutions that have the above mirror symmetry. Note that, due to the quadratic term  $(\theta -\theta _M)^{2}$, the centro-reflection symmetry (or shift-reflection symmetry), which is in the classical Rayleigh–Bénard convection (Sondak et al. Reference Sondak, Smith and Waleffe2015; Wen et al. Reference Wen, Goluskin, LeDuc, Chini and Doering2020), is lost.
To improve the guess of  $\boldsymbol {q}_0$, the Newton method is applied to (2.7):
 \begin{equation} \left(\frac{\partial\boldsymbol{q}_t}{\partial\boldsymbol{q}_0}-\boldsymbol{I}\right)\delta\boldsymbol{q}_0 ={-}(\boldsymbol{q}_t-\boldsymbol{q}_0). \end{equation}
We employ the Krylov subspace method to approximate the solution of  $\delta \boldsymbol {q}_0$:
 \begin{equation} \mathscr{K}=\{\boldsymbol{b},\,\boldsymbol{J}\boldsymbol{b},\boldsymbol{J}^{2}\boldsymbol{b},\dots\},\quad \boldsymbol{b}={-}(\boldsymbol{q}_t-\boldsymbol{q}_0), \end{equation}
where  $\boldsymbol {J}=({\partial \boldsymbol {q}_t}/{\partial \boldsymbol {q}_0}-\boldsymbol {I})$ is the Jacobian and
 $({\partial \boldsymbol {q}}/{\partial \boldsymbol {q}_0})\delta \boldsymbol {q}_0$ is computed approximately as
 \begin{equation} \frac{\partial\boldsymbol{q}_t}{\partial\boldsymbol{q}_0}\delta\boldsymbol{q}_0 =\frac{\boldsymbol{\mathscr{F}}^{t}(\boldsymbol{q}_0+\epsilon\delta\boldsymbol{q}_0) -\boldsymbol{\mathscr{F}}^{t}(\boldsymbol{q}_0)}{\epsilon}, \end{equation}
where the empirical parameter  $\epsilon$ is typically small and is set at
 $10^{-6}\|\boldsymbol {q}_0\|/\|\delta \boldsymbol {q}_0\|$. The time stepping acts as a preconditioner on the general minimal residual (GMRES) iteration, which is terminated when
 $\|\boldsymbol {J}\delta \boldsymbol {q}_0-\boldsymbol {b}\|/\|\boldsymbol {b}\|<10^{-2}$. Details of the numerical method are shown in Appendix B. The Newton iteration is terminated when the relative error
 $\|\boldsymbol {q}_t-\boldsymbol {q}_0\|/\|\boldsymbol {q}_0\|<10^{-8}$. A pseudo-arclength continuation method has been implemented for branch tracking in the present study.
3. Exact steady solution: primary instability and bifurcation
3.1. Primary instability
First, we examine the linear stability of the following trivial base state:
 \begin{equation} \boldsymbol{u}=\boldsymbol{0},\quad \theta=1-z. \end{equation}
By perturbing the base state with infinitesimal harmonic waves, we obtain an eigenvalue problem, which is solved by a Chebyshev collocation method. Exchange of stability has been established by Veronis (Reference Veronis1963) for stress-free boundary conditions, which can be easily extended to the present case. Hence, like the classical Rayleigh–Bénard convection, we treat  $Ra$ as the eigenvalue, and the smallest value is the critical Rayleigh number. The linear stability shows that the system becomes more stable as
 $\theta _M$ increases (see figure 1). The critical Rayleigh number
 $Ra_c$ becomes very high when
 $\theta _M$ approaches
 $\theta _M=1$, e.g.
 $Ra_c>10^{6}$ when
 $\theta _M=0.8$. When
 $\theta _M\le 0.3$, we observe that the critical wavenumber
 ${\alpha _c\approx {\rm \pi}}$ and is not sensitive to
 $\theta _M$. When
 $\theta _M\ge 0.4$, we observe that the critical wavenumber
 $\alpha _c$ increases as
 $\theta _M$ increases and the critical Rayleigh number
 $Ra_c$ scales like
 $\alpha _c^{5}$ when
 $\theta _M\ge 0.4$. When the stable layer is thick (
 $\theta _M>0.4$) and convection occurs in the lower unstable regime, the characteristic length of the convection cell is
 $d_*=(1-\theta _M)d$, which gives
 $\alpha _c\propto (1-\theta _M)^{-1}$. To explain the
 $Ra_c\sim \alpha ^{5}_c$ scaling, we assume that the critical Rayleigh number in the unstable regime
 $Ra_*=\beta g(T_H-T_M)^{2}d_*^{3}/\nu \kappa$ is constant, which can be connected to the Rayleigh number
 $Ra$ through
 \begin{equation} Ra_c=\frac{Ra_*}{(1-\theta_M)^{5}}. \end{equation}
Hence, we immediately obtain  $Ra_c\propto \alpha _c^{5}$, which is in excellent agreement with the numerical solutions (table 1 shows that
 $Ra_*$ varies slightly when
 $\theta _M>0.4$, which supports our assumption of constant
 $Ra_*$).
The marginal stability curve plotted in the  $\alpha$–
 $Ra$ plane, with the values of
 $\theta _M$ marked on the lines. The black dashed line shows the critical Rayleigh number
 $Ra_c$ versus the critical wavenumber
 $\alpha _c$ (the red bullets mark the critical points
 $(\alpha _c,Ra_c)$); when
 $\theta _M\ge 0.4$, we observe
 $Ra_c\propto \alpha ^{5}_c$.

The rescaled critical Rayleigh number versus  $\theta _M$.

3.2. Bifurcation
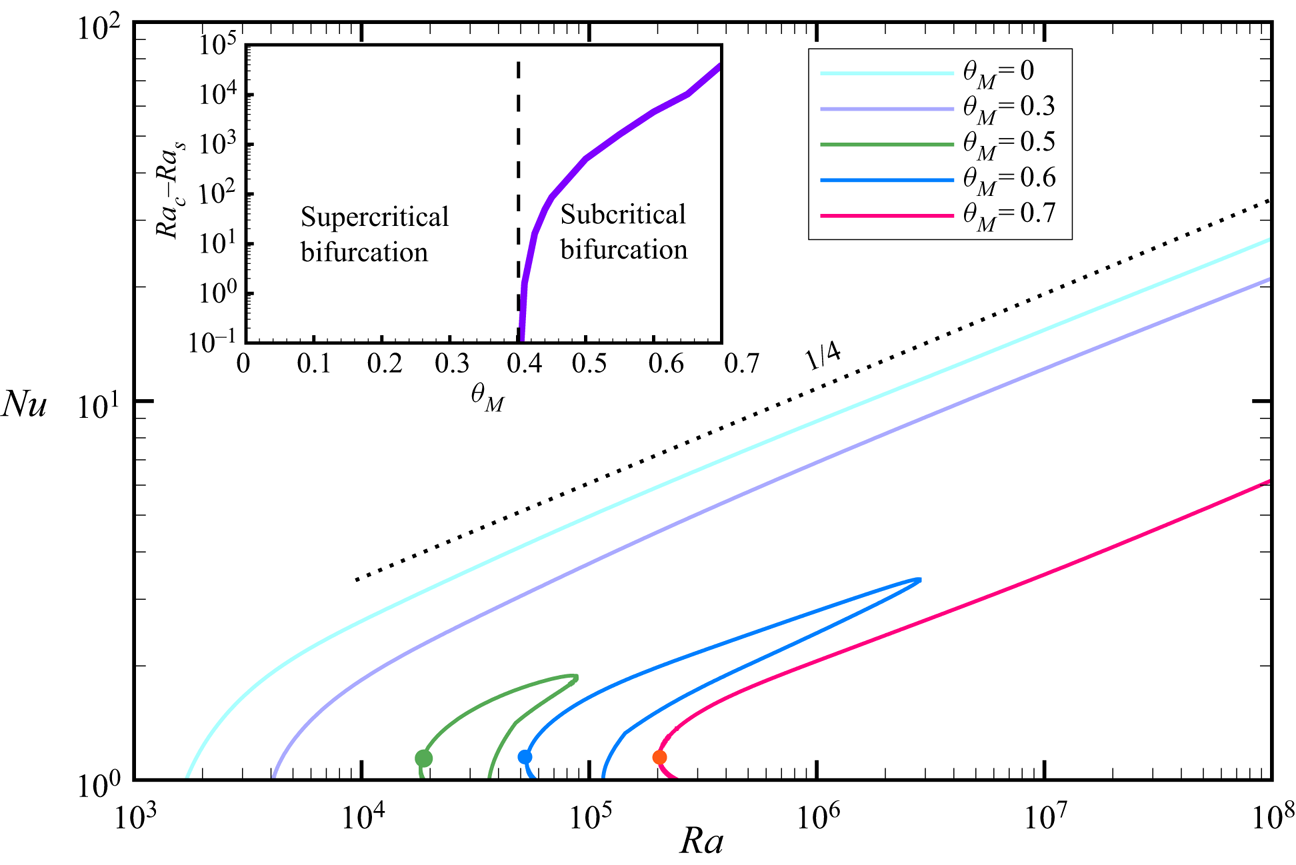
Once the Rayleigh number exceeds the critical value, the flow is unstable and steady convection cells will emerge. To obtain the exact non-trivial steady solutions when the flow is unstable, we added the critical mode onto the base state as the initial guess of the Newton iteration. By slightly moving away from the critical point predicted by the linear stability, convergence is fast when the amplitude of the eigenvector is well chosen. Typically, we used a bisectional method to choose the eigenvector's amplitude. Figure 2 illustrates the bifurcation diagram at  $Pr=1$ for several different values of
 $\theta _M$ by fixing the domain width at
 $2{\rm \pi} /\alpha _c$. An interesting observation is that the instability is supercritical when
 $\theta _M\lesssim 0.4$ but becomes subcritical as
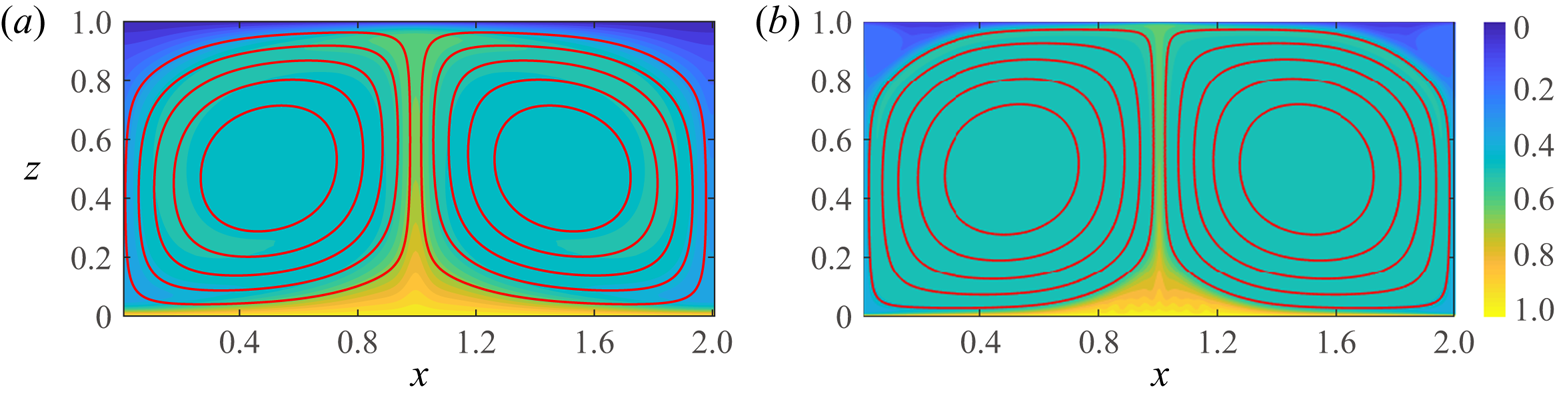
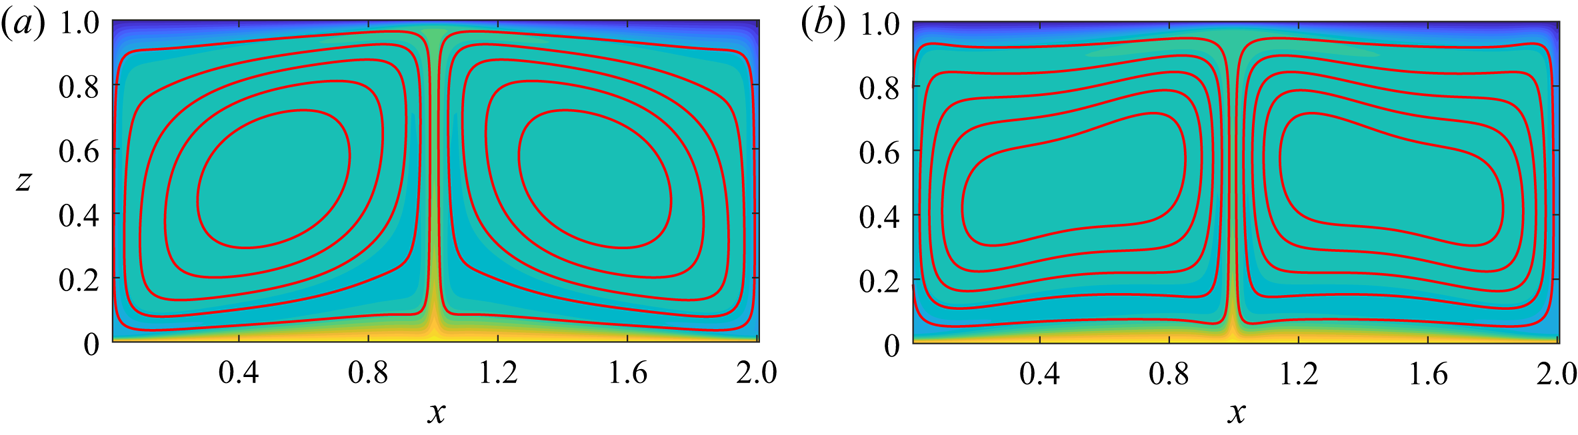
 $\theta _M\gtrsim 0.4$. Figure 3 illustrates the flow field and the temperature field of the steady solution for two selected Rayleigh numbers
 $Ra=10^{6}, 10^{8}$ at
 $\theta _M=0$. The convection pattern is very similar to that in the classical Rayleigh–Bénard convection, in that the thickness of the plume in the centre (hot fluid around
 $x=0$) becomes thinner as
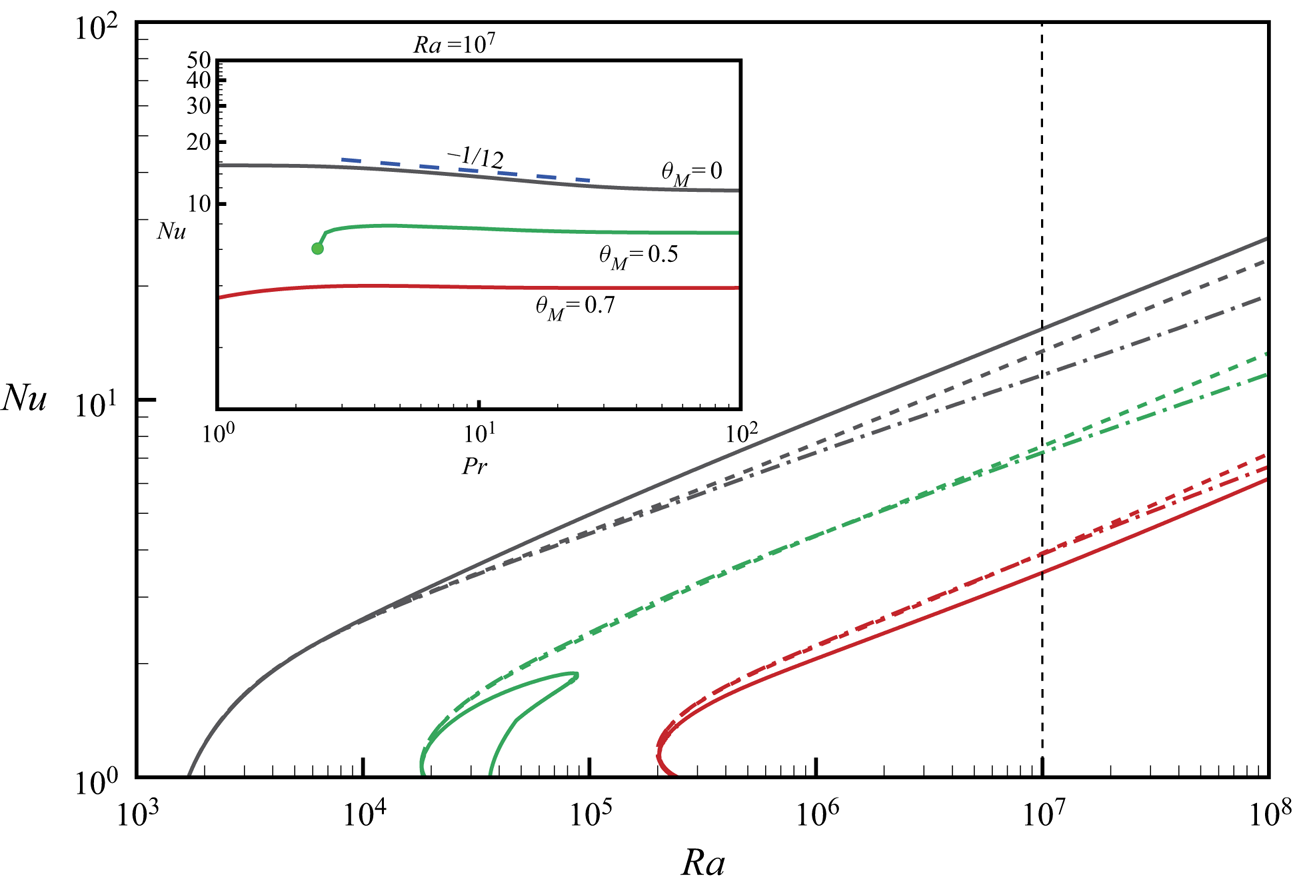
 $Ra$ increases and small-scale convection cells develop within the hot (cold) plumes near the bottom (top) plane (see also Wen et al. Reference Wen, Goluskin and Doering2020). However, the difference between penetrative convection and the classical Rayleigh–Bénard convection is that the hot/cold plumes are not centro-symmetric and the small-scale motions in the cold plumes are much weaker than that in the hot plumes. We also observe that the heat flux scales as
 $Ra^{1/4}$ at
 $\theta _M=0$ when the aspect ratio is fixed at
 $L\approx 2$, which is an additional similar feature as the classical Rayleigh–Bénard convection.
The bifurcation diagram in the  $Ra$–
 $Nu$ plane. The Prandtl number is fixed at
 $Pr=1$. In the inset, we show
 $Ra_c-Ra_s$ versus
 $\theta _M$, where
 $Ra_s$ is the minimal Rayleigh number on the
 $Nu$–
 $Ra$ curve as marked by bullets in the main panel. The subcritical bifurcation occurs when
 $\theta _M\gtrsim 0.4$. The domain width is fixed at
 $2{\rm \pi} /\alpha _c$ for each
 $\theta _M$.

The flow field and temperature field at (a)  $Ra=10^{6}$ and (b)
 $Ra=10^{8}$. The other parameters are
 $\theta _M=0$ and
 $Pr=1$. The red lines are the streamlines and the colour bar marks the contours of the temperature field, which applies to all the remaining figures of temperature field in this study.

To understand this similarity, we assume that the main viscous dissipation is in the boundary layer. Since the total viscous dissipation rate is proportional to  $U^{3}/d$ (where
 $U$ is the bulk velocity), the total viscous dissipation rate is proportional to
 $Re^{3}$ (here
 $Re=Ud/\nu$ is the Reynolds number; see Grossmann & Lohse Reference Grossmann and Lohse2000). Because we consider
 $Pr=1$, the thickness of the velocity boundary layer is the same as the thermal boundary layer, which is proportional to
 $Re^{-1/2}$ (see p. 159 in Landau & Lifshitz Reference Landau and Lifshitz2004). Hence, the viscous dissipation rate in the boundary layer is proportional to
 $Re^{3}\times Re^{-1/2}=Re^{5/2}$, which should be balanced by the work done by buoyancy:
 $Ra\langle w\theta ^{2}\rangle =\langle \|\boldsymbol {\nabla }\boldsymbol {u}\|^{2}\rangle$. Hence, we have
 $Ra\langle w\theta ^{2}\rangle \sim Re^{5/2}$. Because
 $\langle w\theta ^{2}\rangle \sim \langle w\theta \rangle \sim Nu$ (see Appendix A) and
 $Re\sim Ra^{1/2}$ (see Grossmann & Lohse Reference Grossmann and Lohse2000), we have
 $Nu\sim Ra^{1/4}$. This scaling law persists when the bifurcation is supercritical, i.e.
 $\theta _M<0.4$, and an example of
 $\theta _M=0.3$ is shown in figure 2. Reference Toppaladoddi and WettlauferToppaladoddi & Wettlaufer's (Reference Toppaladoddi and Wettlaufer2018) direct numerical simulations suggest that
 $Nu$ scales slightly higher than
 $Ra^{1/4}$ when the thickness of the stably stratified layer at the base state is very thin (corresponding to
 $\theta _M=0$ in the present study), indicating that the steady solution at the fixed aspect ratio
 $L\approx 2$ is not the optimal case. When the thickness of the stable layer becomes thick, their numerical results show that
 $Nu$ scales like
 $Ra^{\gamma }$ (with
 $0.245<\gamma <0.287$) in the regime of
 $10^{6}\le Ra\le 10^{8}$, depending on the thickness of the stable layer.
When the thickness of the stable layer  $\theta _M\gtrsim 0.4$, our study shows that the solution in the form of a single pair of steady convection cells does not exist if
 $Ra$ exceeds a certain value and the curve bends back and connects to the bifurcation branch of the solution in the form of two pairs of steady convection cells (e.g. see figure 2,
 $\theta _M=0.5,0.6$). The curve for
 $\theta _M=0.7$ also turns back at higher Rayleigh number, which is not shown here. In direct numerical simulations, Toppaladoddi & Wettlaufer (Reference Toppaladoddi and Wettlaufer2018) found unsteady solutions at high
 $Ra$ when the thickness of the stable layer is thick, suggesting that a Hopf bifurcation occurs when the steady solution becomes unstable.
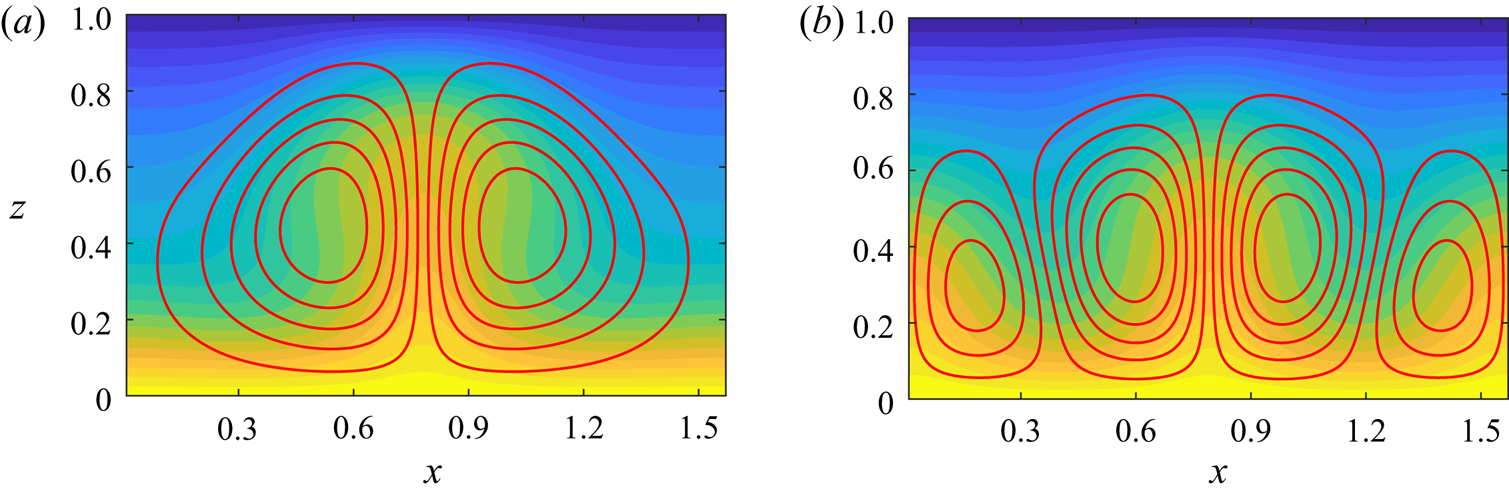
Figure 4 illustrates the two types of steady solutions at  $\theta _M=0.5$. It shows that the solution with one pair of convection cells becomes distorted (but the two cells are the same size) and the convection cells in the solution with two pairs of convection cells are not the same size (the four cells are the same size at the bifurcation point). An implication of the results in figure 2 is that the solution in the form of one pair of convection cells can transport more heat. When the stable layer is thicker (e.g.
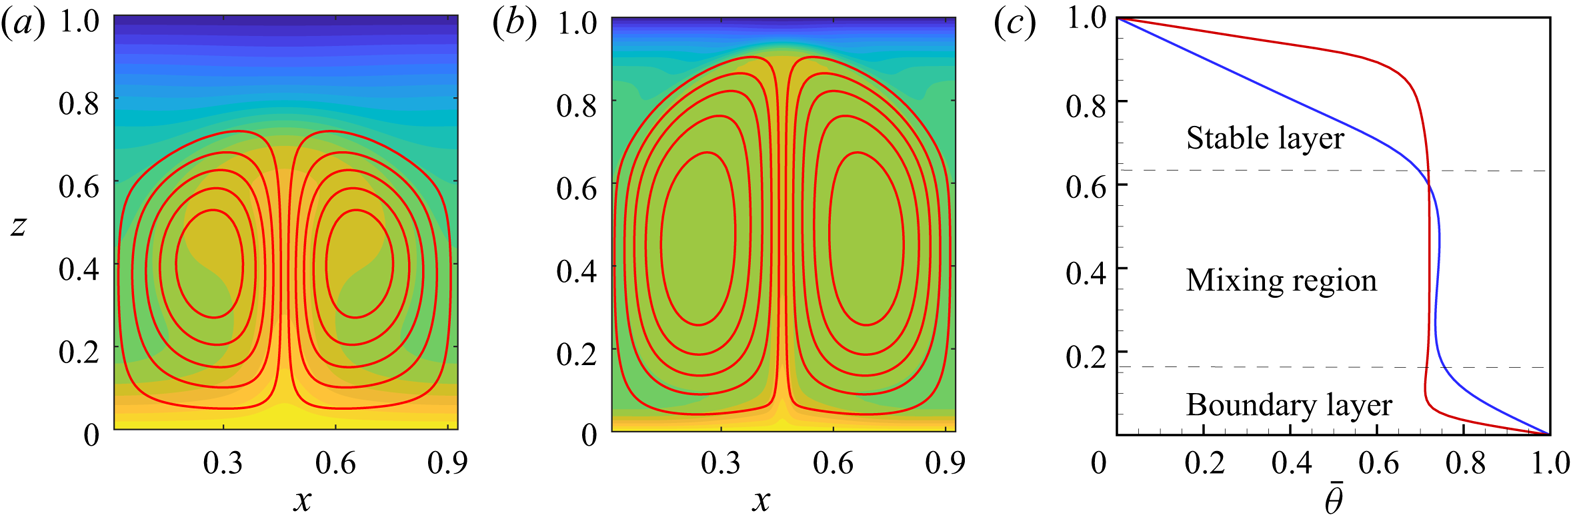
 $\theta _M=0.7$), a clear penetrative flow can be seen in figure 5(a,b), which shows that the convection initiated in the lower unstable layer is confined not only by the upper stably stratified layer but also by the upper rigid wall. It is therefore fascinating to investigate the asymptotic behaviour of
 $\theta _M\rightarrow 1^{-}$ and
 $Ra\rightarrow \infty$ in future. Note that the slope of the mean temperature field in the boundary layer is the same as that in the stable layer, which can be used to simply give an estimate of the thickness of the stable layer (denoted as
 $h$) when convection occurs at large
 $Ra$. Assuming that the power-law ansatz
 $\delta \sim Ra^{-\gamma }$ (with
 $\delta$ being the boundary layer thickness and
 $Nu\sim Ra^{\gamma }$), the thickness of the stably stratified top layer can be estimated by
 $h=\delta \theta _{mix}/(1-\theta _{mix})\sim {\theta _{mix}/(1-\theta _{mix})Ra^{-\gamma }}$, where
 $\theta _{mix}$ is the mean temperature in the mixing region. However, it is obvious that the scaling law does not hold for all
 $\theta _M$ since the steady solution does not always exist at large
 $Ra$ when
 $\theta _M>0.4$. But when
 $\theta _M<0.4$, the numerical data suggest
 $\gamma =1/4$ here.
The flow field and temperature field at  $Ra=50\,000$, with
 $Pr=1$ and
 $\theta _M=0.5$. (a) The upper branch solution and (b) the lower branch solution.

The flow field and temperature field at (a)  $Ra=10^{6}$ and (b)
 $Ra=10^{8}$. (c) The mean temperature field
 $\bar {\theta }$ of the two cases: blue line for
 $Ra=10^{6}$ and red line for
 $Ra=10^{8}$. The dashed lines are plotted to indicate three different regions at
 $Ra=10^{6}$. The other parameters are
 $\theta _M=0.7$ and
 $Pr=1$.

An interesting feature similar to the classical Rayleigh–Bénard convection is that the mean temperature profile in the boundary layer is non-monotonic (see figure 5c), which indicates that there is an unstably stratified layer in the boundary layer. The non-monotonic behaviour in the mean temperature profile is clearly dependent on  $\theta _M$ and the Rayleigh number
 $Ra$ (in fact, it also depends on
 $Pr$). However, the temperature is monotonic in the stable top layer, which is a very different feature from the classical Rayleigh–Bénard convection. (In the classical Rayleigh–Bénard convection, there exist two unstably stratified layers: one in the bottom boundary layer and the other in the top boundary layer.) We also observe that the mean temperature profiles in figure 5(c) share many features as the direct numerical simulation by Toppaladoddi & Wettlaufer (Reference Toppaladoddi and Wettlaufer2018). The thickness of the bottom boundary layer becomes thinner as
 $Ra$ increases and the mixing temperature
 $\theta _{mix}$ is a bit higher than
 $\theta _M$, which is almost constant in the mixing region. However, the boundary layer by Toppaladoddi & Wettlaufer (Reference Toppaladoddi and Wettlaufer2018) is thinner than ours, indicating that the 2-D steady flow field could transfer less heat than a 2-D chaotic flow field when the aspect ratio is fixed at
 $2{\rm \pi} /\alpha _c$. The optimal domain size, in which steady solutions transfer more heat than chaotic solutions, will be explored in § 4.
Figure 6 illustrates the influence of Prandtl number  $Pr$ on the steady solutions. Here, we considered
 $1\le Pr\le 100$ and the result shows that the heat transfer decreases as
 $Pr$ increases when
 $\theta _M$ is small. This is because the increased viscous effect retards the efficiency of heat transfer. For small
 $\theta _M$, i.e. the thickness of the stably stratified layer is thin (e.g.
 $\theta _M=0$), we also found that the scaling law of heat transfer
 $Nu\sim Ra^{\gamma }$ for the two values of Prandtl number
 $Pr=1,11.6$ is the same and
 $\gamma =1/4$, but
 $\gamma$ is clearly less than
 $1/4$ for
 $Pr=100$ (perhaps because
 $Ra$ is not high enough before the
 $1/4$ scaling emerges at large
 $Pr$). In the range of
 $2< Pr<30$, our numerical data suggest
 $Nu\sim Pr^{-1/12}$. To account for the influence of Prandtl number on the heat transfer, we rescale the viscous dissipation rate
 $\langle |\boldsymbol {\nabla }\boldsymbol {u}|^{2}\rangle$ in units of
 $\nu ^{3}/d^{4}$ (see Grossmann & Lohse Reference Grossmann and Lohse2000). Hence, we have
 $\langle |\boldsymbol {\nabla }\boldsymbol {u}|^{2}\rangle \sim Pr^{-2}Ra\langle w\theta ^{2}\rangle \sim Pr^{-2}RaNu$ (see Appendix A to see that
 $\langle w\theta ^{2}\rangle$ is linearly proportional to
 $Nu$). When
 $Pr>1$, the viscous boundary layer is thicker than the thermal boundary layer, and the heat transfer is proportional to
 $Re^{1/2} Pr^{1/3}$ (see Landau & Lifshitz Reference Landau and Lifshitz2004). Since the work done by buoyancy should be balanced by the viscous dissipation (
 $\sim Re^{5/2}$), we have
 $Nu\sim Ra^{1/4}Pr^{-1/12}$, which is supported by the numerical evidence in figure 6. However, the
 $Pr^{-1/12}$ scaling breaks down when
 $Pr$ is large (roughly
 $Pr>30$), and our numerical solution of the steady state suggests
 $Pr$ has a negligible influence on
 $Nu$, but the flow field is noticeably changed (see figure 7). The streamlines are more like a square pattern at high
 $Pr$, while the streamlines are tilted at small
 $Pr$. However, it has not been examined if
 $Nu\sim Pr^{-1/12}$ persists at large
 $Pr$ in turbulent flows, which requires future investigation.
The bifurcation diagram in the  $Ra$–
 $Nu$ plane: influence of Prandtl number. In the main panel, three different Prandtl numbers are considered: black, green and red solid lines for
 $Pr=1$; black, green and red dashed lines for
 $Pr=11.6$; and black, green and red dash-dotted lines for
 $Pr=100$. The different colours mark different values of
 $\theta _M=0, 0.5, 0.7$ (black, green and red, respectively). In the inset, the Rayleigh number is fixed at
 $Ra=10^{7}$ and three typical
 $\theta _M=0, 0.5, 0.7$ are considered.

The flow field and temperature field at (a)  $Pr=11.6$ and (b)
 $Pr=100$. The other parameters are
 $\theta _M=0$ and
 $Ra=10^{7}$.

For a thick stably stratified layer (e.g.  $\theta _M=0.5, 0.7$), we observe that the heat transfer first increases as
 $Pr$ increases, and then it becomes invariant as
 $Pr$ increases to large numbers. For small
 $Pr$, the hot plume is too weak to penetrate into the top stably stratified layer so that the solution does not exist at high
 $Ra$. But when
 $Pr$ is large, figure 8(a,b) suggests that the hot plume can penetrate deeper into the top stably stratified layer, which causes the increase in heat transfer and steady solutions do exist at large
 $Ra$. This implies that the thickness of the thermal boundary layer plays an important role in the bifurcation scenario. For the same Rayleigh number, when the thermal boundary layer is thick (
 $Pr$ is small), it is more unstable and the two additional convection cells could develop due to the instability (for example, there are more convection cells in the numerical simulation by Toppaladoddi & Wettlaufer (Reference Toppaladoddi and Wettlaufer2018) at
 $Pr=1$). When the Prandtl number is large, the thermal boundary layer is relatively thinner than the viscous boundary layer and is more stable, which accounts for the existence of steady solutions in the form of one pair of convection cells at high
 $Ra$. When the Prandtl number is large, the numerical data show that the Prandtl number has a very weak influence on the steady solutions (see figure 8c,d). The
 $Ra^{1/4}$ scaling has also been observed by us for
 $\theta _M=0.5, 0.7$ at
 $Pr=11.6$ (this scaling law is not observed at
 $Pr=1$ for
 $\theta _M=0.5$ because steady solutions in the fixed domain of aspect ratio
 $2{\rm \pi} /\alpha _c$ do not exist at high
 $Ra$). The
 $Ra^{1/4}$ scaling seems to break down for
 $\theta _M=0.5, 0.7$ when
 $Pr=100$, which, perhaps, is also because
 $Ra$ is too low before the
 $1/4$ scaling can emerge. But an obvious difference is that the
 $Pr^{-1/12}$ scaling does not appear for the two cases
 $\theta _M=0.5, 0.7$. It is questionable whether the
 $Pr^{-1/12}$ scaling is observable in turbulent penetrative convection when
 $\theta _M>0.4$ by direct numerical simulations, which also needs further investigation.
The flow field and temperature field at  $Ra=10^{7}$ for: (a)
 $Pr=11.6$,
 $\theta _M=0.5$,
 $\alpha =4$; (b)
 $Pr=100$,
 $\theta _M=0.5$,
 $\alpha =4$; (c)
 $Pr=11.6$,
 $\theta _M=0.7$,
 $\alpha =6.78$; and (d)
 $Pr=100$,
 $\theta _M=0.7$,
 $\alpha =6.78$. The horizontal axis is rescaled to
 $\alpha x$.

4. Optimal heat transfer by steady solutions
In this section, we examine how the 2-D optimal steady solutions depend on  $\theta _M$,
 $Ra$ and
 $Pr$. Particularly, we will examine the two cases
 $Pr=1, 11.6$ in detail, which have been investigated via direct numerical simulations by Toppaladoddi & Wettlaufer (Reference Toppaladoddi and Wettlaufer2018) and Wang et al. (Reference Wang, Zhou, Wan and Sun2019). The Prandtl number
 $11.6$ specifically corresponds to water around
 $T=4\,^{\circ } \text {C}$. The 2-D optimal solutions are tracked from the bifurcation point, i.e. aspect ratio
 $2{\rm \pi} /\alpha _c$, and by adjusting the aspect ratio (or the width of the convection cell,
 $L=2{\rm \pi} /\alpha$) at each Rayleigh number like Sondak et al. (Reference Sondak, Smith and Waleffe2015), Waleffe et al. (Reference Waleffe, Boonkasame and Smith2015) and Wen et al. (Reference Wen, Goluskin and Doering2020). We applied a pseudo-arclength continuation method to track the solutions and found that the optimal solution, indeed, can also be tracked from the cutoff wavenumber for each
 $Ra$, as demonstrated in figure 9.
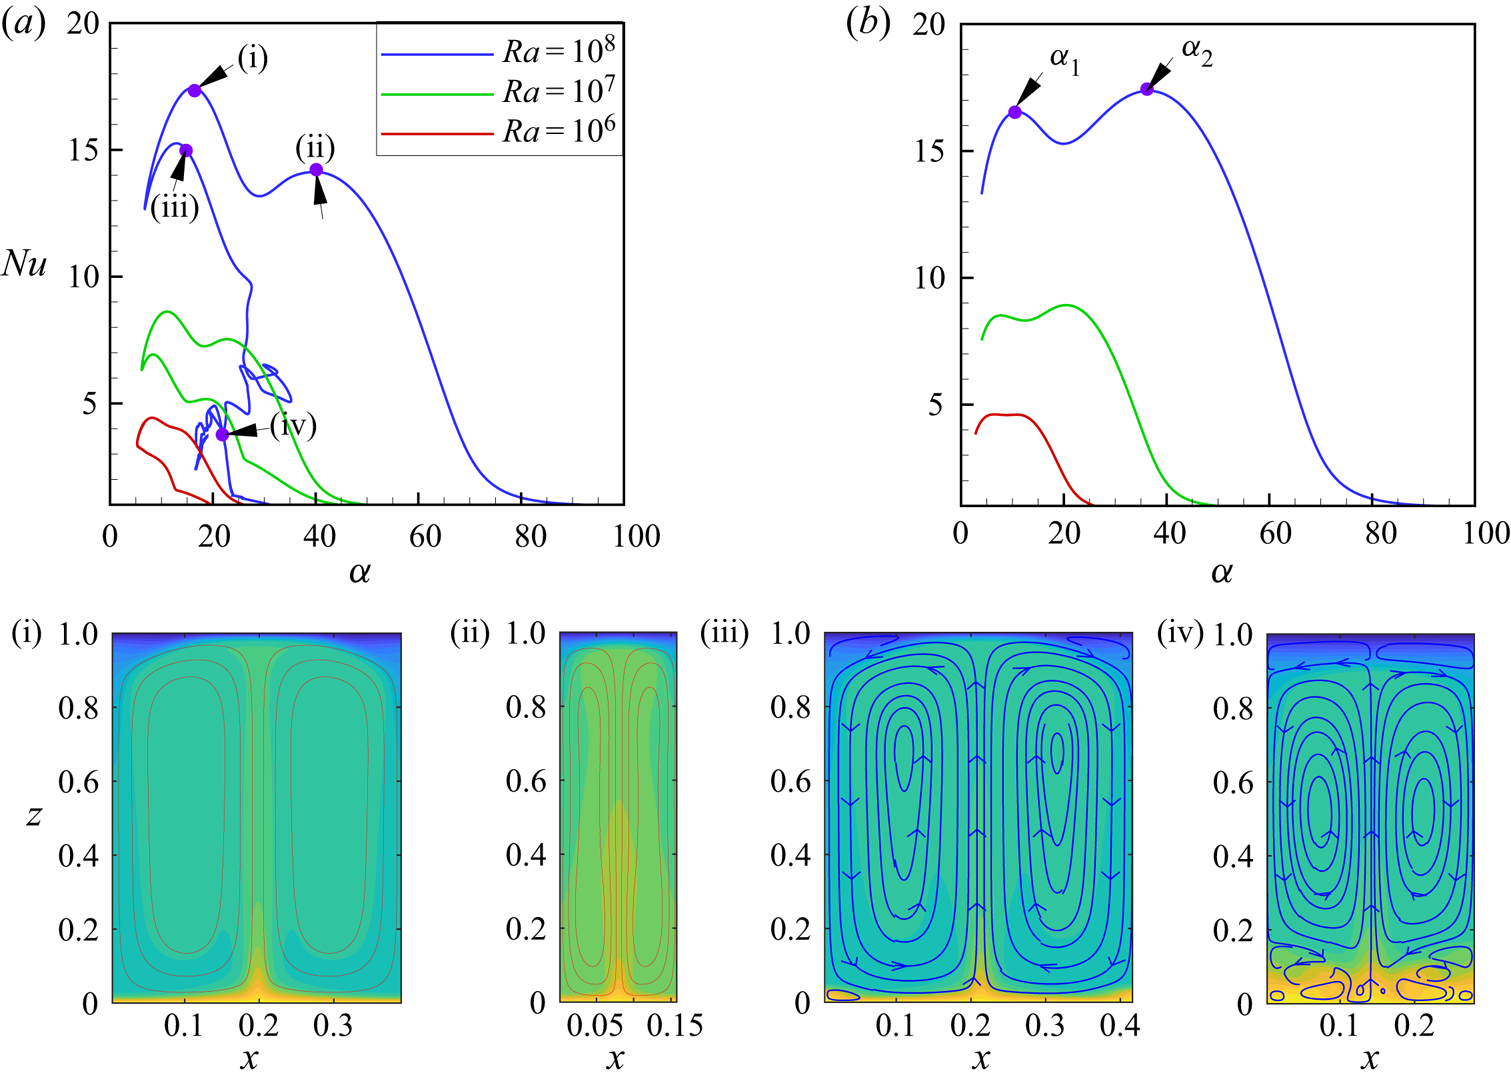
(a,b) The Nusselt number  $Nu$ versus the base wavenumber
 $\alpha$ for: (a)
 $\theta _M=0.5$ and
 $Pr=1$; and (b)
 $\theta _M=0.5$ and
 $Pr=11.6$. Two local maxima in (b) are marked by points. Panels (i)–(iv) are flow fields and temperature fields at
 $Ra=10^{8}$ as marked in (a).

It is interesting that the topological structure of the  $\alpha$–
 $Nu$ curve (
 $\alpha$ is the base wavenumber of the problem,
 $\alpha =2{\rm \pi} /L$) resembles a raven, and there are two local maxima on its head and back (the other local maxima on the belly are not important, so are not shown in figure 10), which are marked by points in figure 9(b). The other two cases
 $\theta _M=0, 0.7$ (see figure 10) also show that there are two local maxima when the Rayleigh number is large. The numerical data indicate that the optimal heat transfer is achieved at the small wavenumber
 $\alpha _1$ when
 $Pr<10$, but it is achieved at the large wavenumber
 $\alpha _2$ when
 $Pr>10$. This is a similar feature to the classical Rayleigh–Bénard convection (see Sondak et al. Reference Sondak, Smith and Waleffe2015). Figure 9(i,ii) shows that the flow field can penetrate the whole domain for both
 $\alpha =\alpha _1, \alpha _2$, which causes a much higher heat flux than the steady solutions in a fixed domain size (
 $L=2{\rm \pi} /\alpha _c$) in § 3.2. The steady solutions on the raven's belly show that there are multiple convection cells arrayed in the wall-normal direction (see figure 9iii,iv), which is less efficient to transfer heat. This indicates that the small-scale motion near the walls in penetrative convection does not really help to enhance heat transfer.
The Nusselt number  $Nu$ versus the base wavenumber
 $\alpha$ for: (a)
 $\theta _M=0$ and
 $Pr=1$; (b)
 $\theta _M=0$ and
 $Pr=11.6$; (c)
 $\theta _M=0.7$ and
 $Pr=1$; and (d)
 $\theta _M=0.7$ and
 $Pr=11.6$.

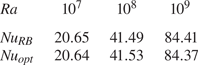
A comparison between the classical Rayleigh–Bénard convection and penetrative convection shows that the optimal heat transfer in penetrative convection at  $\theta _M=0$ and
 $Pr=1$ is very close to the classical Rayleigh–Bénard convection (see table 2). But the optimal temperature field in the classical Rayleigh–Bénard convection obeys centro-reflection symmetry, while this symmetry is lost in penetrative convection. In classical Rayleigh–Bénard convection, Waleffe et al. (Reference Waleffe, Boonkasame and Smith2015) and Wen et al. (Reference Wen, Goluskin and Doering2020) showed that the 2-D optimal flow field can transfer more heat than 3-D turbulent flow fields. In turbulent penetrative convection, there are many small-scale motions near the walls (see Wang et al. Reference Wang, Zhou, Wan and Sun2019), which is similar to the steady solutions in figure 9(iv). This might imply that turbulence is less efficient than the optimal steady solution for heat transfer. For example, direct numerical simulation of a 3-D turbulent penetrative convection at
 $(\theta _M, Ra)=(0.5, 10^{8})$ shows that the turbulent flow field can achieve
 $Nu=16.29$ (this Nusselt number was computed at
 $q=2$ by Dr Q. Wang in a cubic box of size
 $x\times y\times z =[-2,2]\times [-2,2]\times [0,1]$), which is approximately
 $10\,\%$ lower than the present 2-D optimal heat transfer
 $Nu=17.37$. Table 3 demonstrates that the heat flux in our 2-D optimal steady solution is higher than that in a 3-D turbulent flow at
 $q=2$, providing strong evidence that the 2-D optimal steady flow is more efficient to transport heat than a turbulent flow. But, as
 $\theta _M$ increases, the gap between the 2-D optimal heat flux and the 3-D turbulent heat flux narrows.
Comparison between the classical Rayleigh–Bénard convection and penetrative convection at  $\theta _M=0$ and
 $Pr=1$. Here
 $Nu_{RB}$ (data courtesy of Dr B. Wen) and
 $Nu_{opt}$ are the optimal Nusselt numbers in the classical Rayleigh–Bénard convection and penetrative convection.

Comparison between the present study and the 3-D simulations. The 3-D simulations were performed in an  $x\times y\times z=[-2,2]\times [-2,2]\times [0,1]$ box. The Prandtl number is
 $Pr=11.6$. Here
 $Nu^{*}$ is the Nusselt number obtained by 3-D direct numerical simulations (data courtesy of Dr Q. Wang); and
 $Nu_{opt}$ is the optimal Nusselt number in the present study.

Figure 11 shows how the optimal wavenumber  $\alpha _{opt}$ (the wavenumber corresponding to the global maximal heat flux) depends on the Rayleigh number
 $Ra$. For
 $Pr=1$, the best fitting shows that the optimal wavenumber
 $\alpha _{opt}=\alpha _1$ scales like
 $Ra^{1/5}$. When
 $\theta _M=0.5, 0.7$, the
 $1/5$ scaling of the optimal wavenumber seems to connect with the primary instability
 $\alpha _c\sim Ra^{1/5}$. When
 $\theta _M=0$, the argument for
 $\alpha _c\sim Ra^{1/5}$ breaks down (see (3.2)). Thus, it seems that
 $1/5$ scaling of the optimal wavenumber is connected with the primary instability as
 $\theta _M\rightarrow 0^{+}$. For
 $Pr=11.6$, the best fitting shows that the optimal wavenumber
 $\alpha _{opt}=\alpha _2$ scales like
 $Ra^{1/4}$, which is connected to the cutoff wavenumber like the classical Rayleigh–Bénard convection (Sondak et al. Reference Sondak, Smith and Waleffe2015). The present study also suggests that the power exponent for the optimal wavenumber
 $\alpha _{opt}=\alpha _2$ is not sensitive to the thickness of the stably stratified top layer. To understand the physics, using the exchange of stability (Veronis Reference Veronis1963), we can obtain a sixth-order equation for the linear stability of a small disturbance
 $\theta ^{\prime }=\hat {\theta }(z)\exp (\omega t+\textrm {i}\alpha x)$ (for neutral instability
 $\omega \equiv 0$):
 \begin{equation} (\text{D}^{2}-\alpha^{2})^{3}\hat{\theta}+2\alpha^{2}Ra(1-z-\theta_M)\hat{\theta}=0,\quad \text{D}:=\frac{\textrm{d}}{\textrm{d}z}. \end{equation}
Here, we treat  $\alpha$ as the eigenvalue but
 $Ra$ is given. It requires that
 $\alpha ^{6}\hat {\theta }\sim \alpha ^{2} Ra(1-z-\theta _M)\hat {\theta }$ (this is because
 $\alpha$ is large and the horizontal diffusive term should dominate the wall-normal diffusive term). Hence, we obtain that the cutoff wavenumber scales as
 $\alpha \sim Ra^{1/4}$, and decreases as
 $\theta _M$ increases.
The optimal base wavenumber number  $\alpha$ versus the Rayleigh number
 $Ra$. The hollow symbols are for
 $\alpha _2$ and solid symbols are for
 $\alpha _1$. Lines are obtained using best fitting.

The 2-D optimal heat flux characterized by  $Nu$ versus Rayleigh number
 $Ra$ is shown in figure 12. For
 $Ra\rightarrow \infty$, we derived an upper bound on the heat flux:
 $Nu\sim Ra^{1/2}$ (see Appendix A), which is uniform in
 $Pr$. However, in our derived upper bound
 $Nu\lesssim cRa^{1/2}$, it shows that the power exponent is independent of
 $\theta _M$, i.e. the thickness of the stably stratified top layer. But the undetermined coefficient
 $c$ depends on
 $\theta _M$. It is interesting that the power exponent of the bound on heat flux in penetrative convection is the same as that in the classical Rayleigh–Bénard convection (
 $Nu\lesssim 0.026Ra^{1/2}$; Plasting & Kerswell Reference Plasting and Kerswell2003). However, as discussed in Ding & Kerswell (Reference Ding and Kerswell2020), the upper bound is not observable because there is no field satisfying the momentum and energy equations. This does not mean that the
 $Ra^{1/2}$ scaling (usually referred to as the ultimate scaling in classical Rayleigh–Bénard convection) is wrong at very large
 $Ra$, but their analysis suggested that any true scaling should be lower than the bound. It is clear that the optimal solution is much lower than the bound and the power index
 $\gamma$ (power-law ansatz
 $Nu\sim Ra^{\gamma }$) is less than
 $1/2$, which seems to be consistent with the scaling proposed by Veronis (Reference Veronis1963):
 $Nu\sim Ra^{1/3}$ when
 $Ra<10^{9}$. The
 $Ra^{1/3}$ scaling can be derived under a marginal stable boundary layer assumption. Suppose that the thickness of the boundary layer is
 $\delta$ and the temperature in the mixing region is
 $\theta _{mix}$, then
 $Nu=(1-\theta _{mix})\delta ^{-1}$. The thickness of a marginally stable boundary layer is proportional to
 $\delta /d\sim (1-\theta _{mix})^{-2/3}Ra^{-1/3}$ (this also gives a scaling for the thickness of the stably stratified top layer
 $h\sim Ra^{-1/3}$).
The optimal Nusselt number  $Nu-1$ versus the Rayleigh number
 $Ra$. The slope
 $1/2$ indicates the upper bound on the heat transfer
 $Nu\le cRa^{1/2}$. Lines are obtained using best fitting. See also symbols in figure 11.

Figure 13 displays three typical mean temperature profiles  $\bar \theta$ at
 $Ra=10^{8}$, which clearly demonstrate that there is a laminar thermal boundary layer near the bottom wall. And, as
 $\theta _M$ increases, the boundary layer is thicker, and the mean temperature in the mixing region
 $\theta _{mix}$ is higher. We further assume that
 $\theta _{mix}$ is linearly dependent on
 $\theta _M$ as
 $\theta _{mix}=1-c+c\theta _M$ (Reference Wang, Zhou, Wan and SunWang et al.'s (Reference Wang, Zhou, Wan and Sun2019) data suggest this linear relationship for fixed Prandtl number), thus
 $\delta /d\sim (1-\theta _M)^{-2/3}Ra^{-1/3}$. Hence, the heat flux scales like
 $Nu\sim (1-\theta _M)^{5/3}Ra^{1/3}$. Numerical data at
 $Ra=10^{8}$ give
 $Nu_{opt}=35.85, 17.37, 7.78$ for
 $\theta _M=0, 0.5, 0.7$ when
 $Pr=11.6$, which roughly reduces by a factor of
 $(1-\theta _M)^{5/3}$. For
 $\theta _M=0$, the scaling is very much like the classical Rayleigh–Bénard convection in which
 $\gamma \approx 0.31$ (Sondak et al. Reference Sondak, Smith and Waleffe2015; Waleffe et al. Reference Waleffe, Boonkasame and Smith2015; Motoki et al. Reference Motoki, Kawahara and Shimizu2020). For the other two cases of
 $\theta _M=0.5, 0.7$, the power exponent
 $\gamma \approx 0.328, 0.339$, which are all higher than the 2-D or 3-D direct numerical simulations (Toppaladoddi & Wettlaufer Reference Toppaladoddi and Wettlaufer2018; Wang et al. Reference Wang, Zhou, Wan and Sun2019). It is worth noting that the power exponent for
 $\theta _M=0.7$ is
 $\gamma =0.339$ and is higher than
 $1/3$, which does not indicate that the flow has entered into the ultimate regime. It is because the Rayleigh number is not high enough and the scaling is not clear when
 $Ra<10^{9}$ for a thick stably stratified top layer (see the data fitting in the range of
 $10^{8}\le Ra\le 5.623\times 10^{9}$ in Appendix B). We would expect that
 $\gamma <1/3$ or asymptotically approaches
 $1/3$ at very large
 $Ra$ like the classical Rayleigh–Bénard convection (Wen et al. Reference Wen, Goluskin and Doering2020). But it is not known if heat transfer by unsteady flow fields can be higher than
 $Ra^{1/3}$ scaling but below the upper bound
 $Ra^{1/2}$, which remains a challenging problem.
The horizontal averaged temperature profile  $\bar \theta$ for the optimal steady solutions at
 $Ra=10^{8}$ and
 $Pr=11.6$.

The mean temperature profiles in figure 14 confirm that the thickness of the thermal boundary layer is thick at small Prandtl number but is thin at large Prandtl number. For  $Pr>10$, we found that the Prandtl number has a negligible influence on the mean temperature profile, but the mean temperature profile at small Prandtl number is significantly different from that at large Prandtl number. The mean temperature in the mixing region is lower for small Prandtl numbers, as seen in figure 14. To understand the underlying physics, we refer to figure 9. For small Prandtl number, the optimal temperature field in figure 9(i) shows that a hot plume penetrates into the fluid layer with two arm-like structures near the top wall. For large Prandtl numbers, the optimal temperature field is like figure 9(ii) and has no significant horizontal structures. The optimal convection is very vigorous in a narrow domain and more of the cold fluid can be heated up by the central hot plume when the Prandtl number is large. Hence, the mean temperature in the mixing region for
 $Pr>10$ is higher than the mean temperature in the mixing region for
 $Pr<10$.
The horizontal averaged temperature profile  $\bar \theta$ at
 $Ra=10^{8}$ and
 $\theta _M=0.5$.

The influence of the Prandtl number on the optimal solution is examined over three decades,  $10^{-1}\le Pr\le 10^{2}$, and the results are illustrated in figure 15. For
 $\theta _M=0$,
 $Nu$ decreases with
 $Pr$ when
 $Pr$ is small, and then it becomes invariant when
 $Pr$ is large. For
 $\theta _M=0.5, 0.7$, however, we observed that
 $Nu$ slightly increases with
 $Pr$ when
 $Pr<1$, and
 $Nu$ becomes invariant when
 $Pr>1$. For
 $\theta _M=0$, the behaviour
 $Nu\sim Pr^{-1/12}$ is observed again when
 $1\le Pr\le 10$. Hence, we propose that
 $Nu\sim Pr^{-1/12}Ra^{1/3}$ in this regime (
 $1< Pr<10$) for
 $\theta _M=0$. Such a phenomenon is different from the classical Rayleigh–Bénard convection, in which
 $Nu$ was reported to be very weakly dependent on
 $Pr$ (Sondak et al. Reference Sondak, Smith and Waleffe2015). However,
 $Nu$ becomes independent of
 $Pr$ when
 $Pr>10$, which is similar to the classical Rayleigh–Bénard convection. This suggests that, for
 $Pr>1$, the Nusselt number does not simply follow
 $Nu\sim Re^{1/2}Pr^{1/3}$ and the viscous dissipation is not simply proportional to
 $Re^{5/2}$. When
 $Pr<1$, if the viscous dissipation is dominated by the viscous boundary layer and
 $Nu\sim Re^{1/2}Pr^{1/2}$ (the Grossmann & Lohse (Reference Grossmann and Lohse2000) theory for
 $Pr<1$), we obtain
 $Nu\sim Ra^{1/4}Pr^{1/8}$, which is rejected immediately by the data of
 $\theta _M=0$. Although our data for
 $\theta _M=0.5, 0.7$ show that
 $Nu$ increases with
 $Pr$ when
 $Pr<1$, it does not support the
 $Ra^{1/4}Pr^{1/8}$ scaling. This suggests that the Grossmann & Lohse (Reference Grossmann and Lohse2000) theory for the classical Rayleigh–Bénard convection is clearly inapplicable for the 2-D steady optimal solutions in penetrative convection.
The optimal Nusselt number  $Nu$ versus the Prandtl number
 $Pr$ at
 $Ra=10^{8}$. Circles are for
 $\theta _M=0$, triangles are for
 $\theta _M=0.5$ and diamonds are for
 $\theta _M=0.7$.

5. Conclusion
We have investigated the steady solutions in penetrative convection, which are bifurcated from the primary instability of a stationary base flow. Using a pseudo-arclength continuation technique, the steady solution in a fixed domain of size  $L=2{\rm \pi} /\alpha _c$ (where
 $\alpha _c$ is the critical wavenumber) has been tracked up to
 $Ra=10^{8}$. An interesting observation is that the instability is supercritical when the upper stably stratified flow is thin (
 $\theta _M<0.4$, where
 $\theta _M$ is the dimensionless temperature at which the density is maximal, which also measures the thickness of the upper layer) and the heat flux characterized by the Nusselt number scales as
 $Ra^{1/4}$. In the range of
 $2< Pr<30$ at a fixed Rayleigh number
 $Ra=10^{7}$, the present study suggests that
 $Nu\sim Pr^{-1/12}$, which breaks down when the Prandtl number is large and the stably stratified layer is thick. When
 $\theta _M>0.4$, the instability is subcritical, and our numerical solution suggests that the steady solution does not exist at high Rayleigh number if the Prandtl number is small, which is due to a saddle-point bifurcation. However, when the Prandtl number is large, steady solutions were found up to
 $Ra=10^{8}$ and
 $Nu\sim Ra^{1/4}$ is observed at
 $Pr=11.6$.
Furthermore, the 2-D optimal steady solutions tracked by varying the domain size  $L$ were investigated up to
 $Ra=10^{9}$. The influences of the thickness of the stably stratified upper layer and the Prandtl number have been examined. The numerical results showed that there are two local maxima at high
 $Ra$, which are labelled by a small wavenumber
 $\alpha _1$ and a large wavenumber
 $\alpha _2$. When the Prandtl number is small, the global optimal thermal field has an arm-like horizontal structure, which is achieved at the optimal wavenumber
 $\alpha _{opt}=\alpha _1$. The global optimal thermal field has no significant horizontal structure at high Prandtl number, which is achieved at optimal wavenumber
 $\alpha =\alpha _2$. It is interesting that the small wavenumber
 $\alpha _1$ roughly scales like
 $Ra^{1/5}$, which is connected to the critical instability, while the large wavenumber
 $\alpha _2$ scales like
 $Ra^{1/4}$, which is connected to the cutoff wavenumber at high
 $Ra$. Three typical cases of
 $\theta _M=0, 0.5, 0.7$ showed that
 $Nu\sim Ra^{0.316}, Ra^{0.328}, Ra^{0.339}$ in the range of
 $10^{7}\le Ra\le 10^{9}$; thus the Nusselt number roughly scales like
 $Ra^{1/3}$, which is much lower than the derived upper bound on the heat transfer
 $Nu\sim Ra^{1/2}$. Moreover, the optimal steady solutions show a marginally stable boundary layer, which is in agreement with the assumption by Veronis (Reference Veronis1963). Recent computation of 2-D optimal steady solutions in classical Rayleigh–Bénard convection suggests that the optimal heat transfer asymptotically approaches
 $Ra^{1/3}$ as
 $Ra\rightarrow \infty$ (Wen et al. Reference Wen, Goluskin and Doering2020). We would therefore expect to see that the
 $1/3$ scaling will emerge at higher
 $Ra\gg 10^{9}$ in penetrative convection.
The present study also demonstrated that the 2-D optimal heat transfer has a dependence on  $Pr$ when
 $1< Pr<10$ and
 $\theta _M$ is small. The study of
 $\theta _M=0$ at
 $Ra=10^{8}$ indicated
 $Nu\sim Pr^{-1/12}$, which is different from the classical Rayleigh–Bénard convection wherein
 $Nu$ is reported to be very weakly dependent on
 $Pr$ (Sondak et al. Reference Sondak, Smith and Waleffe2015). However, when
 $Pr>10$, our study demonstrated that the optimal heat transfer is not sensitive to
 $Pr$. Thus our optimal steady solution suggests
 $Nu\sim Pr^{-1/12}Ra^{1/3}$ for
 $1< Pr<10$ when the upper stably stratified layer is thin, but the scaling is uniform in
 $Pr$ when the upper stably stratified layer is thick. It is not clear if there is an unsteady solution that can transfer more heat than the present study. How the Nusselt number depends on
 $Pr$,
 $Ra$ and
 $\theta _M$ requires further investigations in future.
Acknowledgements
Z.D. thanks Dr Q. Wang for sharing his unpublished data of direct numerical simulations and Dr B. Wen for sharing his data of optimal steady solutions in classical Rayleigh–Bénard convection. Z.D. also thanks Professor R.R. Kerswell for an enlightening discussion on deriving the upper bound in Appendix A. Finally, we appreciate the reviewers for their many constructive comments on our paper.
Funding
Z.D. was supported by the Heilongjiang Touyan Team and Fundamental Research Funds for the Central Universities (Grants Nos. AUGA5710000820 and AUGA5710094020).
Declaration of interests
The authors report no conflict of interest.
Appendix A. Upper bound on heat transfer
To understand the bound on maximal heat transfer in penetrative convection, instead of assuming a piecewise temperature background field, we follow the technique by Seis (Reference Seis2015) to derive a rigorous upper bound here.
Integrating the energy equation, we have
 \begin{equation} Nu=\overline{w\theta}-\overline{\partial_z\theta}, \quad z\in[0,1], \end{equation}
where  $\bar {\cdot }=\lim _{T\rightarrow \infty }({1}/{TL})\int ^{T}_0\textrm {d}t \int ^{L/2}_{-L/2}{\textrm {d}x}\,\cdot$ is the horizontal-temporal average.
Using the fact that  $\theta$ is bounded,
 $0\le \theta \le 1$, taking the vertical average of (A1) gives
 \begin{equation} Nu \le \frac{1}{l}\int^{l}_0w\theta\,\textrm{d}z+\frac{1}{l} \le \frac{1}{l}\int^{l}_0|w|\,\textrm{d}z+\frac{1}{l}. \end{equation}
Using the Poincaré and Cauchy–Schwarz inequalities, we have
 \begin{equation} Nu \le\frac{1}{l}\int^{l}_0|w|\,\textrm{d}z+\frac{1}{l} \le l^{1/2}\left(\int^{l}_0(\partial_z w)^{2}\,\textrm{d}z\right)^{1/2}+\frac{1}{l} \le l^{1/2}\langle|\boldsymbol{\nabla}\boldsymbol{u}|^{2}\rangle^{1/2}+\frac{1}{l}. \end{equation}
From the momentum equation, we have
 \begin{equation} \langle |\boldsymbol{\nabla}\boldsymbol{u}|^{2} \rangle=Ra\langle w\theta^{2}+w\theta_M^{2}-2w\theta\theta_M\rangle. \end{equation}
Because  $\langle w\theta \rangle =Nu-1\ {\rm and}\ \langle w\rangle =0$, we have
 \begin{equation} \langle |\boldsymbol{\nabla}\boldsymbol{u}|^{2} \rangle=Ra(\langle w\theta^{2}\rangle-2\theta_M(Nu-1)). \end{equation}
Using the rescaled energy equation (2.3) and multiplying it by  $z\theta$, we have
 \begin{equation} \tfrac{1}{2}(\partial_t(z\theta^{2})+\boldsymbol{\nabla}\boldsymbol{\cdot} (z\theta^{2}\boldsymbol{u})-w\theta^{2})=z\theta\nabla^{2}\theta. \end{equation}
Taking the spatial-temporal average of (A6) and by judicious use of boundary conditions, we have
 \begin{equation} \langle w\theta^{2}\rangle=2\langle z|\boldsymbol{\nabla}\theta|^{2}\rangle-1\le 2\langle|\boldsymbol{\nabla}\theta|^{2}\rangle=2Nu. \end{equation}
Here, we used the fact that  $0\le z\le 1$ and
 $|\boldsymbol {\nabla }\theta |^{2}\ge 0$. Hence
 $\langle |\boldsymbol {\nabla }\boldsymbol {u}|^{2} \rangle \le (3-2\theta _M)NuRa$ (here, we used the fact that
 $\theta _M<1\le Nu$). Further using (A3), we obtain
 \begin{equation} Nu \lesssim \sqrt{3-2\theta_M}\,l^{1/2}Ra^{1/2}Nu^{1/2}+\frac{1}{l}. \end{equation}
It tells us that the upper bound is lower when  $\theta _M$ increases from
 $\theta _M=0$. It indicates that the global heat flux will be lowered by the upper stably stratified layer. Optimizing over
 $l$, we choose
 $l\sim Ra^{-1/3} Nu^{-1/3}$, which yields
 \begin{equation} Nu\lesssim cRa^{1/2}. \end{equation}
The prefactor  $c$ is a constant number that is dependent on
 $\theta _M$, and the best value of
 $c$ should be determined numerically.
Appendix B. Numerical data for  $\theta _M=0.7$ when $Ra>10^{9}$


Note that the power exponent  $\gamma >1/3$ for
 $\theta _M=0.7$ in figure 12; here we added more data to show that
 $\gamma$ will be lowered when
 $Ra>10^{9}$. A best fitting was done in the range of
 $10^{8}\le Ra\le 5.623\times 10^{9}$ and the data show that
 $Nu\sim 0.018Ra^{0.323}$ (see figure 16).
The optimal Nusselt number  $Nu-1$ versus the Rayleigh number
 $Ra$ for
 $\theta _M=0.7$. Lines are obtained using best fitting. See also symbols in figure 11.

Appendix C. Numerical method
Equations (2.1)–(2.3) are solved using an influence matrix method. We use a Crank–Nicolson scheme for the linear terms, and the nonlinear terms are treated explicitly:
 \begin{gather} \boldsymbol{\nabla}\boldsymbol{\cdot}\boldsymbol{u}^{n+1}=0, \end{gather}
 \begin{gather} \frac{\boldsymbol{u}^{n+1}-\boldsymbol{u}^{n}}{\Delta t}+\boldsymbol{u}^{n}\boldsymbol{\cdot}\boldsymbol{\nabla}\boldsymbol{u}^{n}={-}\boldsymbol{\nabla}p^{n+1} +\frac{1}{2}Pr\nabla^{2}(\boldsymbol{u}^{n+1}+\boldsymbol{u}^{n})+PrRa(\theta^{n}-\theta_M)^{2}\boldsymbol{e}_z, \end{gather}
 \begin{gather} \frac{\theta^{n+1}-\theta^{n}}{\Delta t}+\boldsymbol{u}^{n}\boldsymbol{\cdot}\boldsymbol{\nabla}\theta^{n}=\frac{1}{2}\nabla^{2}(\theta^{n+1}+\theta^{n}), \end{gather}
where the superscript represents the time step.
Furthermore, we derive the pressure Poisson equation
 \begin{equation} {\nabla}^{2} p^{n+1}={-}\boldsymbol{\nabla}\boldsymbol{\cdot}\boldsymbol{u}^{n}\boldsymbol{\cdot}\boldsymbol{\nabla}\boldsymbol{u}^{n} +2PrRa(\theta^{n}-\theta_M)\frac{\partial\theta^{n}}{\partial z}. \end{equation}
Using Fourier series, we decompose  $p^{n+1}$ into
 \begin{equation} p^{n+1}=\sum^{N}_{{-}N+1} p^{n+1}_m\exp\left(\textrm{i}\frac{2{\rm \pi}}{L}mx\right), \end{equation}
then (C4) is decomposed into
 \begin{equation} (\text{D}^{2}-m^{2}\alpha^{2}) p^{n+1}_m=f_m,\quad \text{D}:=\frac{\textrm{d}}{\textrm{d}z}, \end{equation}
where  $f_m$ is the
 $m$th mode of the Fourier transform of the nonlinear term in (C4), which is dealiased using the
 $2/3$ rule. This ordinary differential equation is solved using a finite-difference method with non-uniform grids clustering near the walls (Chebyshev points), which has been well documented in Willis (Reference Willis2017). The derivatives are calculated using nine points, for which first/second-order derivatives are calculated to eighth/seventh order.
The influence matrix method is to decompose the pressure into two parts:
 \begin{equation} p^{n+1}_m=p_p+c_{-}p_{-}+c_{+}p_{+}, \end{equation}
where  $p_p$ is a particular solution satisfying (C6) with homogeneous boundary conditions
 \begin{equation} p_p=0,\quad z=0, 1. \end{equation}
The other two complementary solutions satisfy
 \begin{equation} (\text{D}^{2}-m^{2}\alpha^{2}) p_{{\pm}}=0. \end{equation}
The boundary conditions for  $p_{\pm }$ are non-homogeneous. In this study, we set
 $p_{+}=1$,
 $p_{-}=0$ at
 $z=0$ and
 $p_{+}=0$,
 $p_{-}=1$ at
 $z=1$.
After solving the pressure fields  $p_{p}$ and
 $p_{\pm }$, the velocity field is a linear combination of three solutions driven by the pressure fields:
 \begin{equation} \boldsymbol{u}^{n+1}_m=\boldsymbol{u}_p+c_{-}\boldsymbol{u}_{-}+c_{+}\boldsymbol{u}_{+}, \end{equation}
where  $\boldsymbol {u}_p$ is driven by
 $p_p$ and the nonlinear terms in the momentum equations; and
 $\boldsymbol {u}_{\pm }$ is solely driven by
 $p_{\pm }$. The two coefficients
 $c_{\pm }$ are determined using the continuity equation
 $\boldsymbol {\nabla }\boldsymbol {\cdot }\boldsymbol {u}=0$ at the boundaries:
 \begin{equation} \frac{\partial w^{n+1}_m}{\partial z}=0 \quad\Rightarrow\quad \frac{\partial w_p}{\partial z} + c_{-}\frac{\partial w_{-}}{\partial z} + c_{+}\frac{\partial w_{+}}{\partial z}=0. \end{equation}
It should be noted that, if using a small time step  $\Delta t$, we should integrate the system for a longer time such that the GMRES method can converge (Sondak et al. Reference Sondak, Smith and Waleffe2015), which will slow us down in finding a converged steady solution when
 $Ra>10^{7}$. In the present study, the Stokes preconditioner is applied and the system is integrated by one large time step
 $\Delta t=100$ (Tuckerman, Langham & Willis Reference Tuckerman, Langham and Willis2018), which has enabled us to compute optimal steady solutions up to
 $Ra=10^{9}$.